

Manufacturers/End Users
September 11, 2024
US light-vehicle sales show mixed movements in August
Written by David Schollaert
US light-vehicle (LV) sales improved to an unadjusted 1.42 million units in August, up 7.6% from a year ago, the US Bureau of Economic Analysis (BEA) reported. Despite the year-on-year (y/y) boost, domestic LV sales declined 4.5% month on month (m/m).
On an annualized basis, LV sales were 15.1 million units in August, down from 15.8 million units the month prior, disappointing the consensus forecast of 15.4 million units.
While market conditions remain healthy, with days’ supply only slightly below pre-pandemic levels, LV sales surprised to the downside in August. The culprit remains high financing costs, which are still weighing on sales.
Auto sales rose just 0.5% y/y, while light-truck sales jumped 9.4% from last year. Light trucks again accounted for 81% of August’s total sales, slightly above its 80% share last year.
August’s average daily selling rate (DSR) was 50,670 vehicles – calculated over 28 days – up 3.8% from the 48,837-unit daily rate one year ago.
Figure 1 below shows the long-term picture of US sales of autos and lightweight trucks from 2019 through August 2024. Additionally, it includes the market share sales breakdown of last month’s 15.1 million vehicles at a seasonally adjusted annual rate.
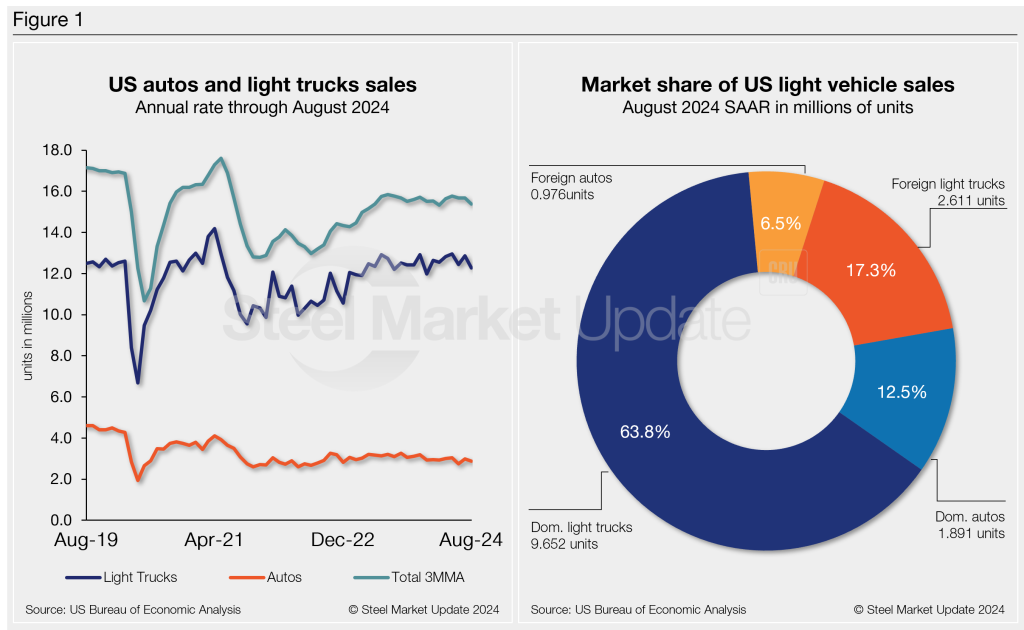
While auto production has largely recovered from the pandemic, inventories have slowly increased, although they remain well below 2019 levels.
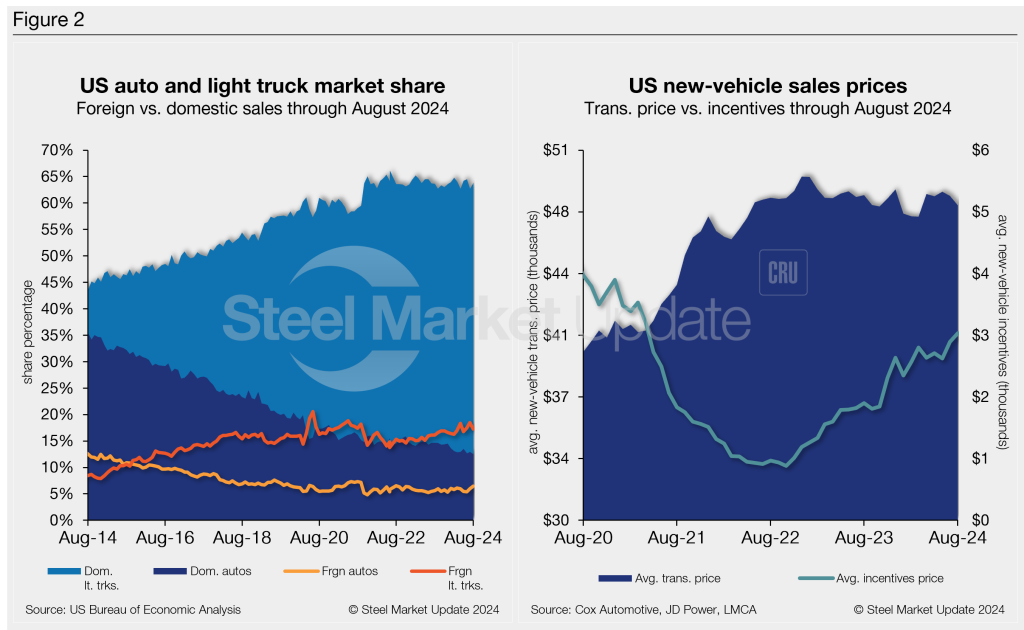
The new vehicle average transaction price (ATP) remains widely impacted by the lack of base trim models.
August’s ATP of $47,870 was -1.1% m/m and -1.2% (-$583 lower) y/y, according to data from Cox Automotive.
Incentives rose 4.9% m/m, reaching a 41-month high of $3,035. With the m/m increase, incentives now represent more than 6% of the ATP. Compared to last year, incentives are up nearly 60%, or $1,133.
The annualized selling rate of light trucks for August was 12.263 million units, down 4.6% vs. the prior month but 0.5% higher y/y. Annualized auto selling rates were down 4.1% m/m and 7.3% y/y.
Figure 2 details the US auto and light truck market share since 2014 and the divergence between average transaction prices and incentives in the US market since 2020.
Editor’s note: This report is based on data from the US Bureau of Economic Analysis (BEA), LMC Automotive, JD Power, and Cox Automotive for automotive sales in the US, Canada, and Mexico. Specifically, the report describes light-vehicle sales in the US.


