Manufacturers/End Users
August 15, 2024
North American auto assemblies fade in July
Written by David Schollaert
North American auto assemblies slumped by more than 14% from June, falling to a 20-month low in July. Assemblies were also down 1.5% year on year (y/y), according to LMC Automotive data.
A decline in auto production is typical for July, as automakers schedule summer outages for maintenance programs, facility updates, and model-year changeovers. However, this sharp drop in assemblies comes as carmakers downgrade and adjust vehicle output to meet curtailed market demand.
High-priced vehicles have been one factor preventing sales from pushing back into their pre-pandemic range of 16.5-17.0 million units. Minimal interest rate relief has also plagued buying, but potential Fed inflation cuts could help pull more buyers off the sidelines, with a trickledown effect on assemblies.
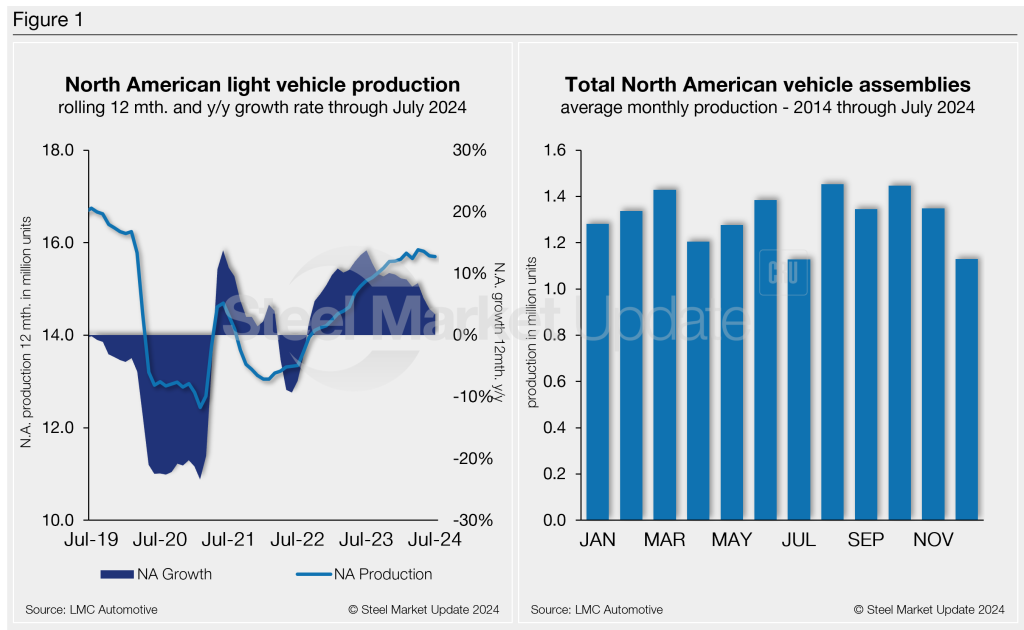
North American vehicle production, including personal and commercial vehicles, totaled 1.098 million units in July, a 14.4% decrease from 1.283 million units in June. It’s roughly 1.5% behind the 1.11 million units produced one year ago.
Below in Figure 1 is a five-year snapshot of North American light-vehicle production since 2019 on a rolling 12-month basis with a y/y growth rate. Also included is a five-year snapshot of the average monthly production, which includes seasonality since 2019.
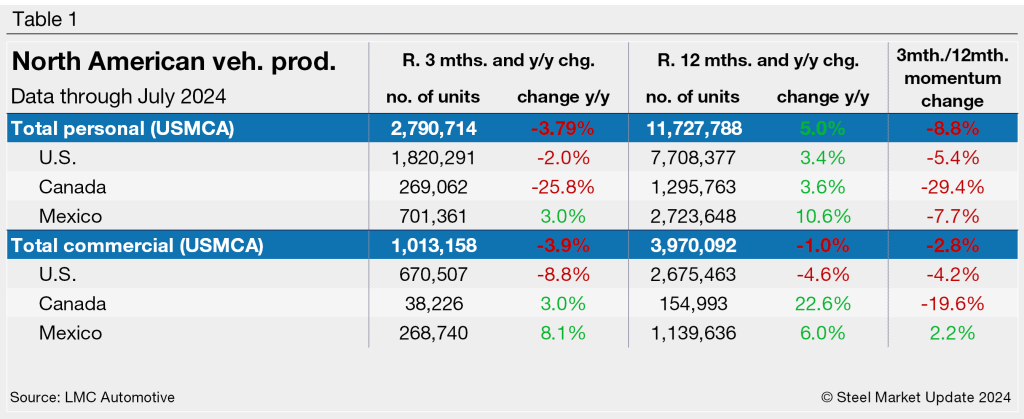
A short-term snapshot of assembly by nation and vehicle type is shown in the table below. It breaks down total North American personal and commercial vehicle production into US, Canadian, and Mexican components. It also includes the three- and 12-month growth rates for each and their momentum change.
For the three months and 12 months through July, the growth rate for total personal and commercial vehicle assemblies in the USMCA region is largely negative. The momentum change also remains noticeably behind for both personal and commercial vehicle segments.
Personal vehicle production
The longer-term picture of personal vehicle production across North America is shown below. The charts in Figure 2 show the total personal vehicle production for North America and the total for the US, Canada, and Mexico.
In terms of personal vehicle production, this segment saw a 14.6% m/m decline in July, down for a second straight month. The result was not as pronounced as the same period one year ago, with just a 0.9% loss.
The US saw a 14.9% m/m production loss, with 90,973 fewer units produced in July. Mexico produced 33,430 fewer units (-13.9%), while Canada’s production was down by 13,548 units (-15%).
Production share across North America was little changed. The US saw personal vehicle production share of the North American market at 65.2%, followed by Mexico and Canada at 25.1% and 9.6%, respectively.
Commercial vehicle production
Total commercial vehicle production for North America and the total for each nation within the region are shown in the first chart in Figure 3 on a rolling three-month basis. Commercial vehicle production in the US and Mexico and their y/y growth rates, as well as the production share for each nation in North America, are also shown.
North American commercial vehicle production was no better in July either. The region saw a 14% m/m decline with a total of 290,381 units, down by 47,380 from June. Output is down for a second consecutive month after almost reaching a five-year high in May. The result was also down 2.9% from last year.
The US saw a 16.1% m/m drop, with 36,031 fewer commercial vehicle assembled in July. Canada followed, down 35.2% (-4,971 units) and then Mexico, down 6.2% (-6,378 units).
Despite the sharp decline, July marked Canada’s 33rd consecutive month of assembling commercial vehicles, after ceasing production for nearly two years from January 2020 through October 2021.
The market share across the region was also largely unchanged. The US total share was 66.2%, followed by Mexico with a 30% share, and Canada with a 3.8% share in July.
Presently, Mexico exports just under 80% of its light-vehicle production, with the US and Canada as the highest-volume destinations.
Editor’s note: This report is based on data from LMC Automotive for automotive assemblies in the US, Canada, and Mexico. The breakdown of assemblies is “Personal” (cars for personal use) and “Commercial” (light vehicles with less than 6.0 metric tons gross vehicle weight rating; heavy trucks and buses are not included).