Market Data
September 18, 2023
Service Center Shipments and Inventories Report for August
Written by Estelle Tran
Flat Rolled = 54.1 Shipping Days of Supply
Plate = 61.2 Shipping Days of Supply
Flat Rolled
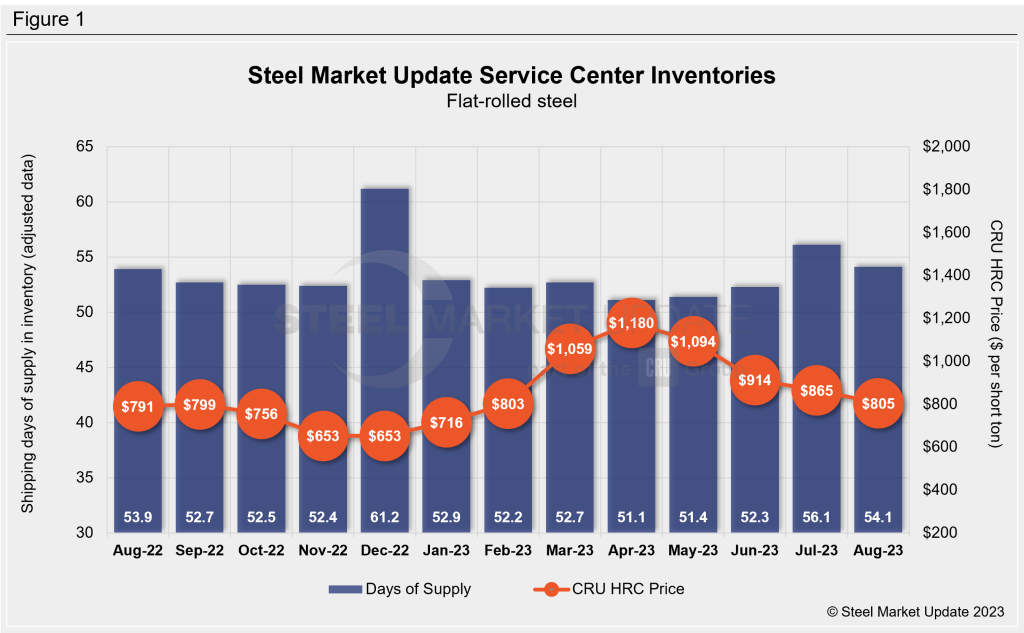
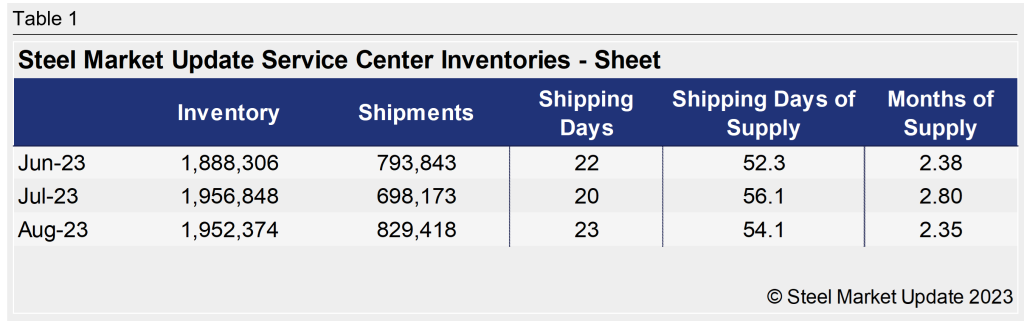
US service center flat-rolled steel inventories eased back in August with stronger shipments. At the end of August, service centers carried 54.1 shipping days of supply, according to adjusted SMU data, down from 56.1 shipping days of supply in July. The amount of flat rolled on hand in August represented 2.35 months of supply, down from 2.80 months of supply in July.
August had 23 shipping days, while July had 20. Inventories typically decrease in August with higher daily shipping rates, however, inventories this August were slightly higher than expected. Intake of flat-rolled steel at service centers – which is calculated by taking the latest inventory volumes and subtracting the previous month’s total inventory and then adding the total shipments – was at the highest level since January.
The amount of flat-rolled steel on order swelled in July and then eased back in August. The amount of flat-rolled steel on order represented 71.8% of inventories in August, down from 76.4% in July.
Most service centers have said that they are maintaining inventory. The latest SMU survey published Sept. 15said 65% of service centers were maintaining inventory while 35% were reducing inventory. The latest survey also found that 59% of service centers said their manufacturing customers were maintaining orders, while 41% said they were reducing orders.
We will be watching to see if demand gets more of a seasonal boost in September, though our expectations will change with an extended United Auto Workers union strike. If the strike lasts a week or longer, we could see service center shipments fall quickly in September and inventories rise.
Plate
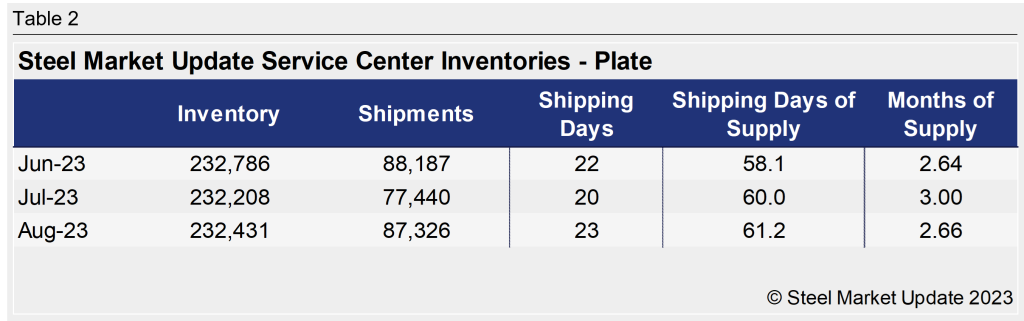
US service center plate inventories edged up in August with slower plate shipments. At the end of August, service centers carried 61.2 shipping days of plate supply, up from 60 days of plate supply in July. Plate inventories at the end of August represented 2.66 months of supply, compared to 3 months of supply at the end of July.
Unlike sheet, which saw the typical seasonal boost in shipments in August, the daily shipping rate for plate declined 2% month-on-month (MoM). In absolute terms, plate inventories were flat (MoM). Service centers have been working to reduce plate inventories in line with slowing demand, though with the drop-off in shipments these last couple of months, not all were successful. Some still said they viewed their inventories to be heavy – especially considering declining prices.
Service centers’ total shipping days of plate supply on order at the end of August was down from July. The plate on order at the end of August represented 59.3% of inventories, down from 63.9% in July.
With some service centers’ resale prices falling below replacement costs and softer demand indications, service center contacts said they will continue to pare down their inventories. The amount of material on order fell for the fifth consecutive month in August. Increasing domestic supply, competitive import prices, and short lead times are also adding to bearish outlooks.