Market Data
August 31, 2023
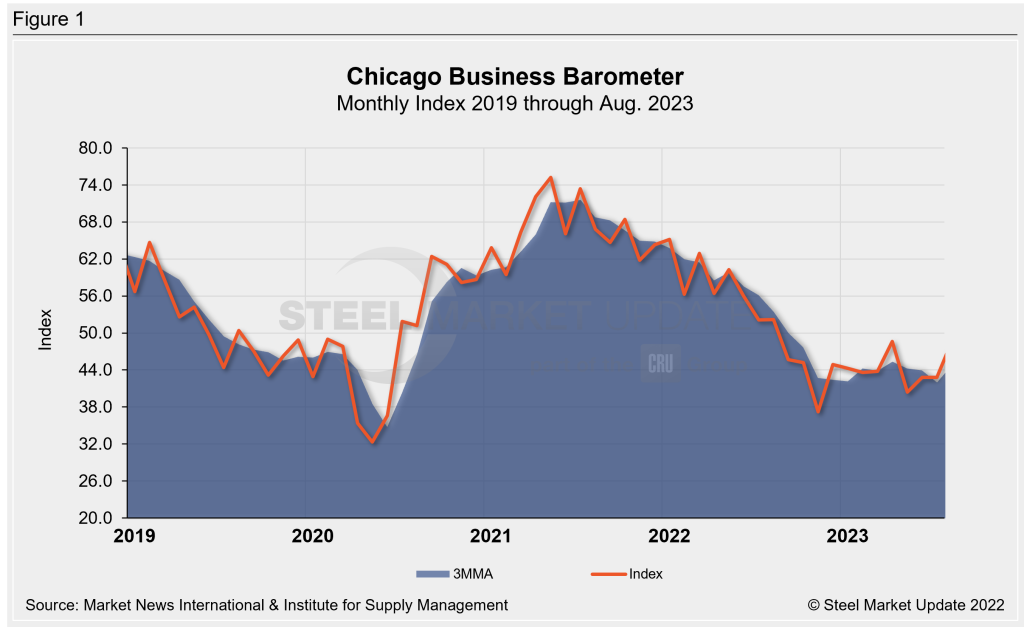
Chicago Business Barometer Rises for Third Consecutive Month
Written by Becca Moczygemba
The Chicago Business Barometer edged up in August. This was the third consecutive monthly increase, according to the latest indicators from Market News International (MNI) and the Institute for Supply Management (ISM).
The Barometer rose by 5.9 points from July, bringing the index to 48.7 in August – the highest level since August 2022.
Although August showed improvement over July, the indicator remained in contraction territory. A reading above 50 shows expansion, while below 50 indicates contraction.
MNI Indicators show that Chicago business activity increased, with new orders, production, and employment all growing. Employment was the only area to shrink.
Production grew by 12 points to 57.1 and was the highest number reported since May 2022. Although employment rose by 8.6 points to 48.3, the reading must be over 50 to indicate growth.
Over 50% of respondents reported having to pay higher prices due, with prices paid reaching its highest level since October 2022.
For the Chicago Business Barometer, Chicago-area purchasing and supply management professionals are polled every month to assess business conditions for their respective companies.
An interactive history Chicago Business Barometer Index is available on our website.