Prices

July 13, 2023
HRC Futures: New High on Light Volume for Technically Weak Bull Market
Written by David Feldstein
June 1 was the most recent low for CME Midwest HRC futures. At that time, the curve was approximately flat around $800 per short ton (st).
Since then, the August future has rallied $188/st, settling today at $983/st, while the September future has rallied $160/st, settling today at $953/st.
The chart below compares the curve on those two dates with each month’s price change in the panel at the bottom.
CME Hot Rolled Coil Futures Curve $/st
Aggregate open interest is the number of outstanding futures contracts, or tons in this case, across a product’s futures curve. On June 13, 10 days after the May future’s expiration, open interest was at 533.2K tons. As of Wednesday night, open interest across the curve stood at 483K tons, down 50k tons month over month (MoM).
A rally or selloff is considered a “technically strong” bull or bear market if it is accompanied with expanding open interest. For instance, open interest exploded from 500K to 700K during Q1 of 2021. Of course, that was the strongest HRC futures market in terms of price appreciation and duration.
Open interest took another leg up in September of that year, more on that below. Both periods are circled in yellow below. The current rally has been accompanied by contracting open interest and is thus a “technically weak” rally.
Rolling Second Month CME HRC Future $/st and Curve Open Interest (red)
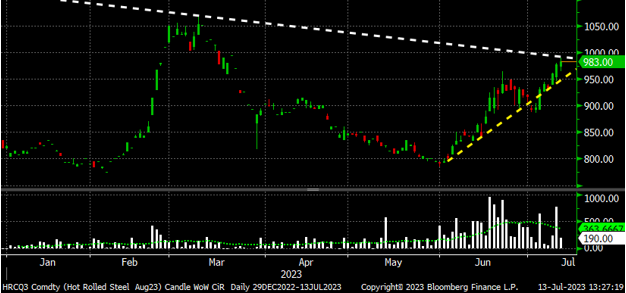
As noted above, the August future has skyrocketed since bottoming at $801/st on June 1. The August future rallied to as high as $875/st on heavy volume in mid-June. Then it drifted back down, breaking below its up trendline (yellow in the chart below) on July 3. However, it has found a second wind over the past few trading sessions in response to the unplanned outage at SDI’s steel mill in Sinton, Texas.
The second leg of the rally has made a higher high. But it has been on much lighter volume (bottom panel) and is now approaching its long term down trendline. Will it break above the trendline, or will it find resistance at the $990/st level?
August CME Hot Rolled Coil Future $/st
Some of my conversations in recent days have been about the surprising rally in the August future, especially considering it is pricing in not only another round of price increases but also those price increases being fully accepted by the spot market. In fact, the CRU would have to climb a good amount above $1,000/st in order to get the August future to settle above $983/st at settlement. One source told me he believes there are day traders in the HRC futures now looking to “scalp” trades, which is simply to buy a future expecting to quickly sell it back out for a small profit.
Having traded for more than two decades and having traded HRC for more than 10 years, I like to believe I have been humbled by my experiences, some of which have been rather traumatic. Instead of stubbornly declaring the rally in the August future is “crazy,” I wonder what it is I am missing here. Then again, perhaps the run-up in August on light volume has gotten out of hand and is instead these day traders and such who have become overly excited, perhaps even irrational?
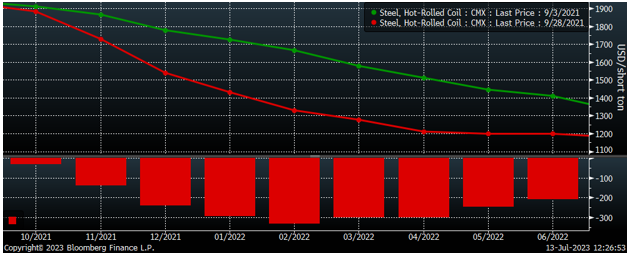
Another surprise has been the lack of commercial interest, specifically service centers seeking to hedge downside risk by selling futures. Service centers have been conspicuously absent during this rally. Simply look at the open interest or commitment of traders report for the evidence of this. Revisiting my point about technically strong markets above, it was in September 2021 when open interest took another leg up expanding from 653K tons on Sept. 3 to 810K tons on Sept. 28 as service centers and importers rushed in to the market to hedge.
Feb. 2022 CME HRC Future $/st & Curve Open Interest (red)
Over those 25 days, the market crashed with the February 2022 future dropping the most – a whopping $334/st in 17 trading days while other months on the curve plummeted $200-$300/st over the same period.
CME Hot Rolled Coil Futures Curve $/st
Will HR futures see an abrupt rush of commercial participants looking to hedge this year as we did in 2021? Or are we in for another sharp move higher?
On Aug. 9 of last year, Nucor announced a $50/st price increase. The futures market reacted quickly, with the October future jumping $55/st in 48 hours to a high of $915/st. However, the October future closed at $830/st on August 16, only four trading sessions later, on its way to a final settlement of $756/st. On Jan. 17 of this year, Cleveland-Cliffs kicked off a price-increase parade with the April future closing that day at $821/st only to peak at an intraday high of $1,350/st on March 9
So what is it going to be? Is HRC on its way back into quadruple-digit territory? Or is this moment like the scene in the movie The Perfect Storm, when the crew of the Andrea Gail celebrates the sun coming out after an epic battle with Hurricane Grace only to be face-to-face with a rogue wave moments later.
Or perhaps the market is moving into a tight range? All I can guarantee you is that this market is not for the faint of heart. Keep an open mind about prices, my friend.
Editor’s note: Want to learn more about steel futures? Attend the “Managing Price Risk Workshop” at our Steel Summit conference on Monday, Aug. 21, at 10 am. You can see the full agenda here and register here.
Disclaimer: The content of this article is for informational purposes only. The views in this article do not represent financial services or advice. Any opinion expressed by Feldstein should not be treated as a specific inducement to make a particular investment or follow a particular strategy, but only as an expression of his opinion. Views and forecasts expressed are as of date indicated, are subject to change without notice, may not come to be and do not represent a recommendation or offer of any particular security, strategy or investment. Strategies mentioned may not be suitable for you. You must make an independent decision regarding investments or strategies mentioned in this article. It is recommended you consider your own particular circumstances and seek the advice from a financial professional before taking action in financial markets.
By David Feldstein, Rock Trading Advisors, davidfelstein@rocktradingadvisors.com


