Market Data

June 2, 2023
Employment by Industry: May Gains Come in Ahead of Predictions
Written by David Schollaert
The US labor market added 339,000 jobs in May, up from April’s payroll gain of 253,000 and well ahead of consensus estimates of 190,000, according to data from the Bureau of Labor Statistics (BLS). Last month’s result marked the 29th straight month of positive job growth.
Despite the surprise jobs gain, the unemployment rate rose to 3.7% in May, up from 3.4% in April and above the pre-pandemic jobless rate low of 3.5%.
The labor market’s resilience has been a bright spot and surprise despite strong economic headwinds. Following the historic loss of 22 million jobs at the onset of the pandemic, the recovery was sharp and swift. May’s hiring boost nearly matched the 12-month average of 341,000 in a job market that has held up remarkably in a slowing economy. Still, despite the positive jobs report, the 12-month average is well below the 562,000 new jobs added per month on average last year, according to BLS data.
Job gains last month were driven by professional and business services with a net 64,000 new hires. Government added 56,000 jobs, while health care contributed 52,000. Other notable gainers included leisure and hospitality (48,000), construction (25,000), and transportation and warehousing (24,000).
The labor force participation rate was unchanged for the third straight month, with a reading of 62.6%. The rate is below the pre-pandemic level of 63.4%.
Shown below in Figure 1 is the total number of people employed in the non-farm economy as well as the month-on-month (MoM) net change in total jobs in May.

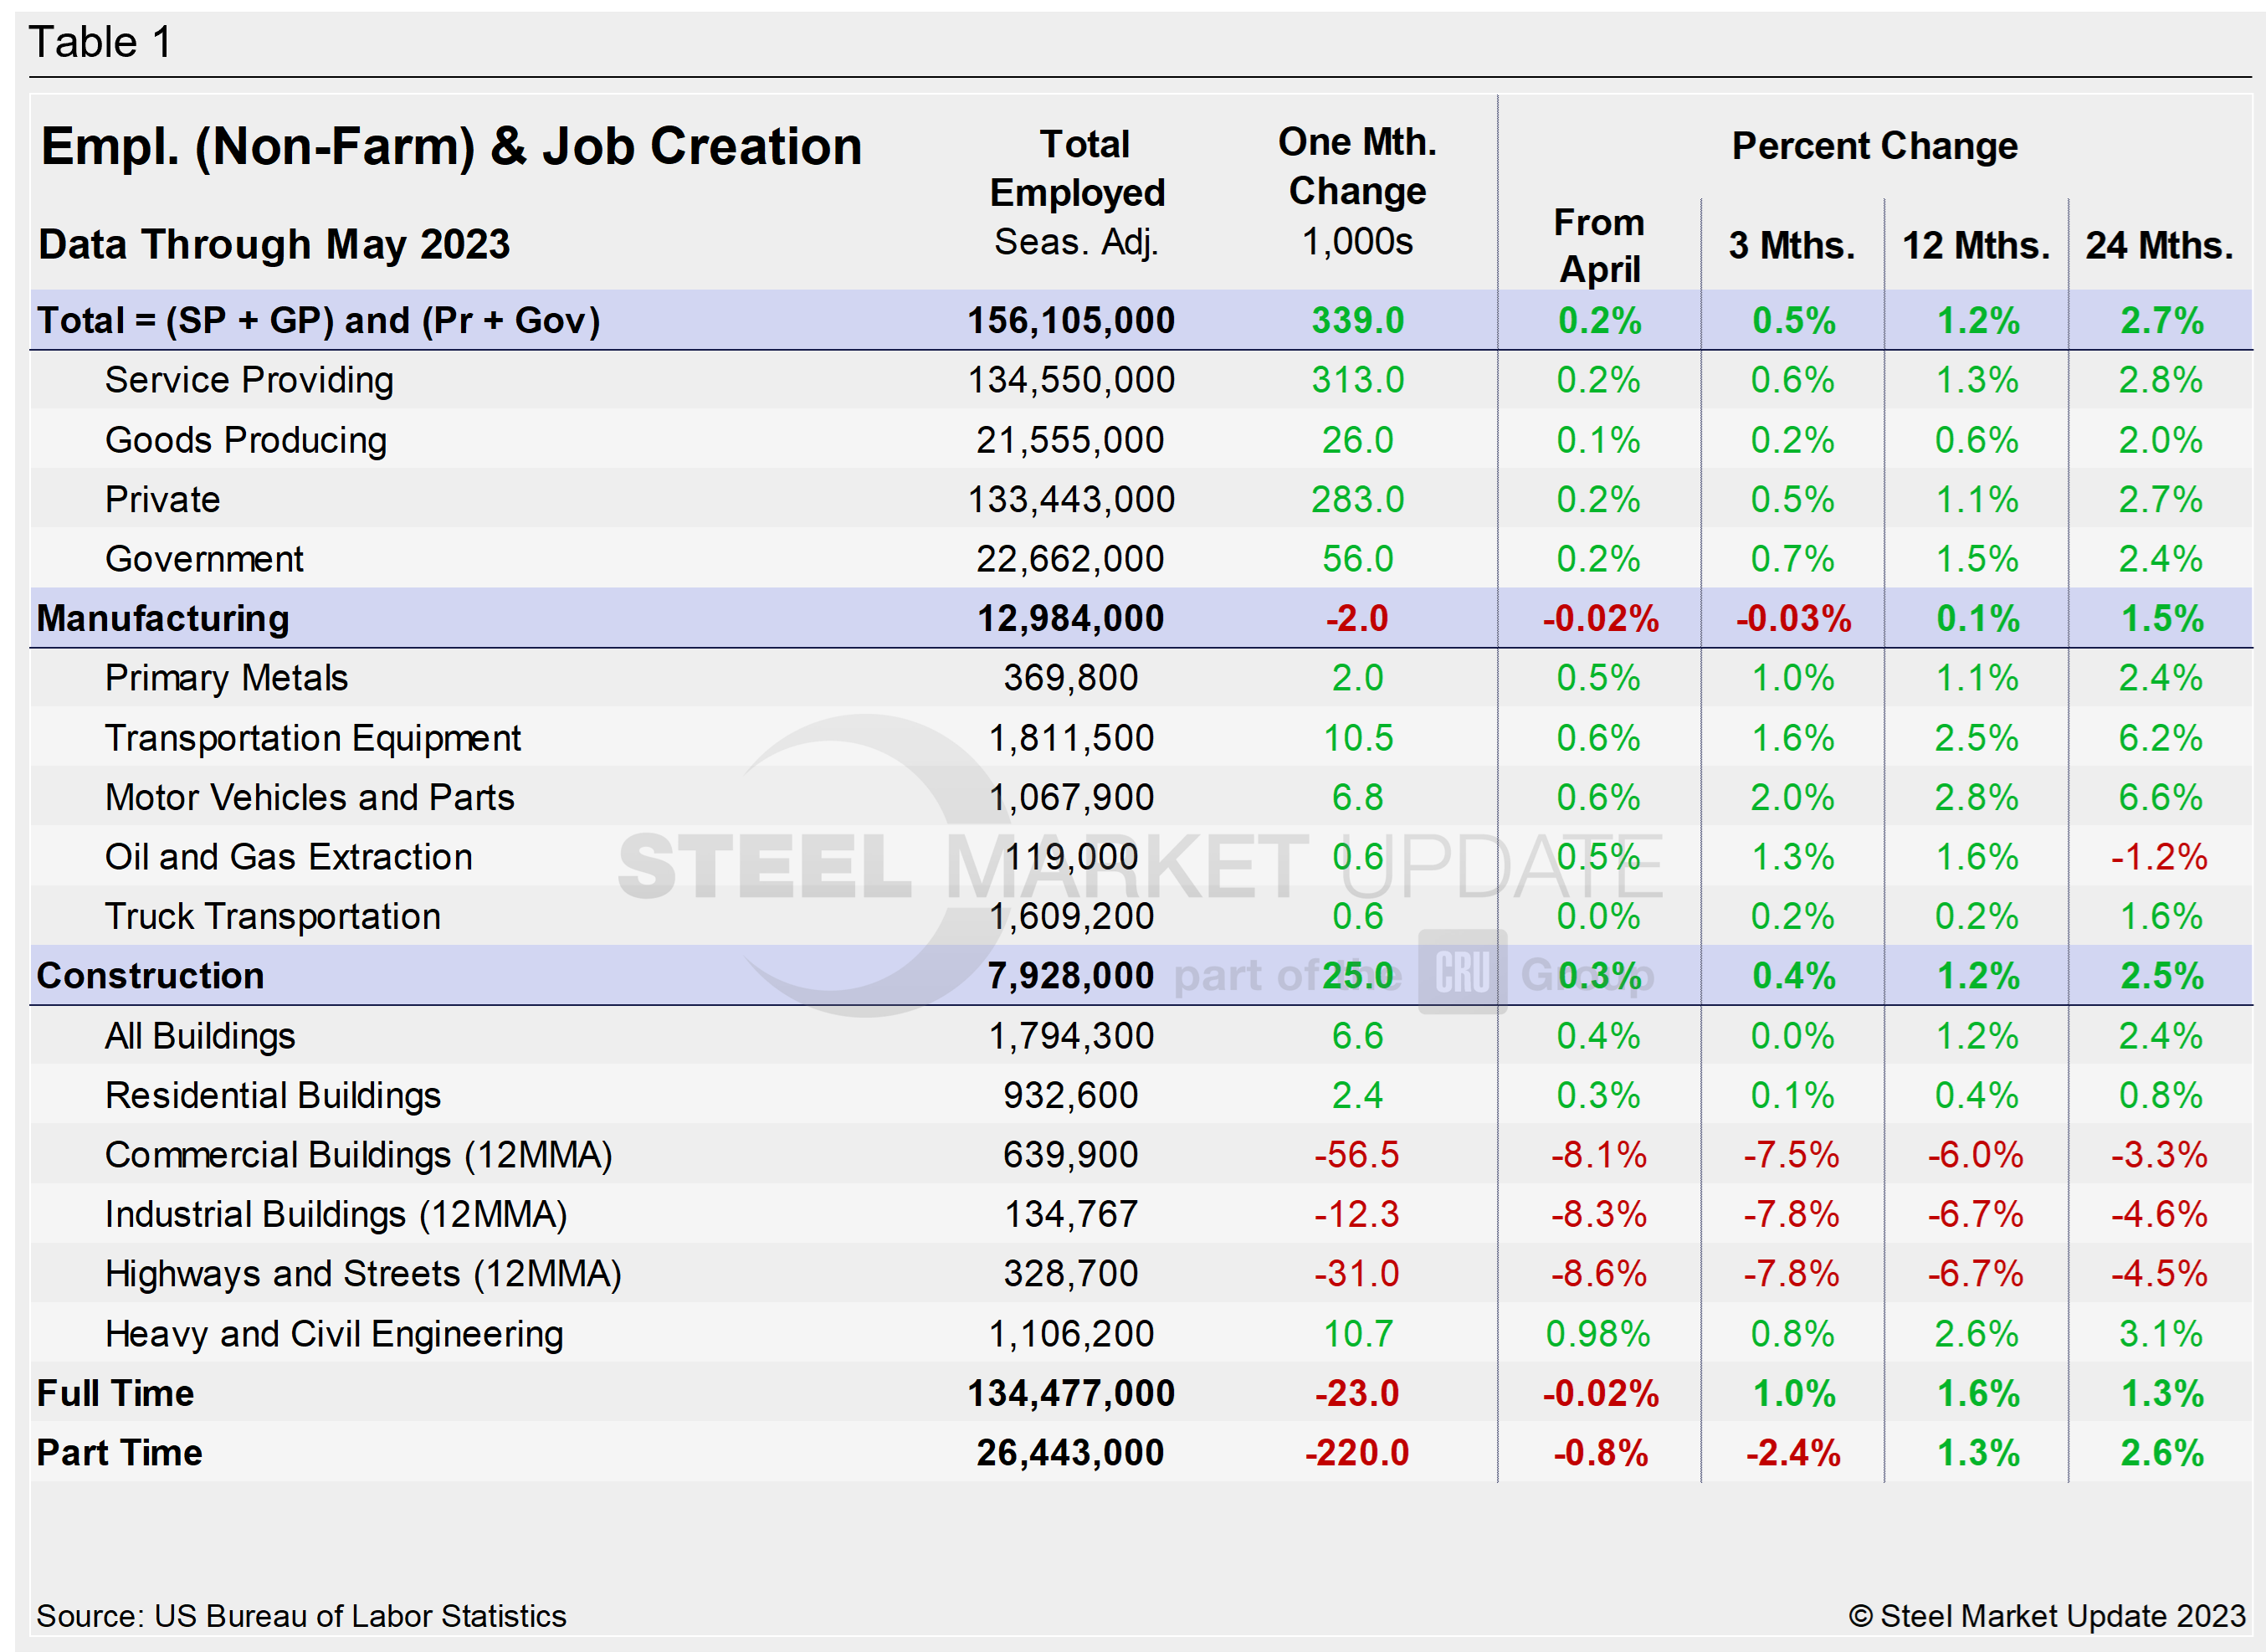
Designed on rolling time periods of one month, three months, one year, and two years, the table below breaks total employment into service industries and goods-producing industries, and then into private and government employees. Most of the goods-producing employees work in manufacturing and construction.
Comparing service and goods-producing industries in May shows both increased marginally. The steady and repeated gains have kept both above pre-pandemic levels, where they’ve been for the past 12 months. Construction continues to underperform, though the data shows firms would have added significantly more workers if they were available.
Note that the subcomponents of both manufacturing and construction shown in this table do not add up to the total because we have only included those with the most relevance to the steel industry.

Comparing May to April, manufacturing employment was marginally down, 0.02% lower, a slight decline from growth of 0.1% seen in the past three months. Construction was up 0.3% MoM, but some subsectors have struggled. Overall, commercial and industrial buildings have taken a more notable hit. Heavy and civil engineering, a sector that suffered little during the pandemic remains a bright spot.
Manufacturing employment slowed in May, adding just under 13,000 jobs, 2,000 less than in April but largely on par with its performance to date in 2023. Construction’s 25,000 payroll gain last month was an improvement from the 13,000 new payrolls added in April. Regardless, the latest gains are a far cry from the bigger boosts seen in recent months.
Construction and manufacturing unemployment both decreased in May, repeating the same trend seen over the past three months. Construction unemployment declined 16.3% MoM from 424,000 in April to 355,000 last month. Manufacturing unemployment was down 4.7% MoM, from 429,000 in April to 409,000 in May. Both sectors are still being heavily impacted by supply-chain disruptions, labor force constraints, and inflation.
The history of employment and unemployment in manufacturing and construction since January 2010 is shown below side-by-side in Figure 2, seasonally adjusted.

Figure 3 details employment comparisons between private and government jobs, as well as services and goods-producing jobs.

Explanation: On the first or second Friday of each month, the Bureau of Labor Statistics releases the employment data for the previous month. Data is available at www.bls.gov. The BLS employment database is a reality check for other economic data streams such as manufacturing and construction. It is easy to drill down into the BLS database to obtain employment data for many subsectors of the economy. The important point about all these data streams is not necessarily the nominal numbers, but the direction in which they are headed.
By David Schollaert, david@steelmarketupdate.com


