

Analysis

November 15, 2022
North American Auto Assemblies Increase in October
Written by David Schollaert
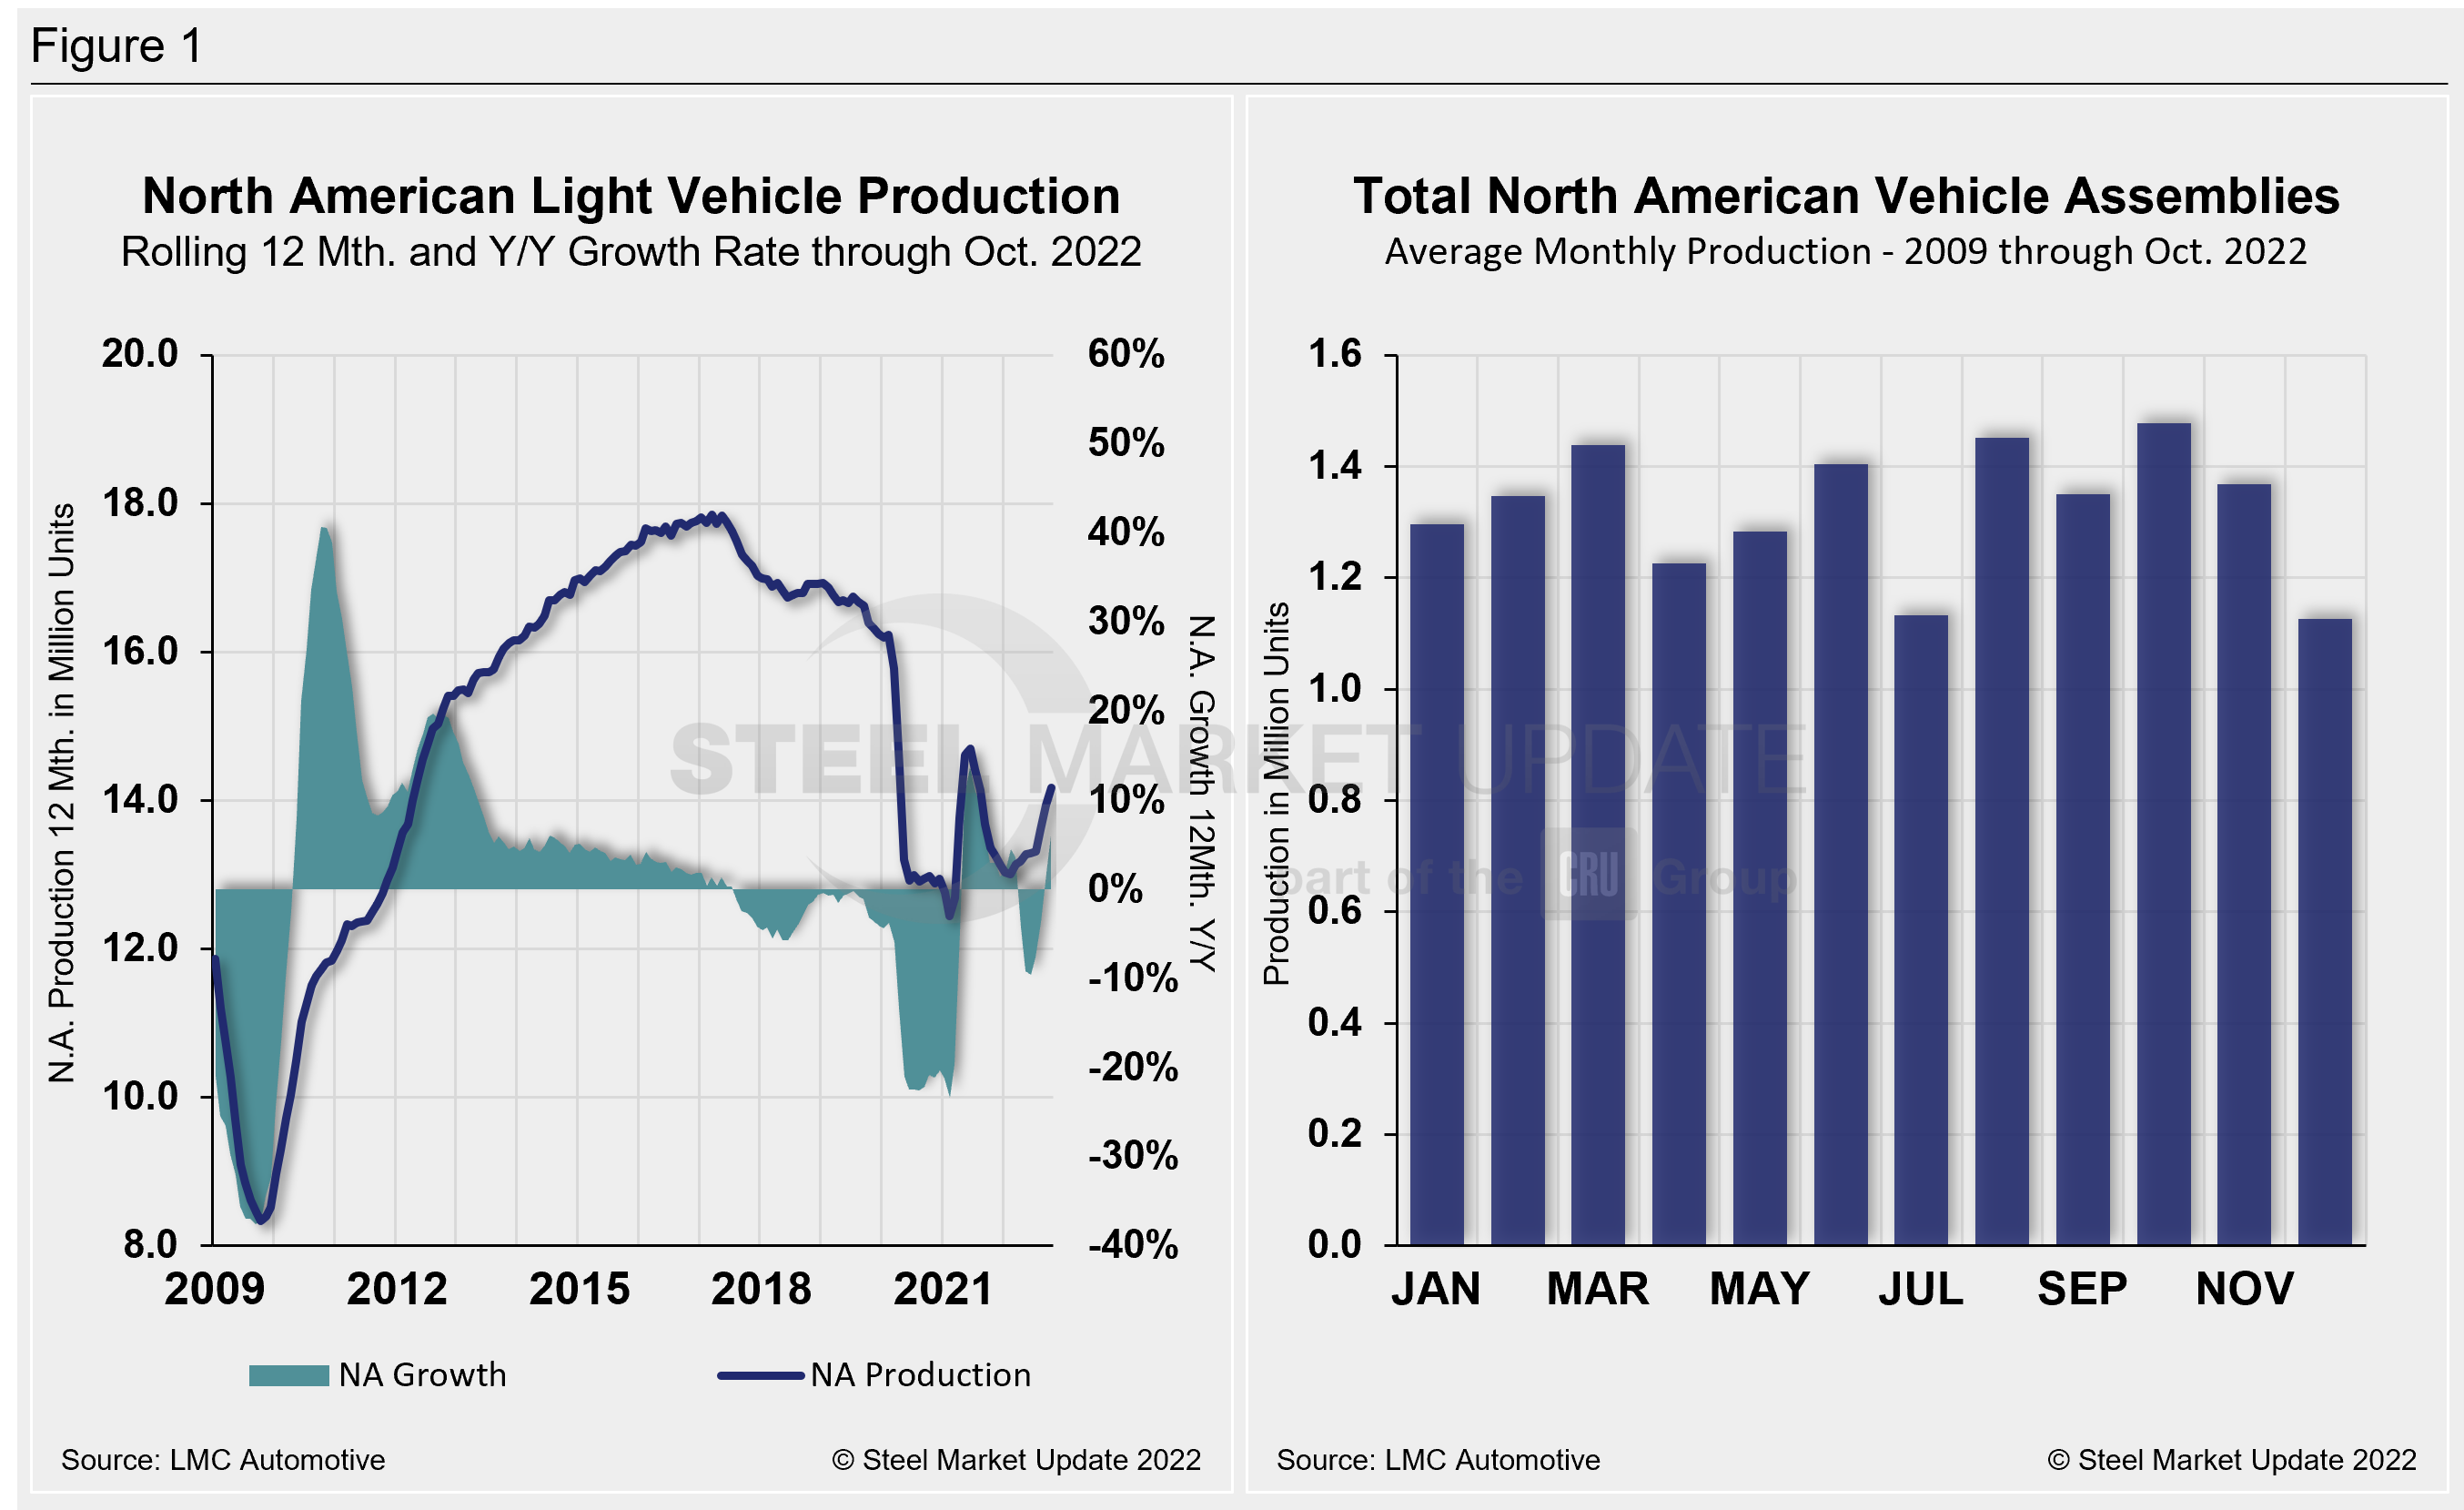
North American auto assemblies rose by 8.7% in October, rebounding from a similar decline in September. Last month’s assembly output was the third-best total year-to-date (YTD) and nearly 22% higher year-on-year (YoY), according to LMC Automotive data.
Though the market remains supply-constrained due to ongoing parts and supply shortages, production in October continued to show signs that the situation is improving.
Supply-chain constraints have continued to improve, aiding production, and boosting dealership inventory. Despite the improvements, ongoing parts and chip shortages are expected to remain a factor for the near- to medium-term.
The impact of the global semiconductor crisis on the North American automotive market cannot be understated. The early onset of the pandemic certainly slowed auto assemblies, however, the chip scarcity led to extensive production halts, delays, and inventory shortages.
Though at times slow, the recovery has been remarkable, especially over the past few months. Yet, there is still some ground to be made up. When compared to the last ‘normal’ year in 2019, production is down just 2.7% and building.
To boot, new-vehicle inventory levels last month experienced modest improvement, with retail units exceeding the one million mark for the first time since May 2021. Despite the improvements, October was yet another month where supply constraints kept vehicle sales artificially low but delivered record transaction prices and dealer profitability.
North American vehicle production, including personal and commercial vehicles, totaled 1.347 million units in October, up from 1.239 million units in September, and better than the 1.107 million units produced one year ago.
Below in Figure 1 is North American light vehicle production since 2009 on a rolling 12-month basis with the YoY growth rate. Also included is the average monthly production, which includes seasonality, over the same period.
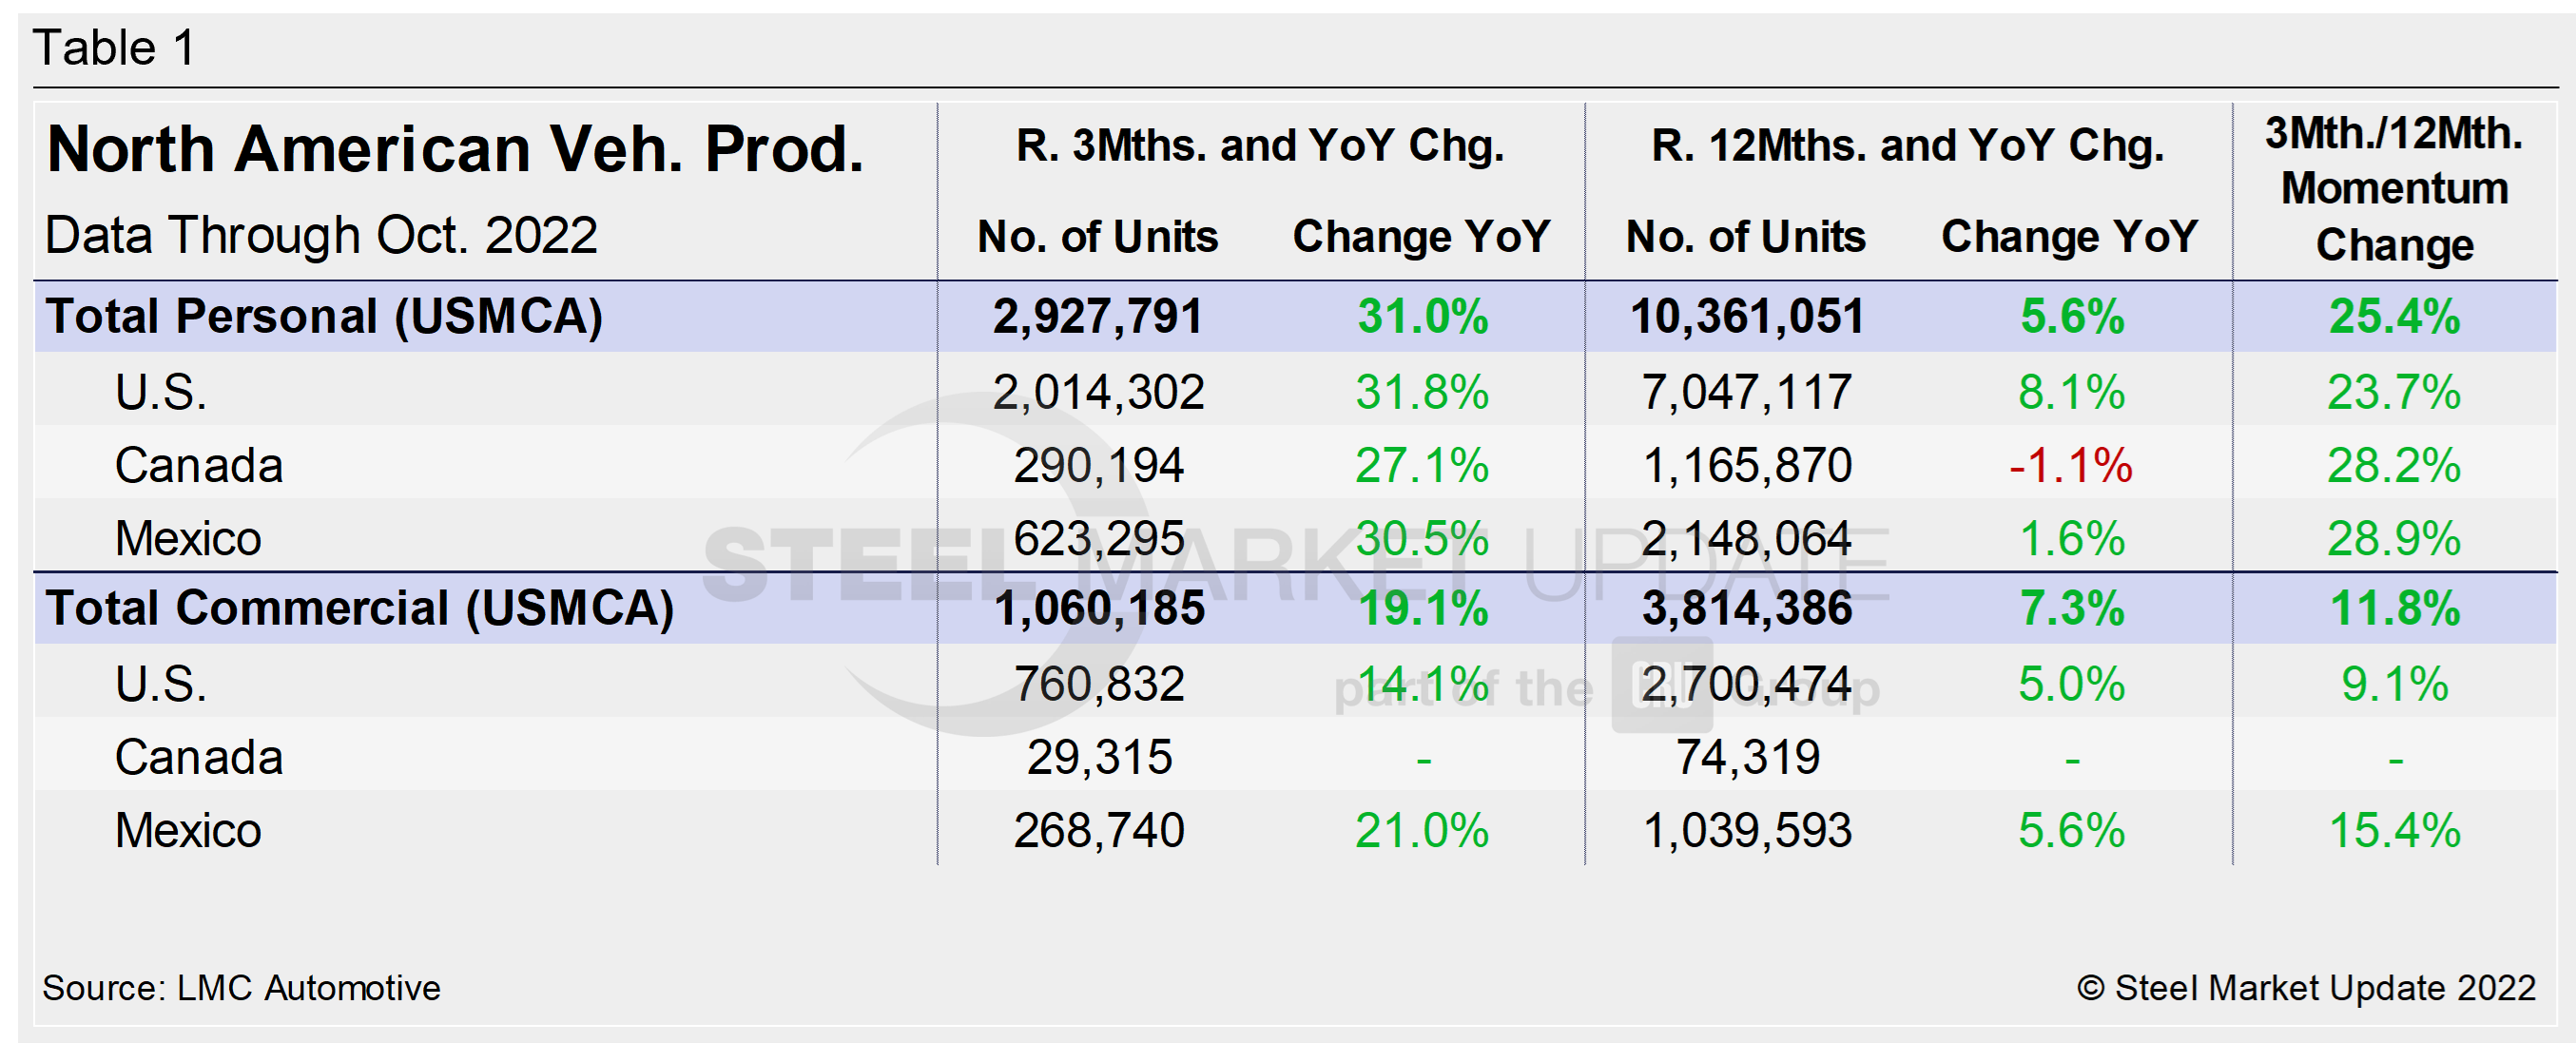
A short-term snapshot of assembly by nation and vehicle type is shown in the table below. It breaks down total North American personal and commercial vehicle production into US, Canadian and Mexican components, along with the three- and 12-month growth rates for each and their momentum change.
The initial recovery from Covid’s early spread was significant, but the effect of the chip and parts shortage was crippling and prolonged. Through last September, growth rates for personal and commercial light vehicles were -28.3% and -15.5%, respectively, owing to the ongoing chip shortage and supply-chain disruptions. They have since recovered nicely, now both posting strong double-digit gains.
For the three months through October, the growth rate for total personal and commercial vehicle assemblies in the USMCA region is up noticeably. On a 12-month basis, the story is a bit different, but improving.
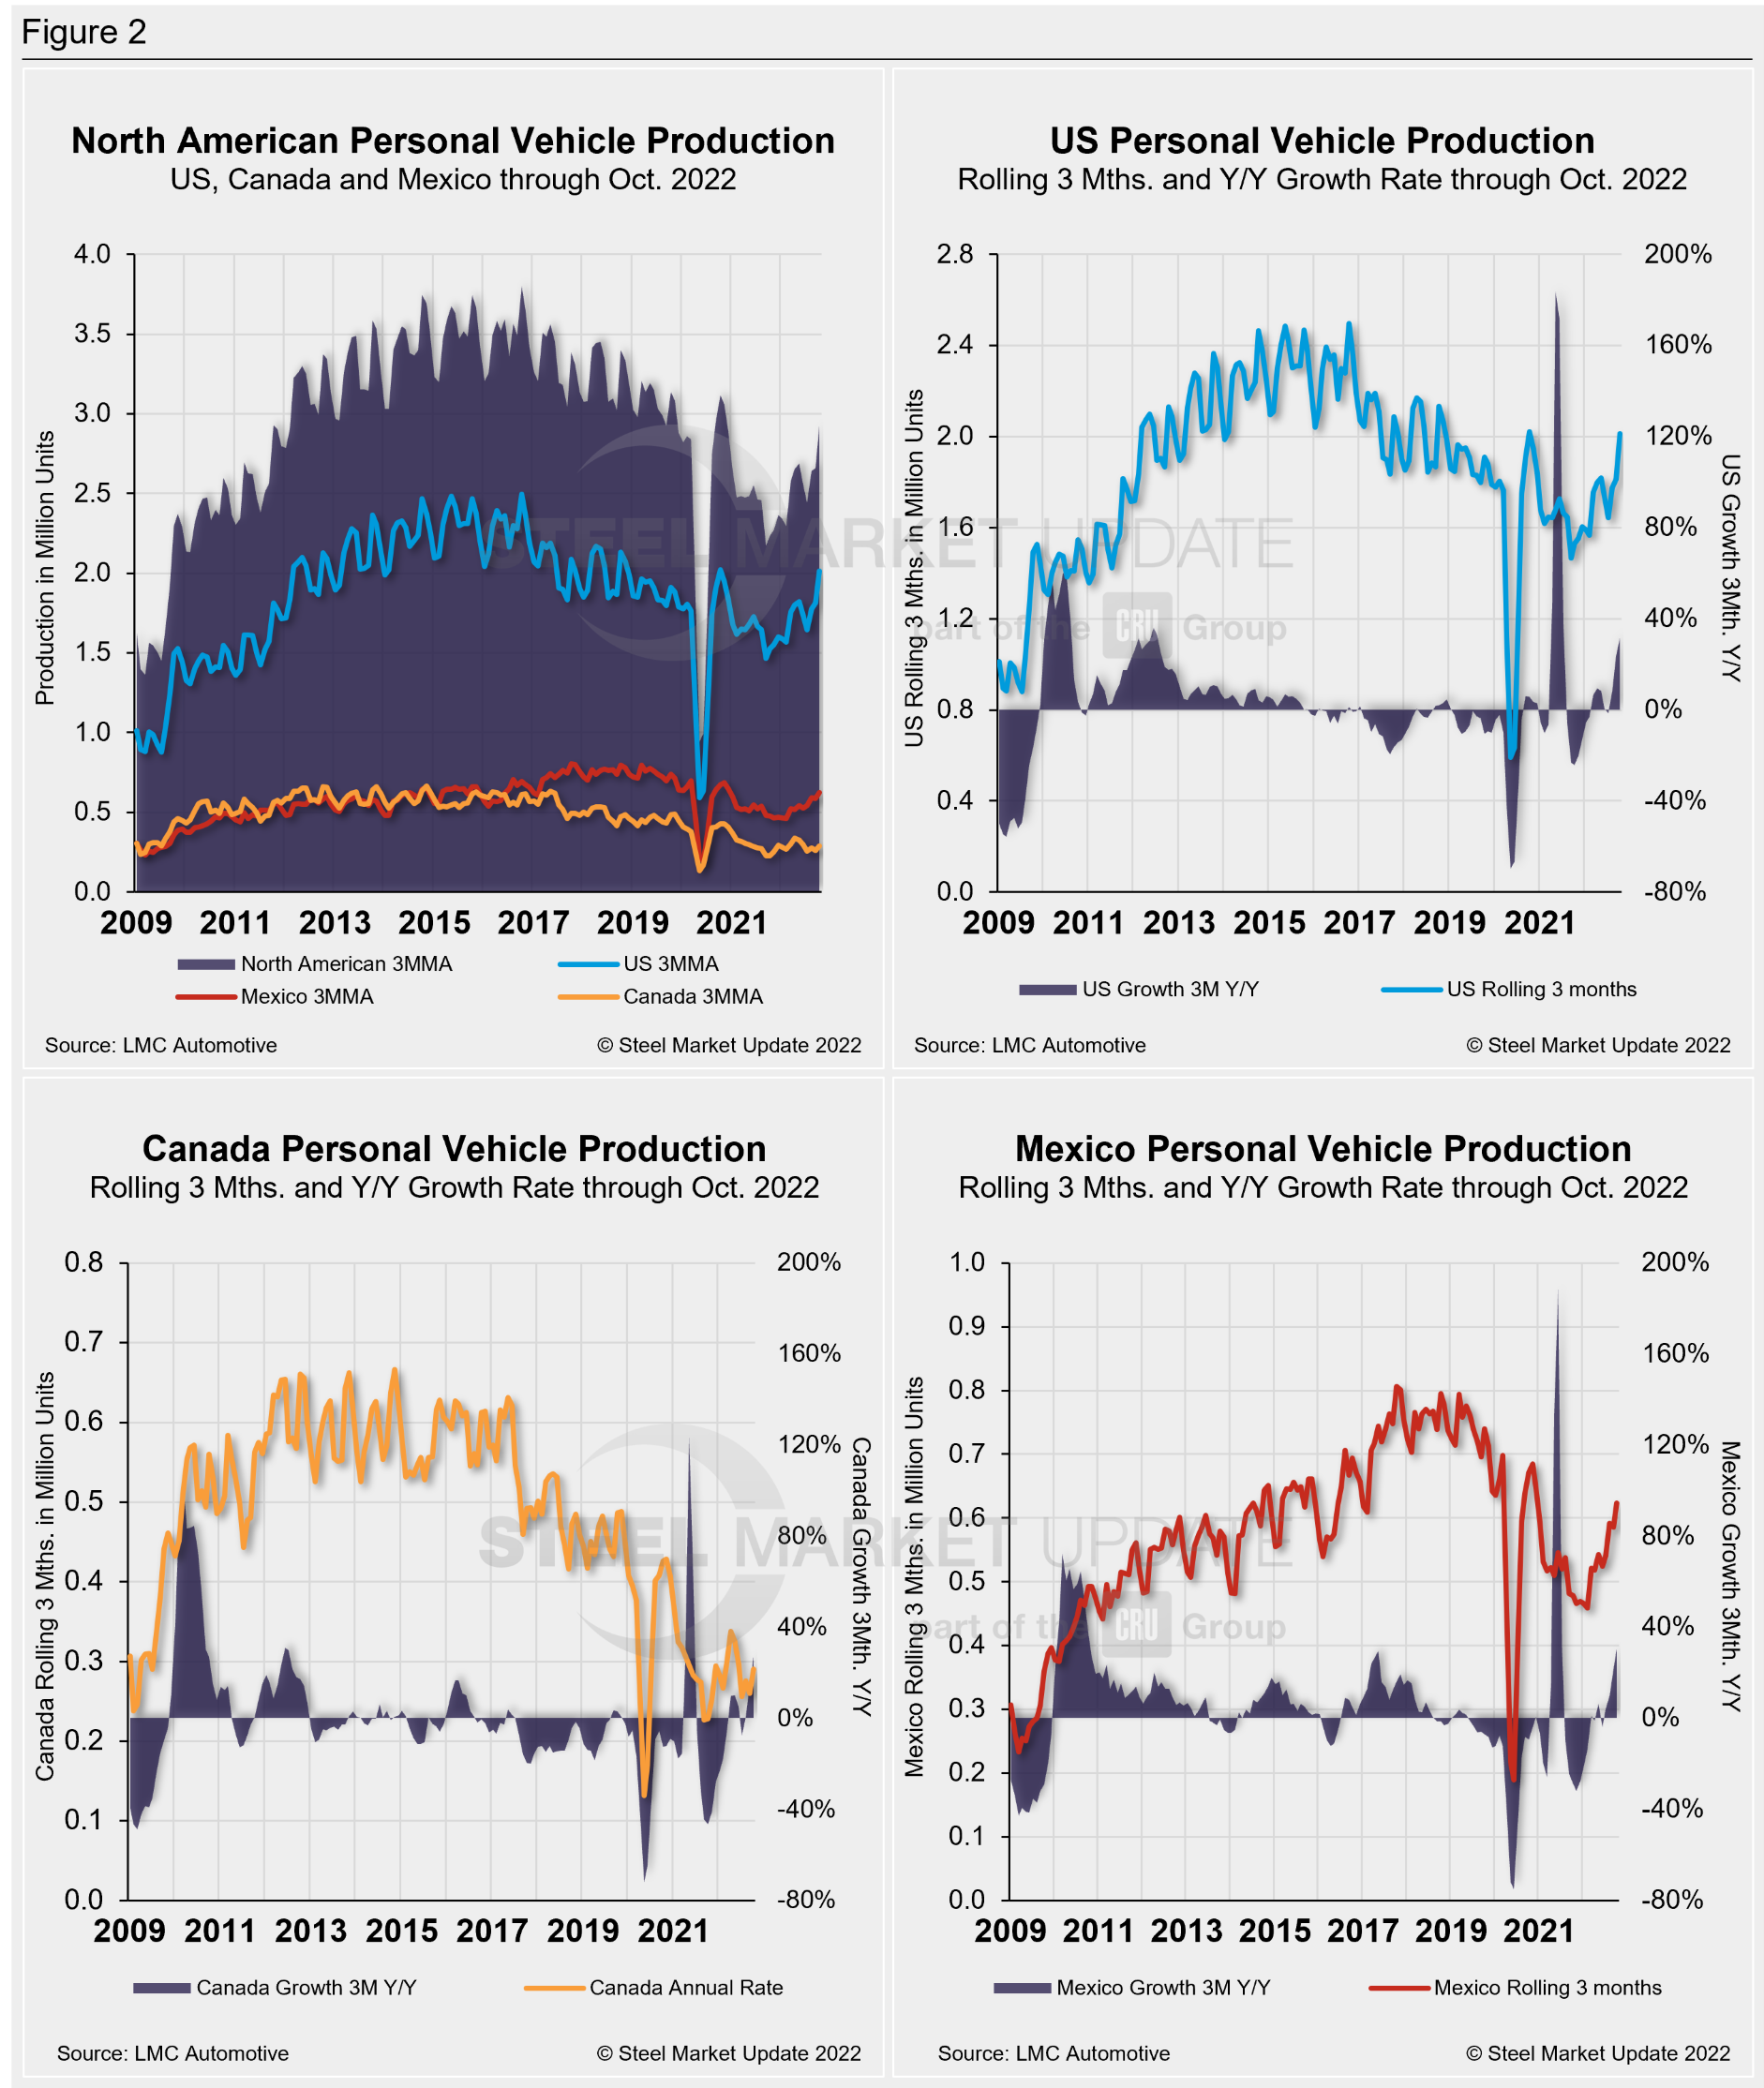
Personal Vehicle Production
The longer-term picture of personal vehicle production across North America is shown below. The charts in Figure 2 show the total personal vehicle production for North America and the total for the US, Canada, and Mexico. Personal vehicle production in the US, Canada, and Mexico and their YoY growth rate are also displayed.
In terms of personal vehicle production, all three countries saw MoM increases in October.
Mexico saw the largest increase in units produced and percentage growth in October versus September, up 31,274 units (+17%). It was followed by the US, up 30,702 units (+4.8%), and Canada, which added another 13,448 units (+15.6%) MoM.
The annual growth rate across the region in October was up. The US saw the sharpest gain, a 31.8% growth rate last month, followed by Mexico, expanding at 30.5%, and Canada, up 27.1%.
Production share across the region was largely unchanged. Mexico saw its personal vehicle production share of the North American market edge down by 0.7 percentage points to 21.3%. Canada was up just 0.1 percentage point to 9.9%. The US saw its share of the North American market edge up fractionally to 68.8% in October, 0.6 percentage points higher MoM.
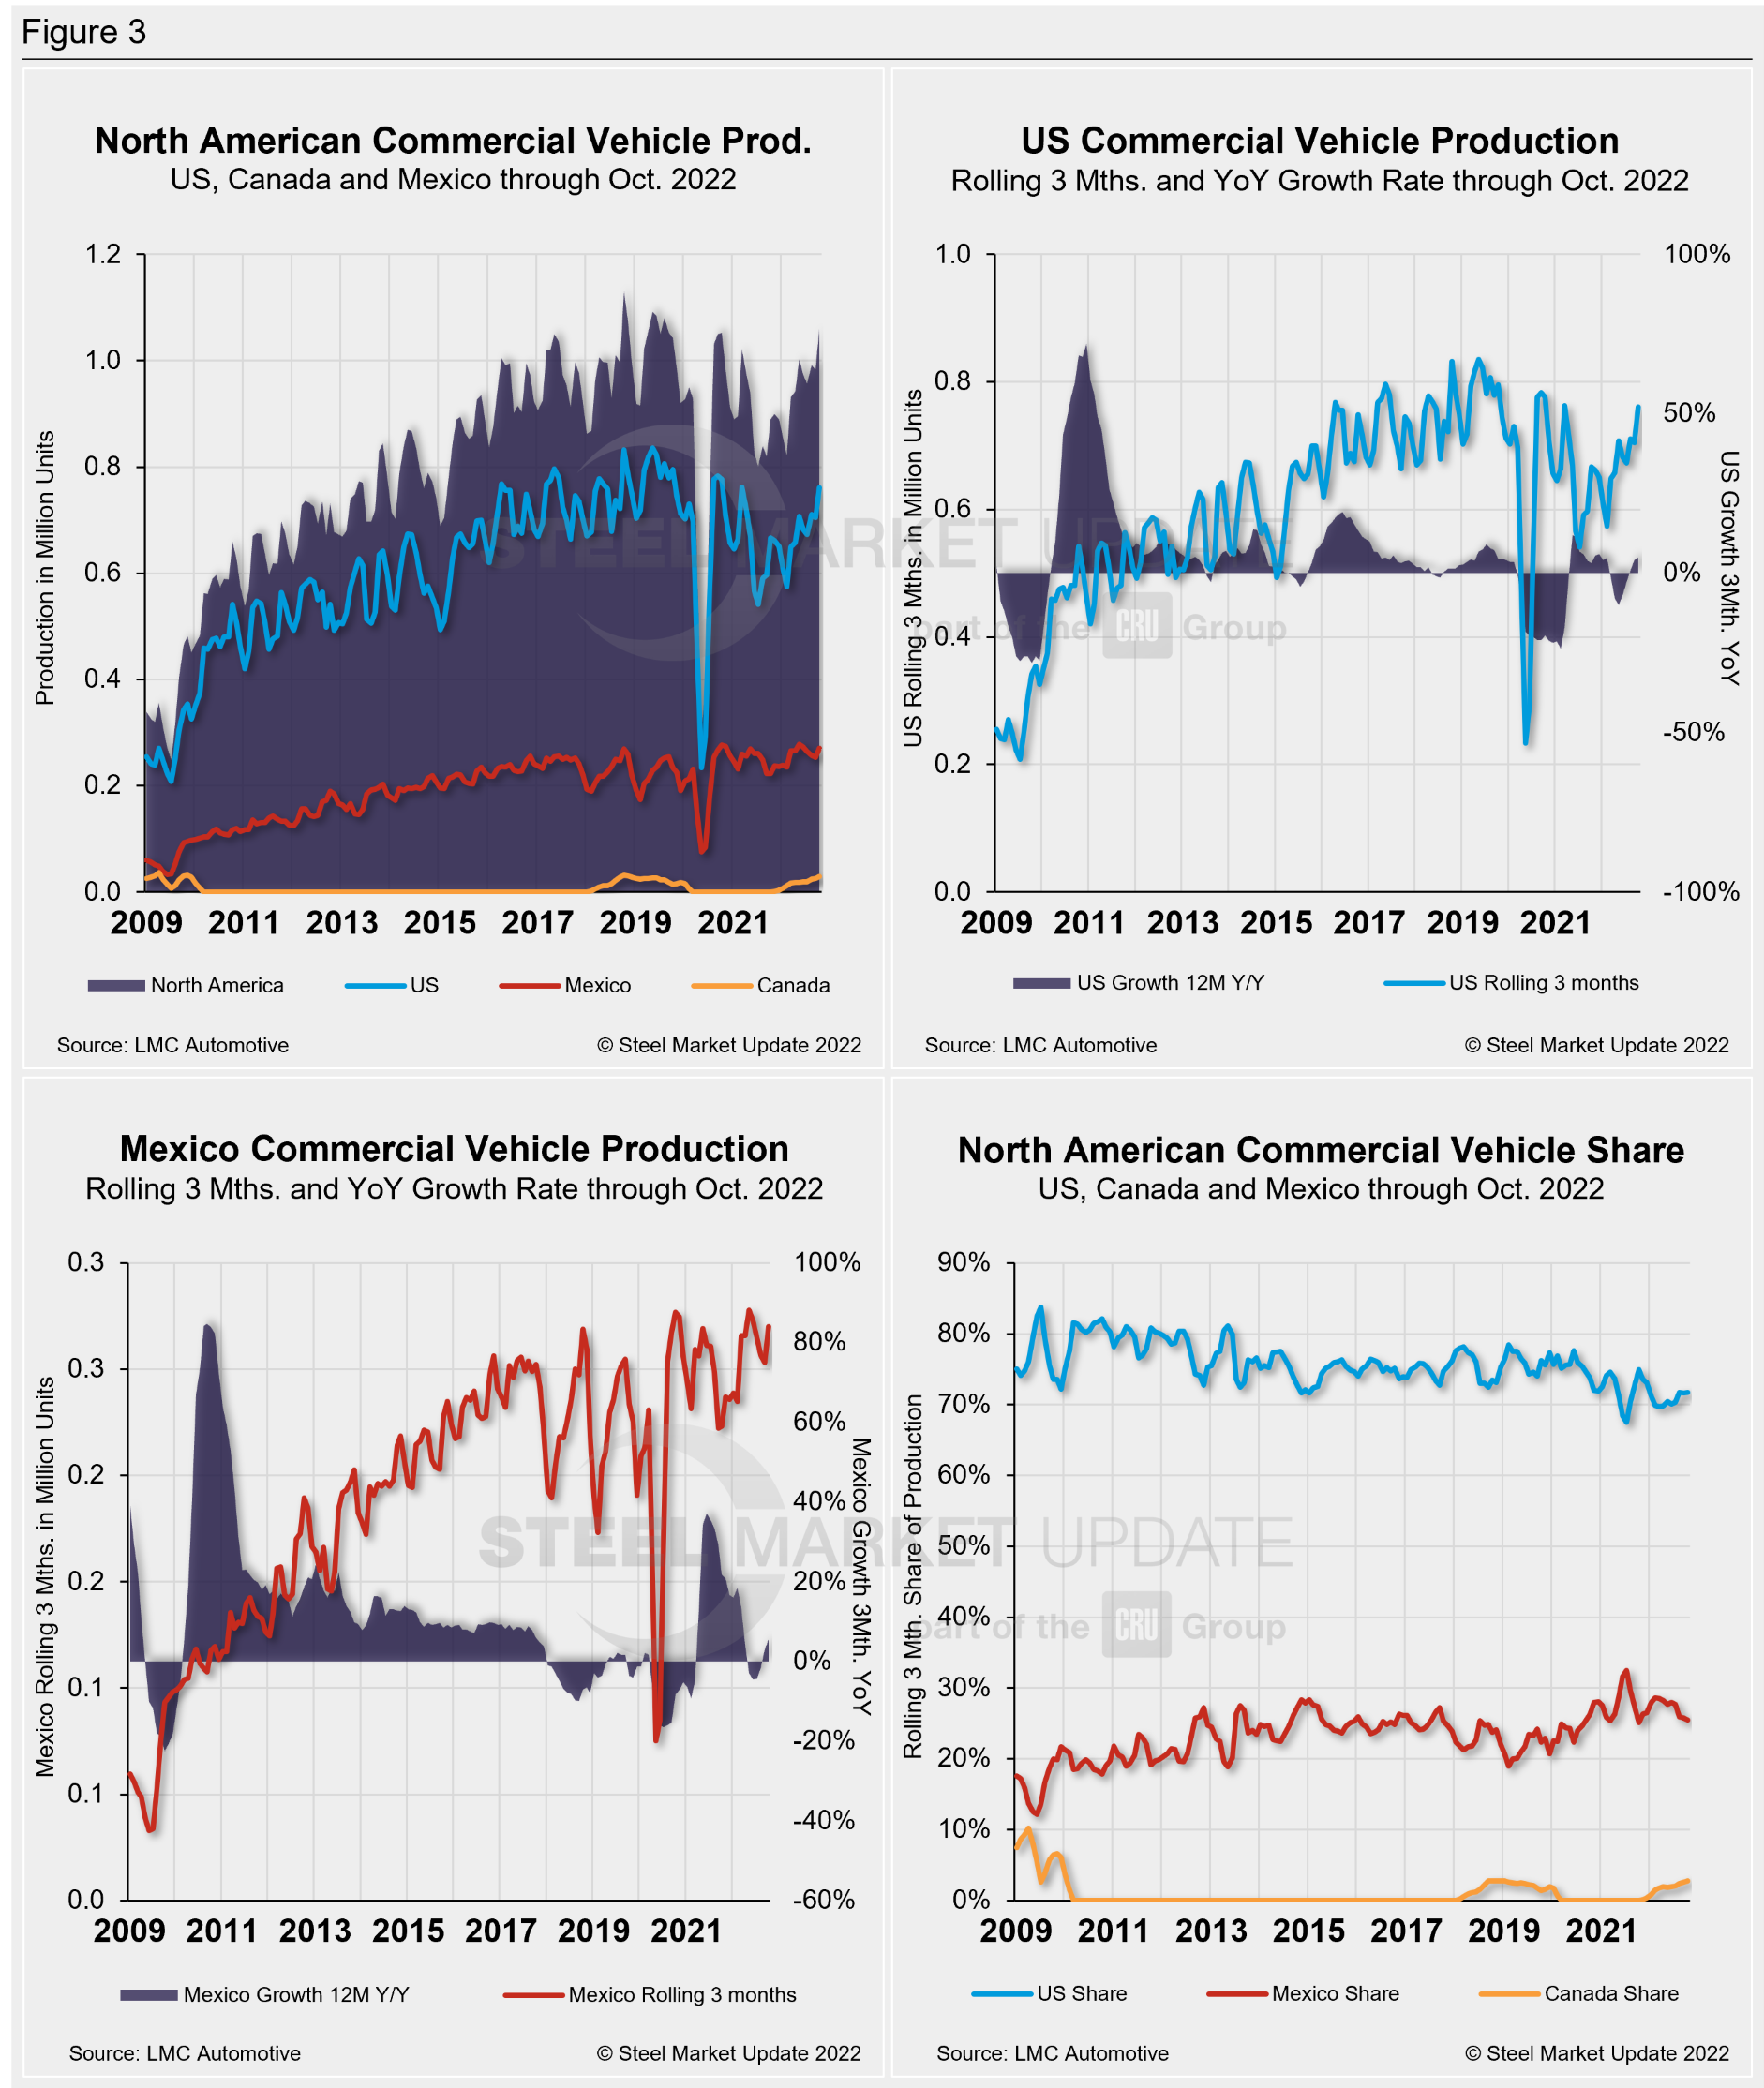
Commercial Vehicle Production
Total commercial vehicle production for North America and the total for each nation within the region are shown in the first chart in Figure 3 on a rolling three-month basis. Commercial vehicle production in the US and Mexico and their YoY growth rates, as well as the production share for each nation in North America, are also shown.
Of note for the Canadian automotive sector: October marked a year since Canada resumed commercial vehicle production after a 20-month production halt. Canada produced 9,229 light commercial vehicles in October, an 8% decline from September’s total of 10,030 units — still its third-best total since resuming production last November.
North American commercial vehicle production rose by 10% in October to 357,653 units from 325,001 units in September. The 32,652-unit MoM gain pushed the monthly total to North America’s second-highest production total YTD. The US saw the greatest unit gain, producing 22,232 units (+9.7%) last month, followed by Mexico, up 11,221 units (+13.2%). Canada posted an 8% decline MoM, with 801 fewer units MoM in October.
The gain put the commercial production growth rate at 19.1% for the region, a slight decline MoM, but a vast improvement from the -15.5% growth rate seen a year ago.
The US share was little changed, up 0.2 percentage points to 71.8% in October. Mexico saw its share increase from 25.5% to 26.8% last month, while Canada saw its share decrease from 2.6% to 1.4% in October.
Presently, Mexico exports just under 80% of its light vehicle production. The US and Canada are the highest volume destinations for Mexican exports.
Editor’s Note: This report is based on data from LMC Automotive for automotive assemblies in the US, Canada, and Mexico. The breakdown of assemblies is “Personal” (cars for personal use) and “Commercial” (light vehicles less than 6.0 metric tons gross vehicle weight rating; heavy trucks and buses are not included).
By David Schollaert, David@SteelMarketUpdate.com


