Market Data

October 17, 2022
Service Center Shipments and Inventories Report for September
Written by Estelle Tran
Flat Rolled = 52.7 Shipping Days of Supply
Plate = 50.2 Shipping Days of Supply
Flat Rolled
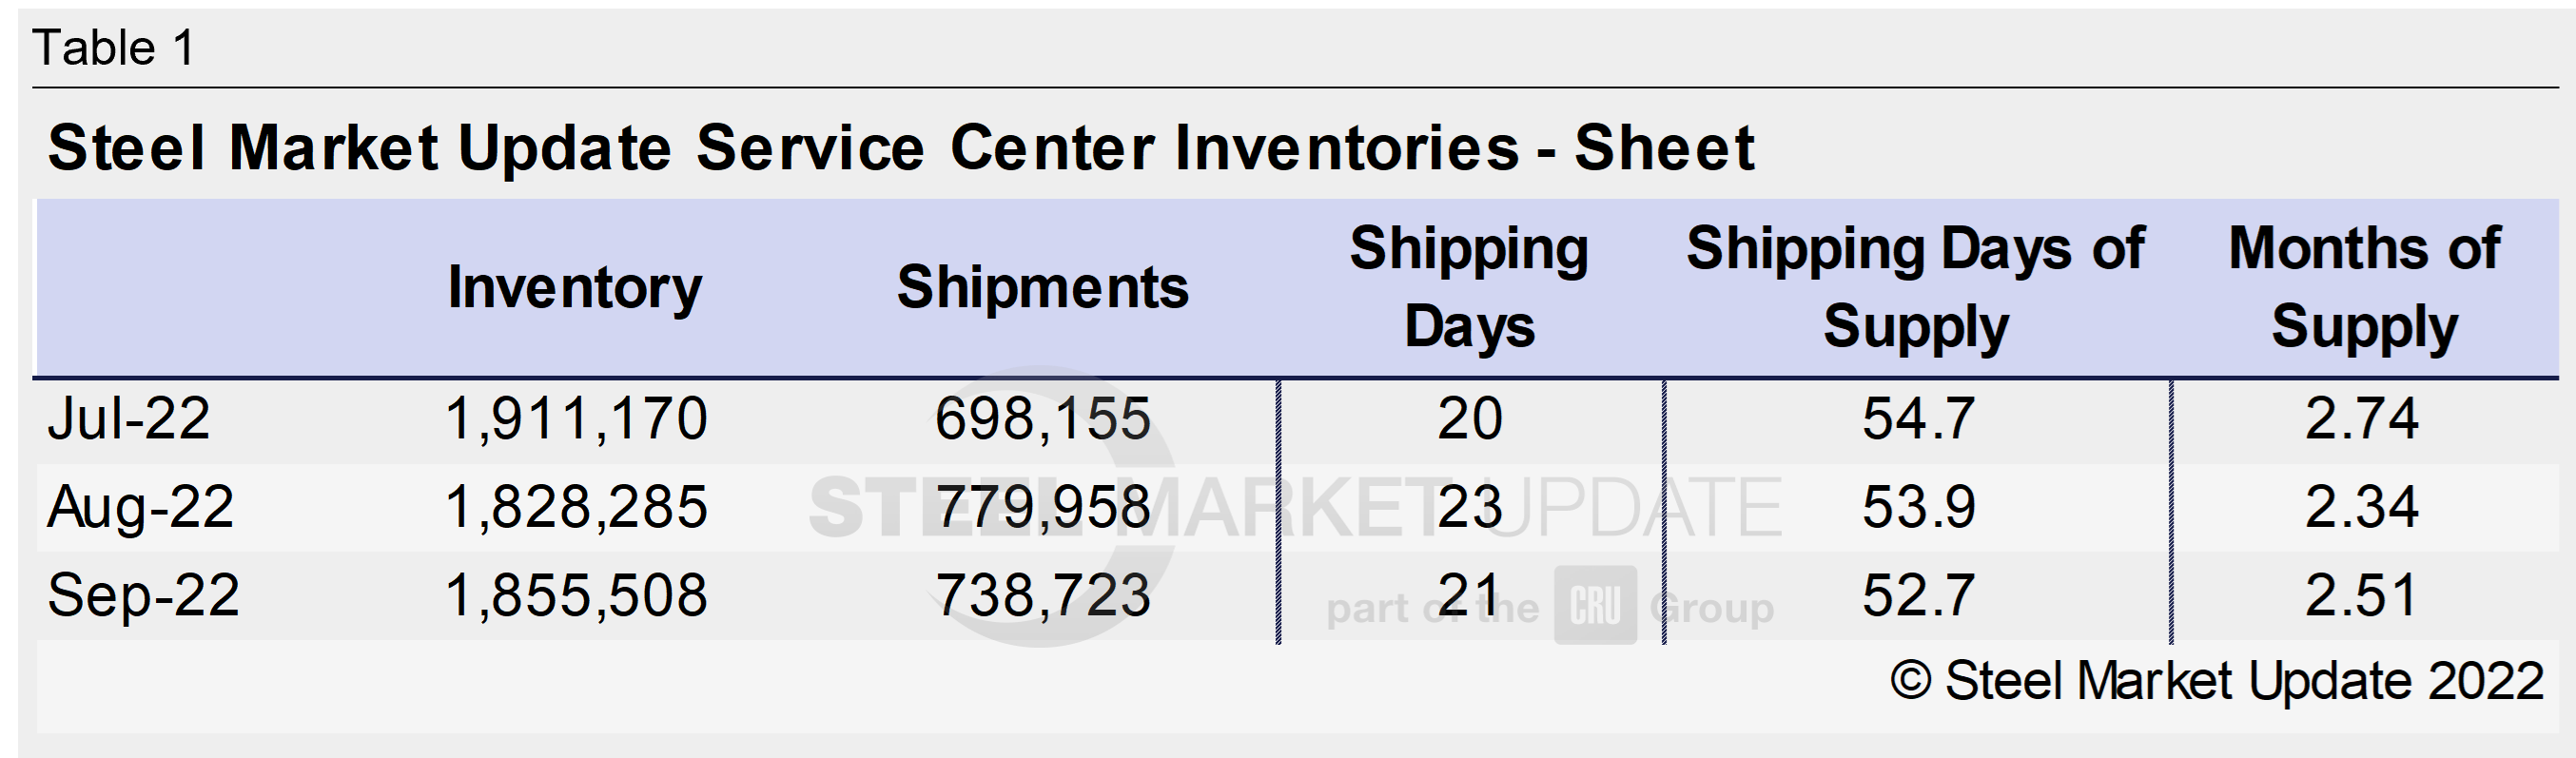
US service center flat rolled supply on hand edged down in September, reflecting a higher daily shipment rate. At the end of September, service centers carried 52.7 shipping days of supply of flat rolled, down from 53.9 shipping days of supply in August. In terms of months of supply, service centers carried 2.51 months of supply in September, up from 2.34 months in August.
September had 21 shipping days, compared to August’s 23. With the daily shipping rate in September and steady business expectations for October, the flat rolled inventory levels look balanced. Service centers have been reporting steady business levels, though customers remain hesitant to purchase with prices falling.
Multiple service center contacts have said that they have rightsized their inventories to account for softening demand. While inventories look balanced for now, the amount of inventory on order is concerning. Prices found a floor in August, which coincided with some opportunistic purchases. As a result, in September, the amount of inventory on order reached the highest level since March, when there was panic buying spurred by the war in Ukraine.
The amount of material on order spiked in August as some service centers placed large orders at the bottom of the market, and the amount of sheet on order increased again in September.
With questions surrounding fourth-quarter demand, buyers have limited their sourcing only to filling gaps and specific projects. Moving into the slowest quarter of the year, inventories are expected to swing back into surplus.

Plate
US service center plate inventories fell significantly in September with higher shipments. At the end of September, service centers carried 50.2 shipping days of supply, down from 59.4 shipping days in August. Plate inventories represented 2.39 months of supply in September, down from 2.58 months in August.
Even with two fewer shipping days, shipments increased month on month in September. Service centers reported strong demand in the machine and wind sectors, however, views on demand in the energy sector were mixed depending on the application.
Service center contacts said that they are only buying what they need and there is hesitation to place orders with expectations that prices will fall. Import offers are expected to continue to pressure prices. The amount of plate committed to contracts has fallen to 25.2% in September from 34.7% in August.
The amount of plate on order at the end of September decreased.

By Estelle Tran, Estelle.Tran@CRUGroup.com