Market Data

August 9, 2022
Employment by Industry: Service, Construction Add Jobs in July
Written by David Schollaert
The US labor market added 582,000 jobs in July, a surprising boost in hiring and more than doubling what forecasters had projected. The economy has now regained all jobs lost during the pandemic. The result pushed the unemployment rate down to 3.5%, matching the pre-pandemic low, the Bureau of Labor Statistics reported.
The July jobless rate matched the half-century low last seen in February 2020 and marked the 19th consecutive month of job growth—the highest monthly gain since the economy added 714,000 jobs back in February.
The employment growth was widespread across industries, with healthcare and leisure and hospitality seeing some of the biggest gains.
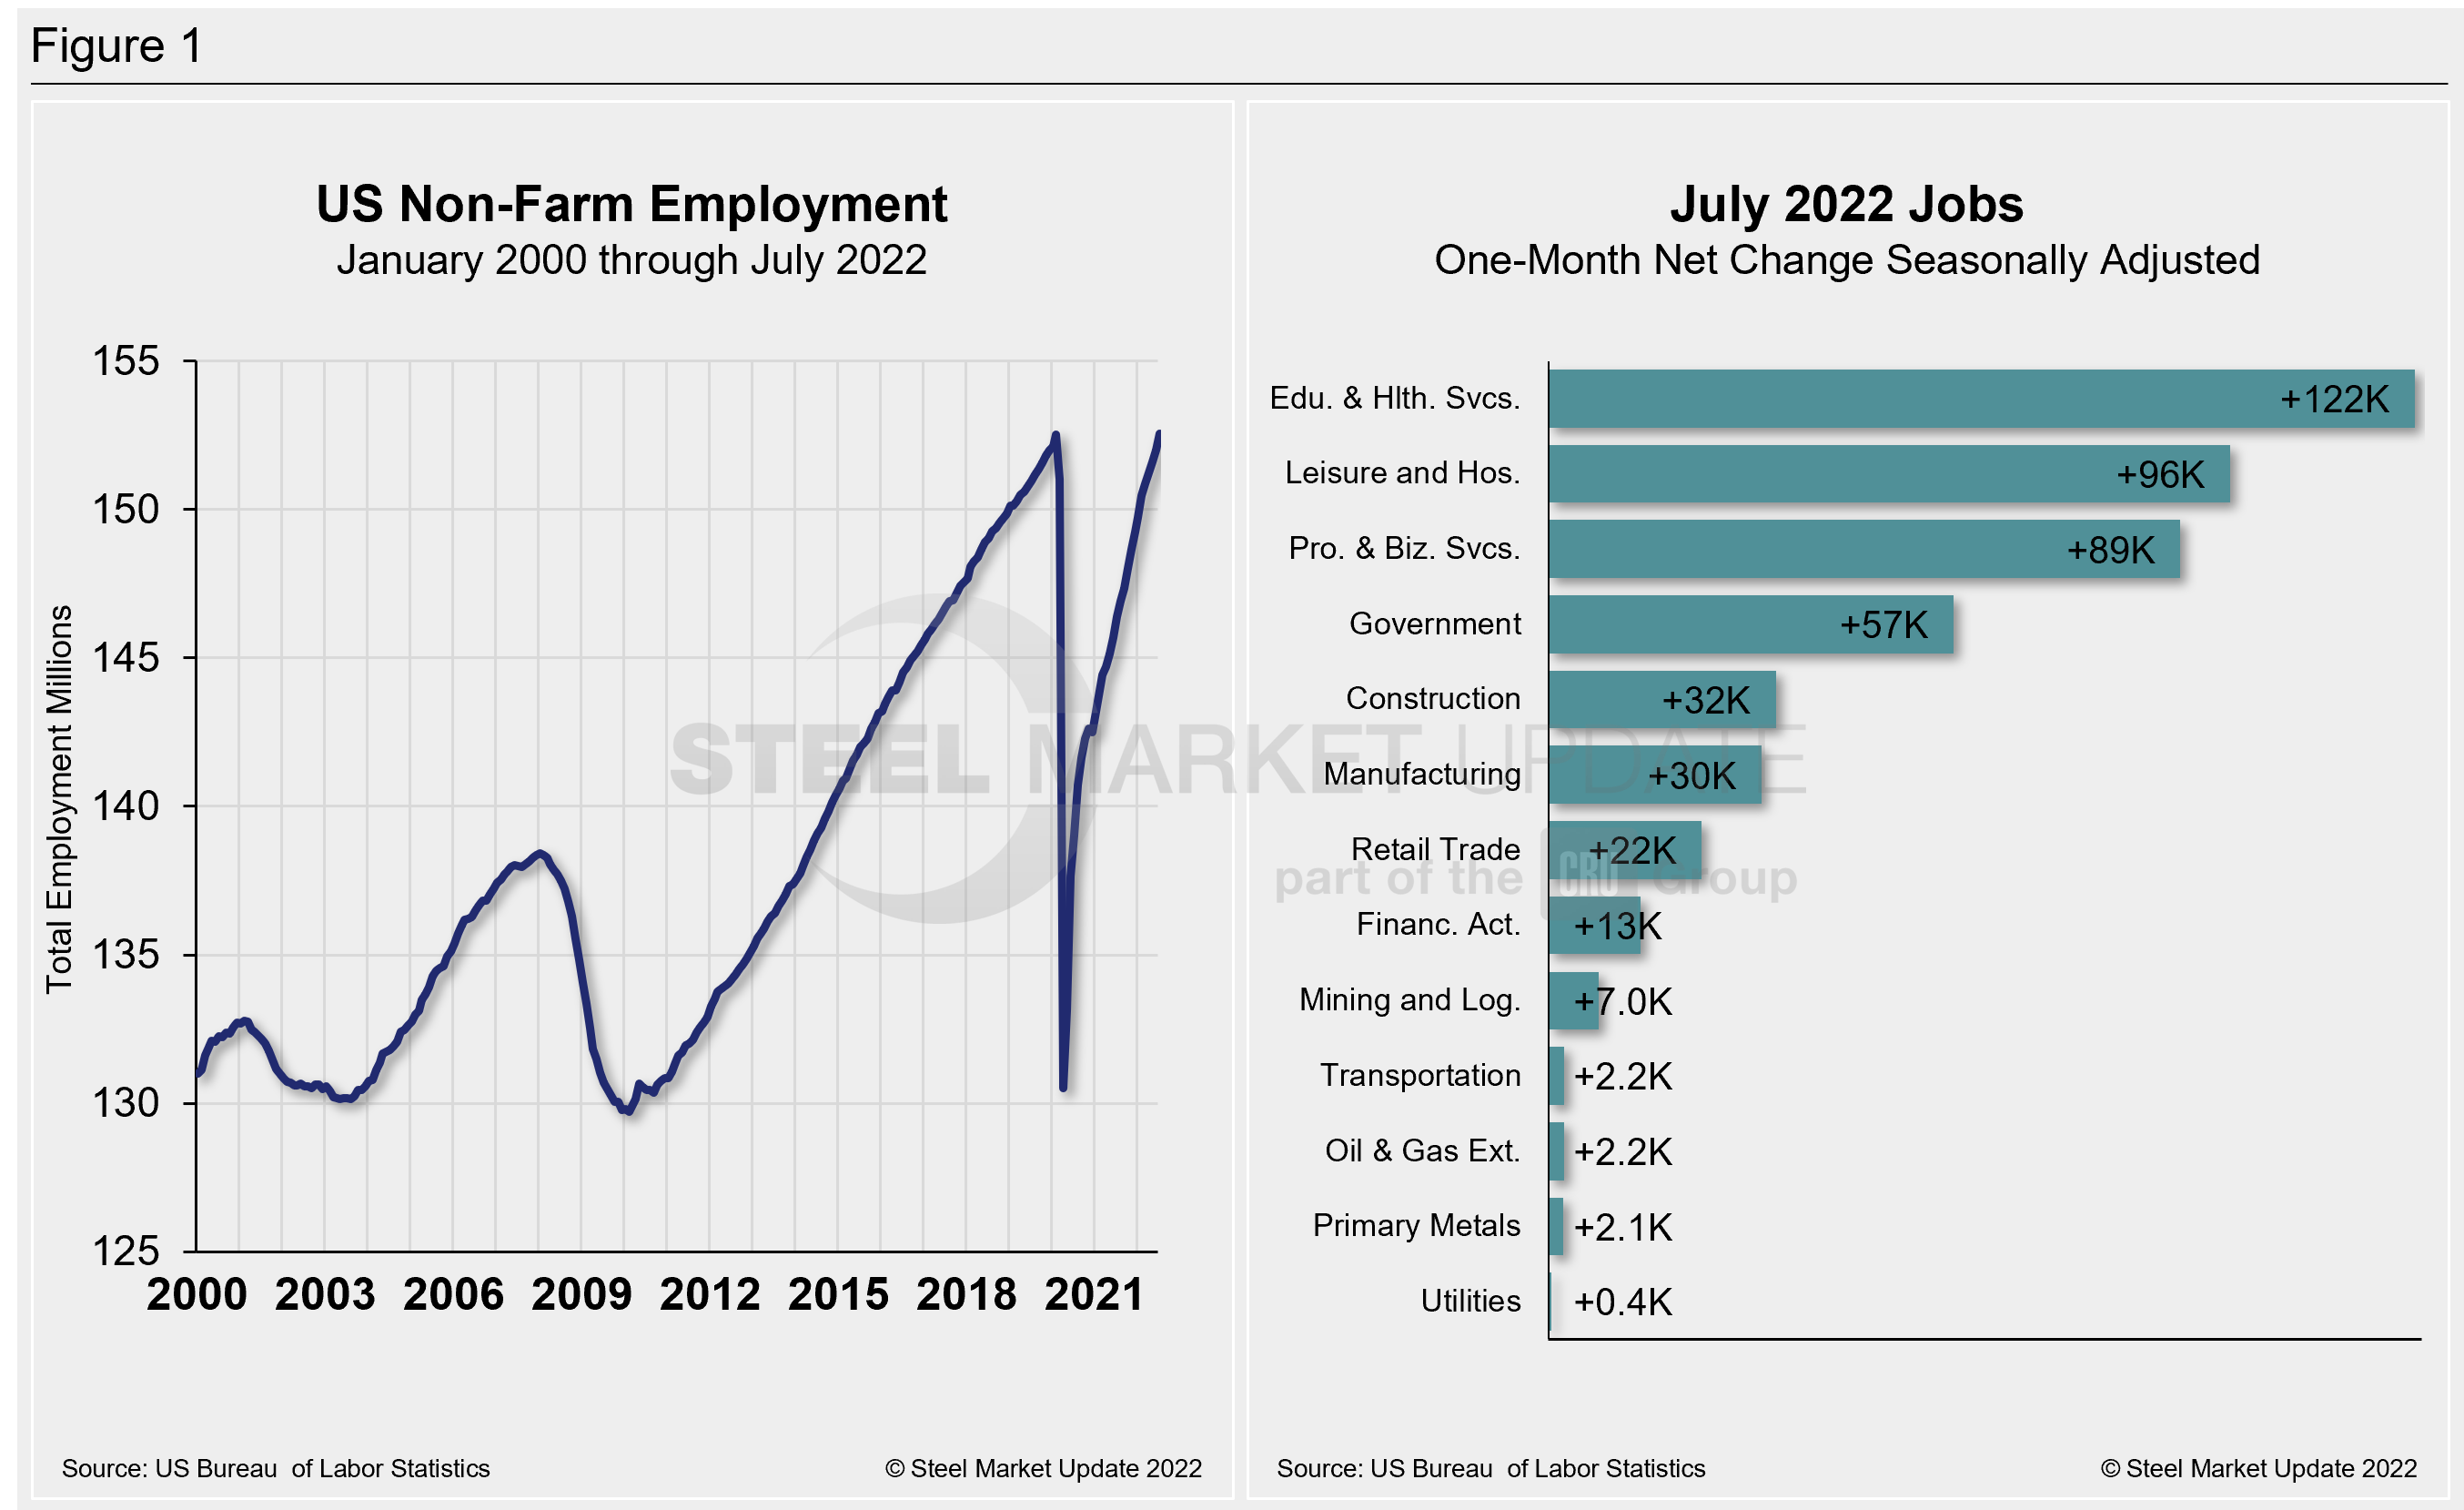
In July, leisure and hospitality led the job gains with 96,000, however, employment in that key service sector is still more than 1 million jobs below its pre-pandemic level, the report said.
Professional and business services followed close behind, adding 89,000. Health care added 70,000 to payrolls, while construction saw a 32,000 boost despite rising mortgage rates and falling housing and permitting declines. Manufacturing added 30,00 jobs; transportation and warehousing, 21,000.
Participation in the labor force fell in July. High demand has done little to expand the ranks of available workers, with many still on the sidelines of the labor market. The overall labor force participation rate fell slightly to 62.1%, 1.3 percentage points below its level in February 2020.
Shown below in Figure 1 is the total number of people employed in the nonfarm economy as well as the month-on-month net change in total jobs in May.

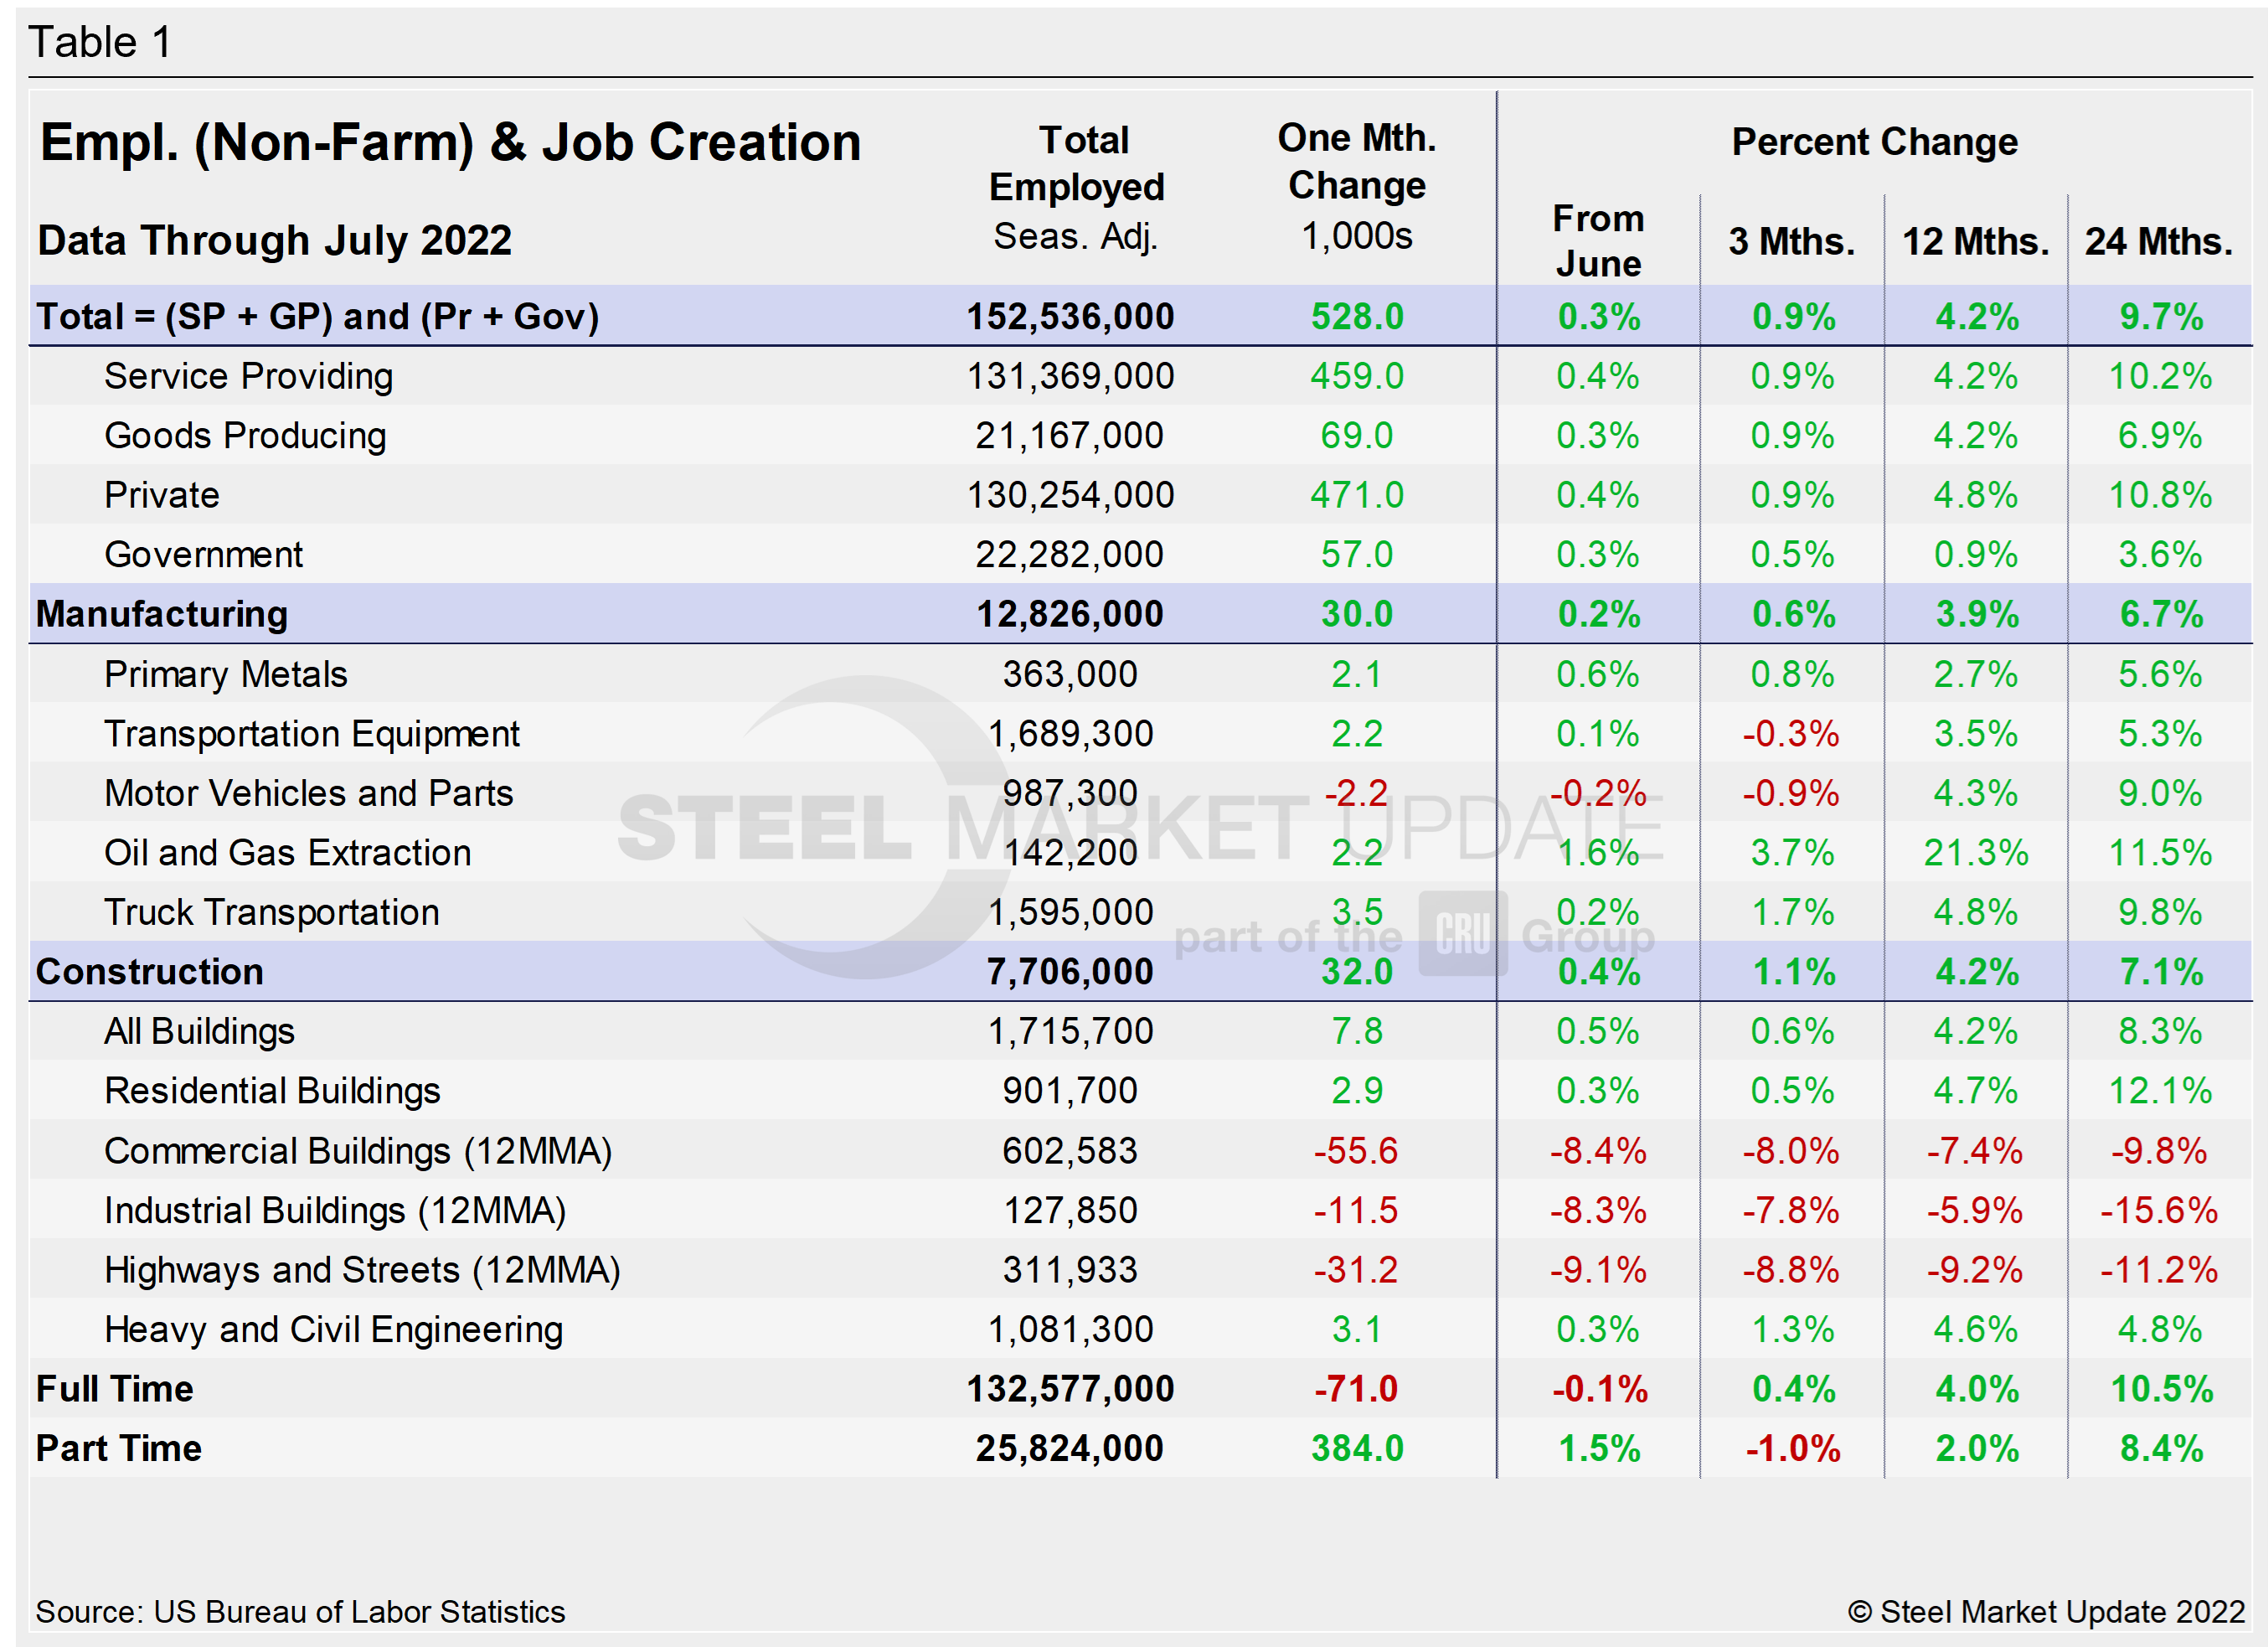
Designed on rolling time periods of one month, three months, one year, and two years, the table below breaks total employment into service industries and goods-producing industries, and then into private and government employees. Most of the goods-producing employees work in manufacturing and construction. Comparing service and goods-producing industries in July shows both increased marginally. The steady and repeated gains have pushed both above pre-pandemic levels, where they’ve been for the past four straight months. Note that the subcomponents of both manufacturing and construction shown in this table do not add up to the total because we have only included those with the most relevance to the steel industry.

Comparing July to June, manufacturing employment was just 0.2% higher, matching the growth seen the month prior. Construction saw a 0.4% increase as well MoM, outpacing the 0.2% gain in June. The construction sector is still being driven by the residential market despite strong headwinds. Though homebuilding has slowed, overall commercial and industrial buildings have taken a more notable hit. Heavy and civil engineering, a sector that suffered little during the pandemic, expanded as well and is now nearly a million jobs above where it stood before the last recession.
The three-month and 12-month comparisons show a decent recovery. The only broad industry to lose jobs was auto manufacturing, which shed about 2,200 jobs as companies have struggled to obtain the parts necessary to produce finished vehicles.
Manufacturing employment added 30,000 jobs in July, marginally above the 29,000 jobs added in June. Construction’s 32,000 payroll gain last month was a marked gain from the poor showing in June and nearly matched the 34,000 added in May.
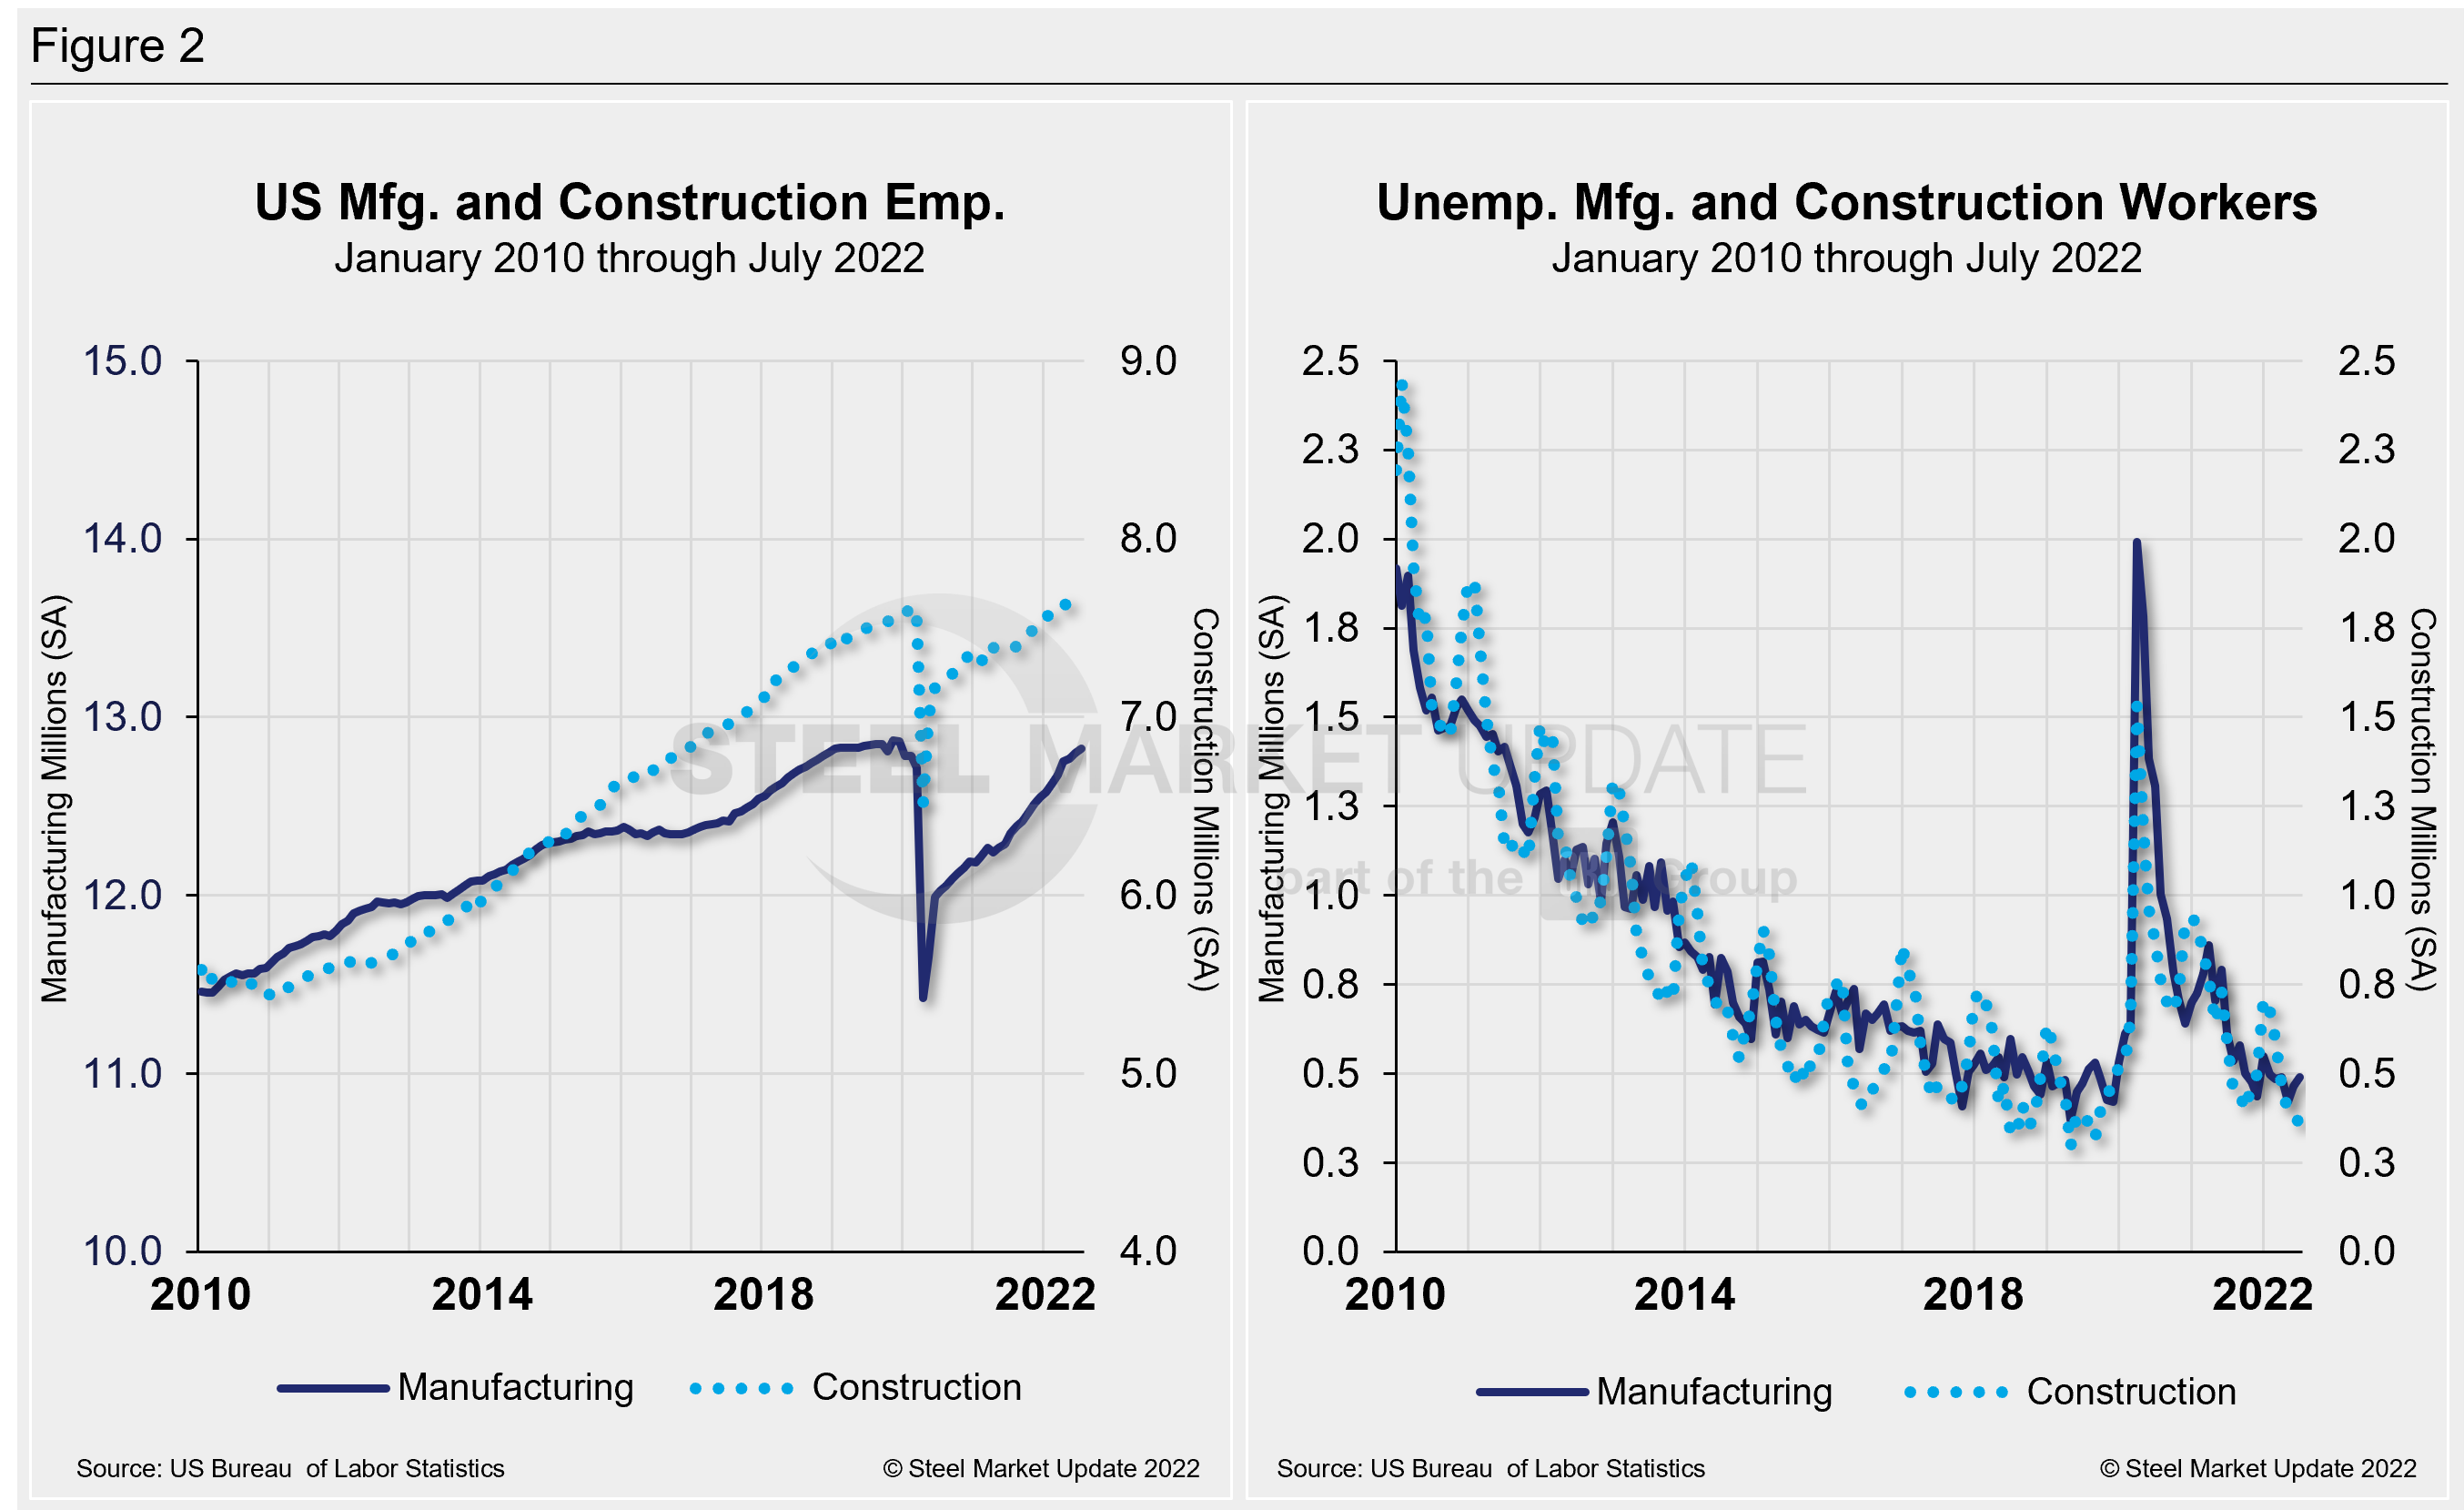
Construction and manufacturing unemployment diverged again in July. Construction unemployment fell 6.8% MoM from 385,000 in June to 359,000 in July. It’s the sixth consecutive monthly decline for the sector. Manufacturing unemployment was up 5.6% MoM following a 10.2% jump the month prior. Manufacturing unemployment rose from 465,000 in June to 491,000 in July. Both sectors have been heavily impacted by supply-chain disruptions and labor force constraints, but construction has been more resilient.
The history of employment and unemployment in manufacturing and construction since January 2010 is shown below side-by-side in Figure 2, seasonally adjusted.

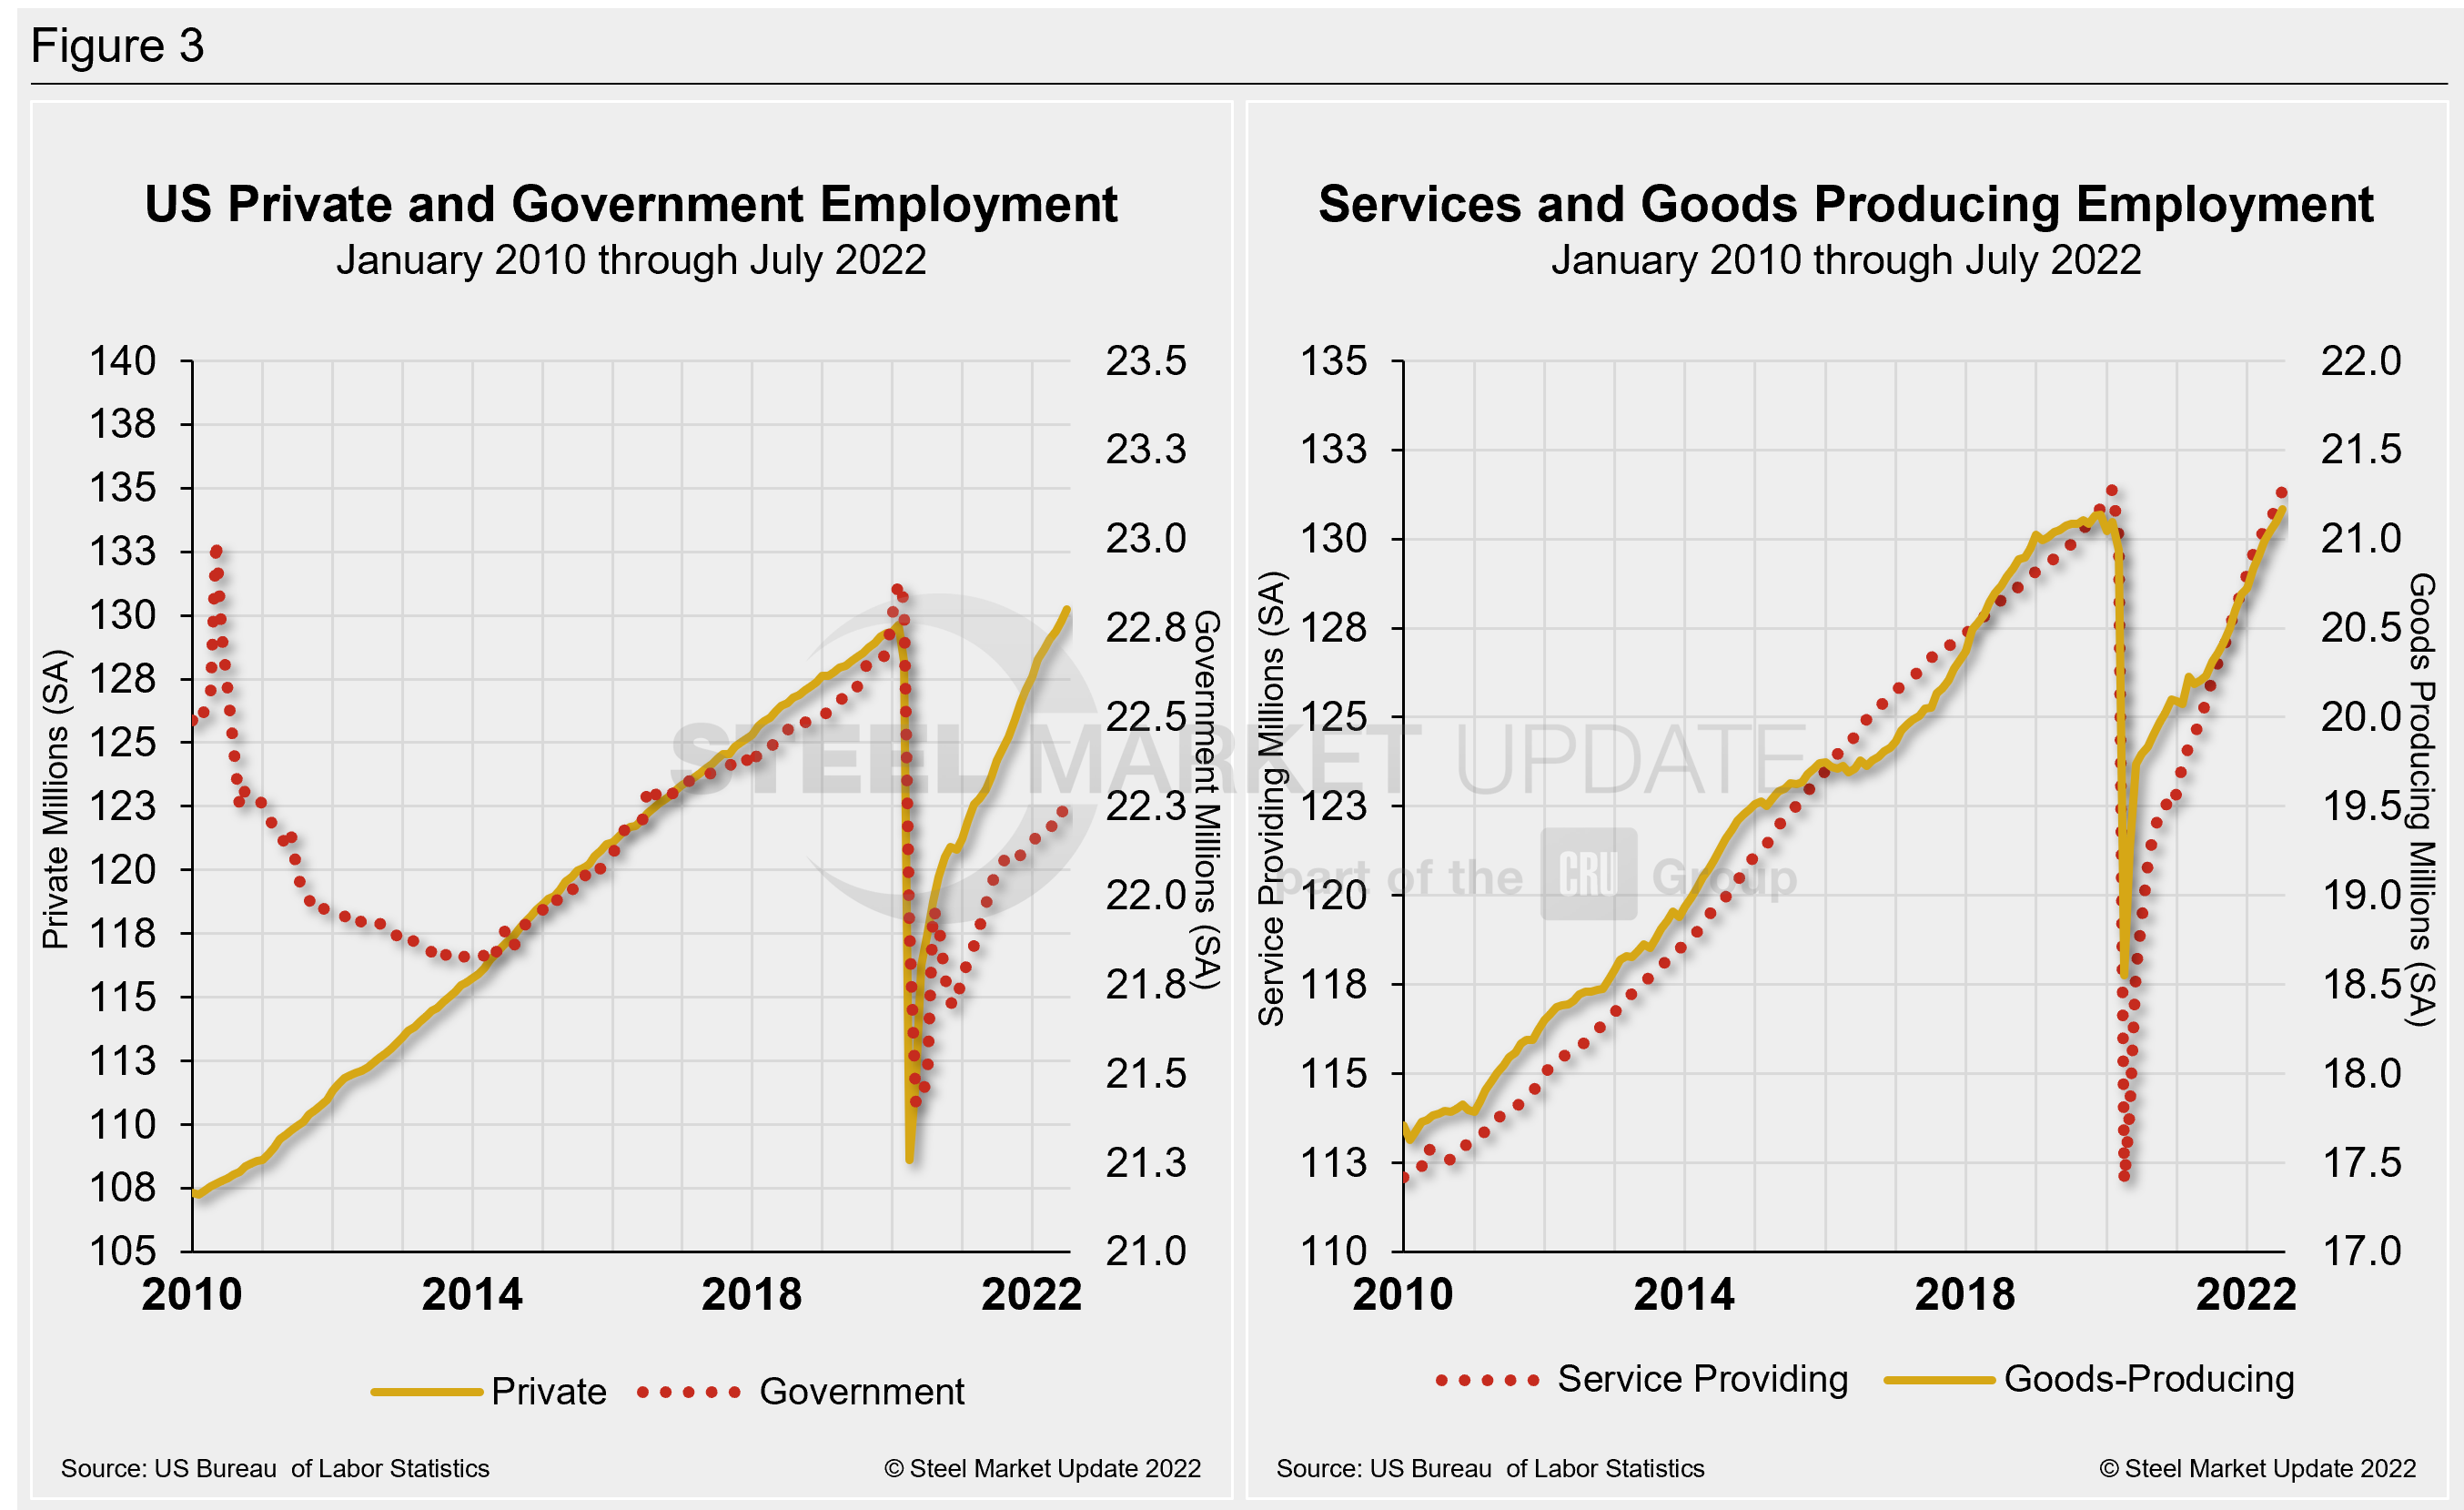
Figure 3 details employment comparisons between private and government jobs, as well as services and goods-producing jobs.

Explanation: On the first or second Friday of each month, the Bureau of Labor Statistics releases the employment data for the previous month. Data is available at www.bls.gov. The BLS employment database is a reality check for other economic data streams such as manufacturing and construction. It is easy to drill down into the BLS database to obtain employment data for many subsectors of the economy. The important point about all these data streams is not necessarily the nominal numbers, but the direction in which they are headed.
By David Schollaert, David@SteelMarketUpdate.com


