Analysis

May 6, 2022
CPIP Data: Construction Spending Slowed in March
Written by David Schollaert
US construction spending in March totaled $1.730 trillion at a seasonally adjusted annual rate, just 0.1% above February’s total. Investment in construction cooled because increased spending on residential projects was offset by a decline in nonresidential investment, the Commerce Department reported.
Construction spending in March missed expectations, down from a 0.5% gain in February and behind earlier forecasts of roughly 1.0% growth. While month-over-month (MoM) growth disappointed in March, year-over-year (YoY) gains remain impressive. Construction spending in March was up 11.7% YoY – owing more to residential (+18.6%) than to nonresidential (+5.8%).
And despite slower gains at the start of 2022, this year has seen a total of $376.337 billion spent, or 12% growth compared to the first three months of last year. The dynamic – weaker MoM growth but stronger YoY growth – underscores the significant recovery the sector has made since the shock of the pandemic while also pointing to current headwinds such as inflation, supply chain snarls, surging material costs, and labor shortages.
The Census Bureau’s report on construction shows spending in the private sector increased 0.2% from February to March at an annual rate of $1.380 trillion. The residential share of that spending rose 1.0% MoM compared to a gain of 0.7% in February. The annual rate in March was $88.045 billion, up 18.4% compared to March 2021. The nonresidential component fell 1.2% from the prior month but is still 8.5% higher than the same year-ago period.
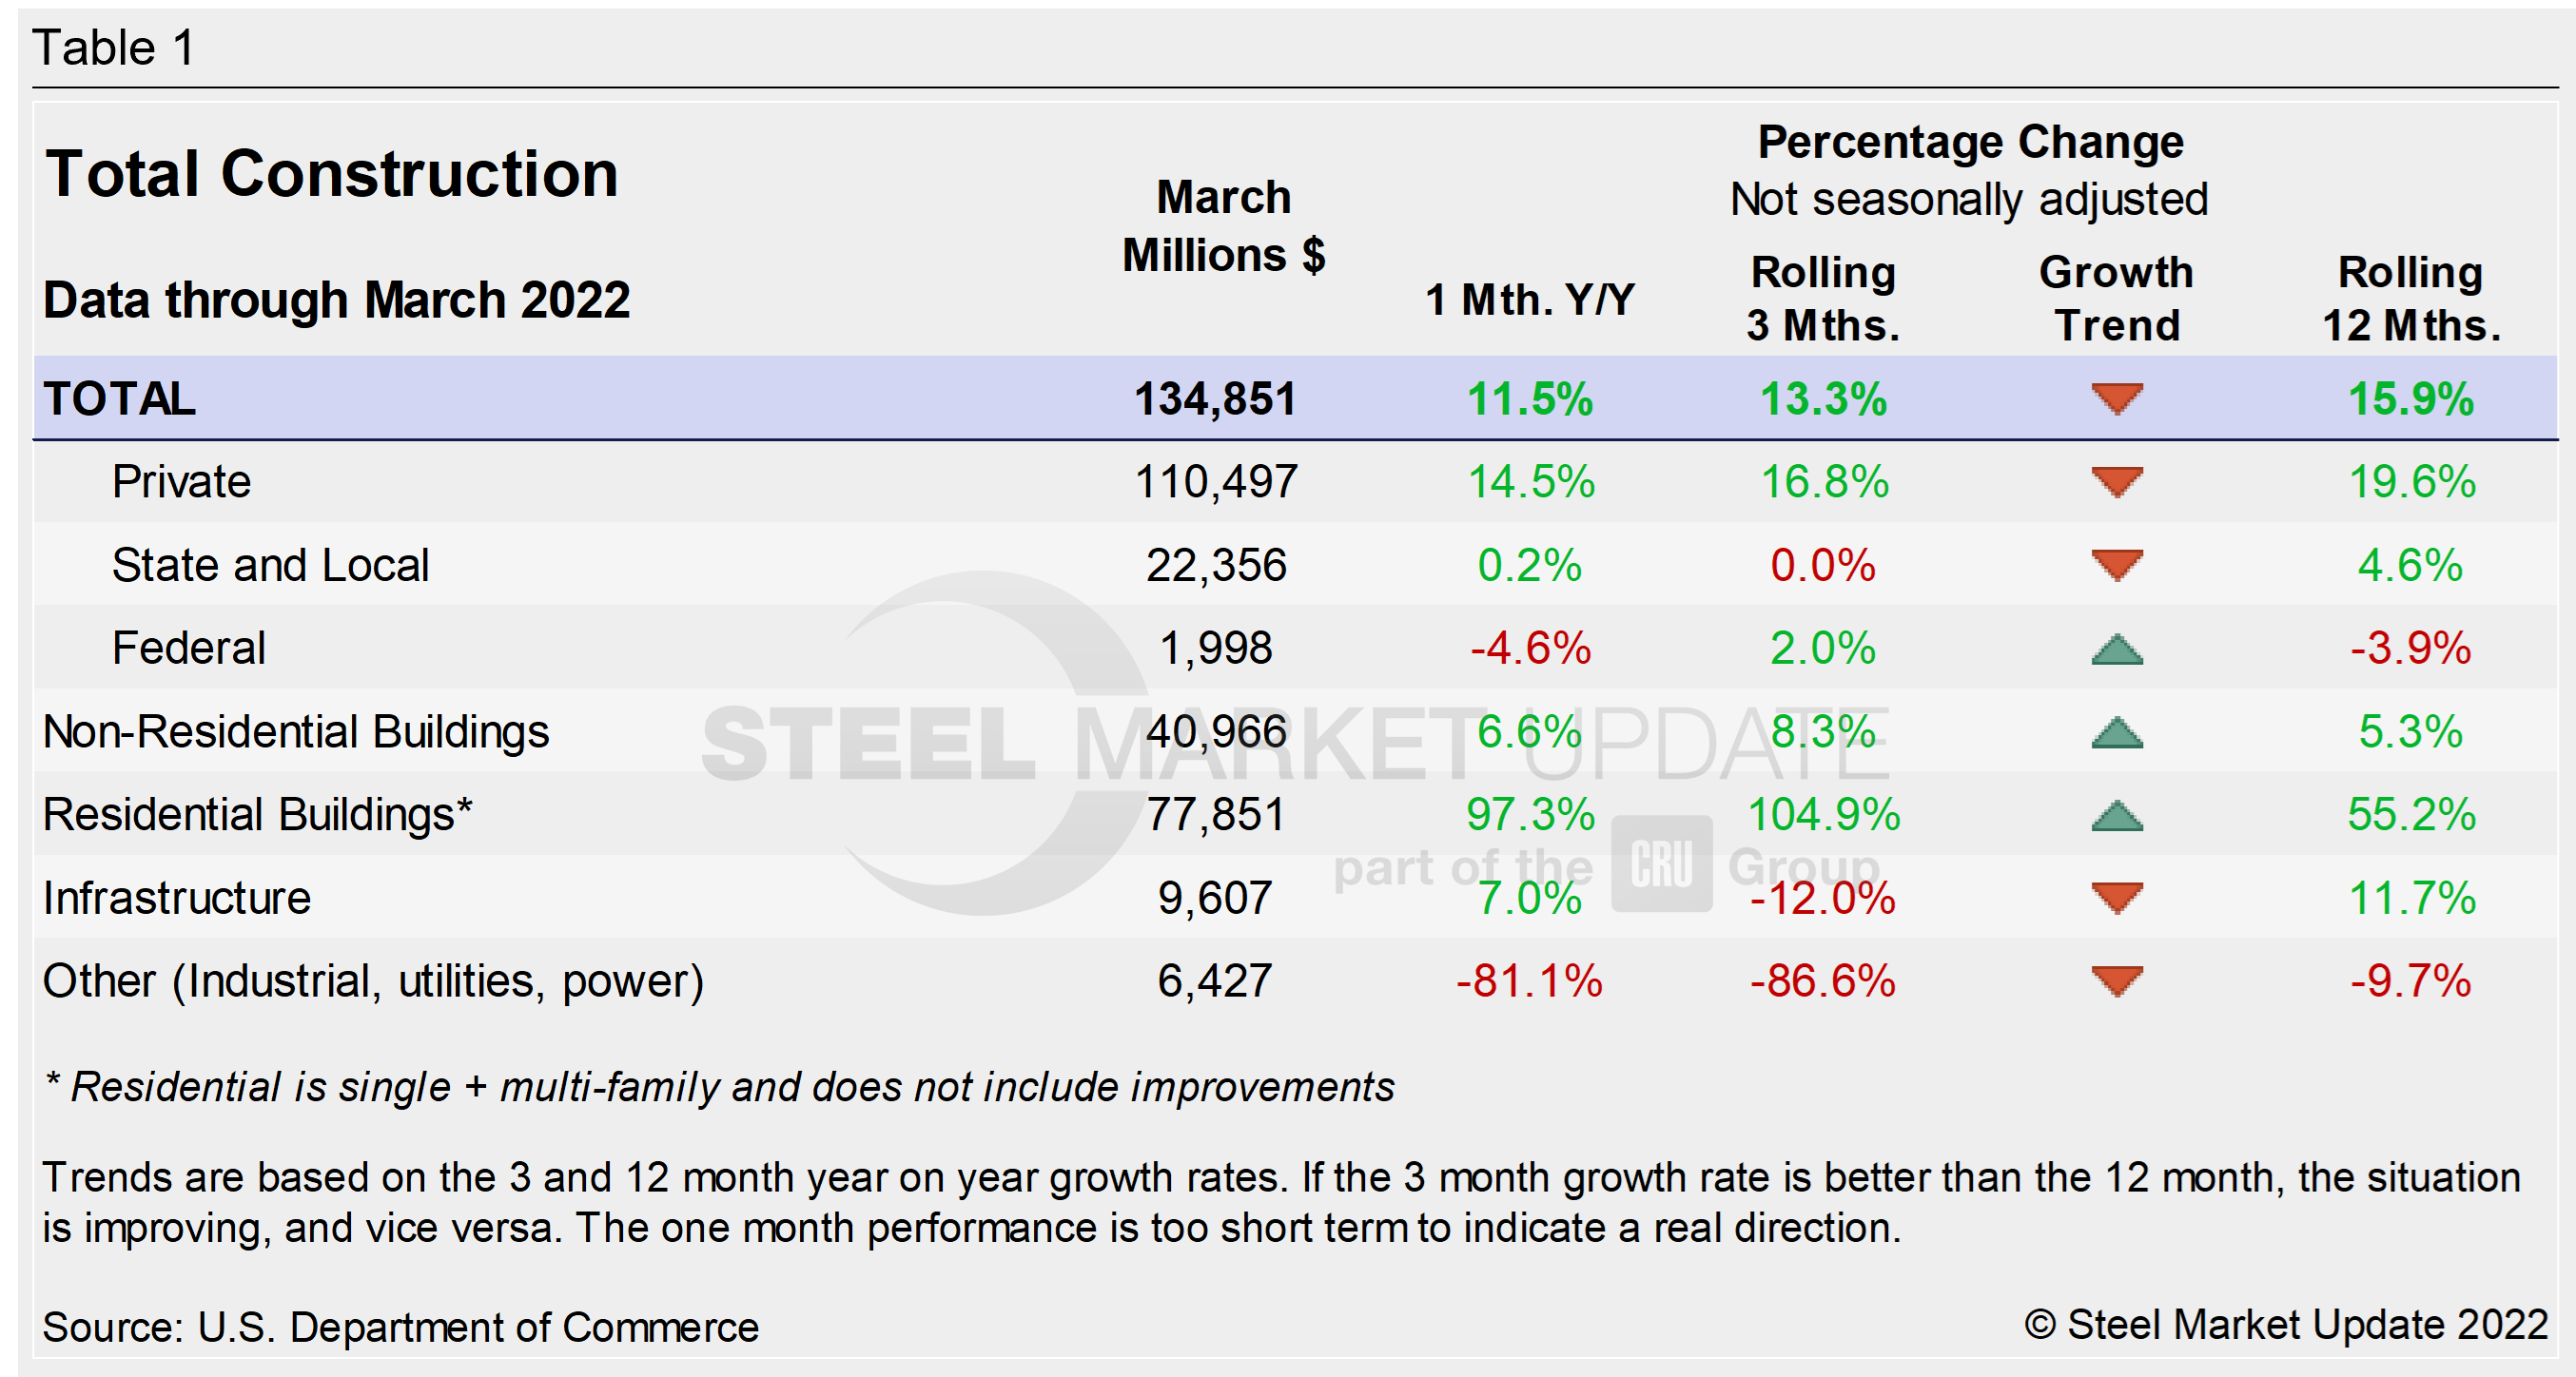
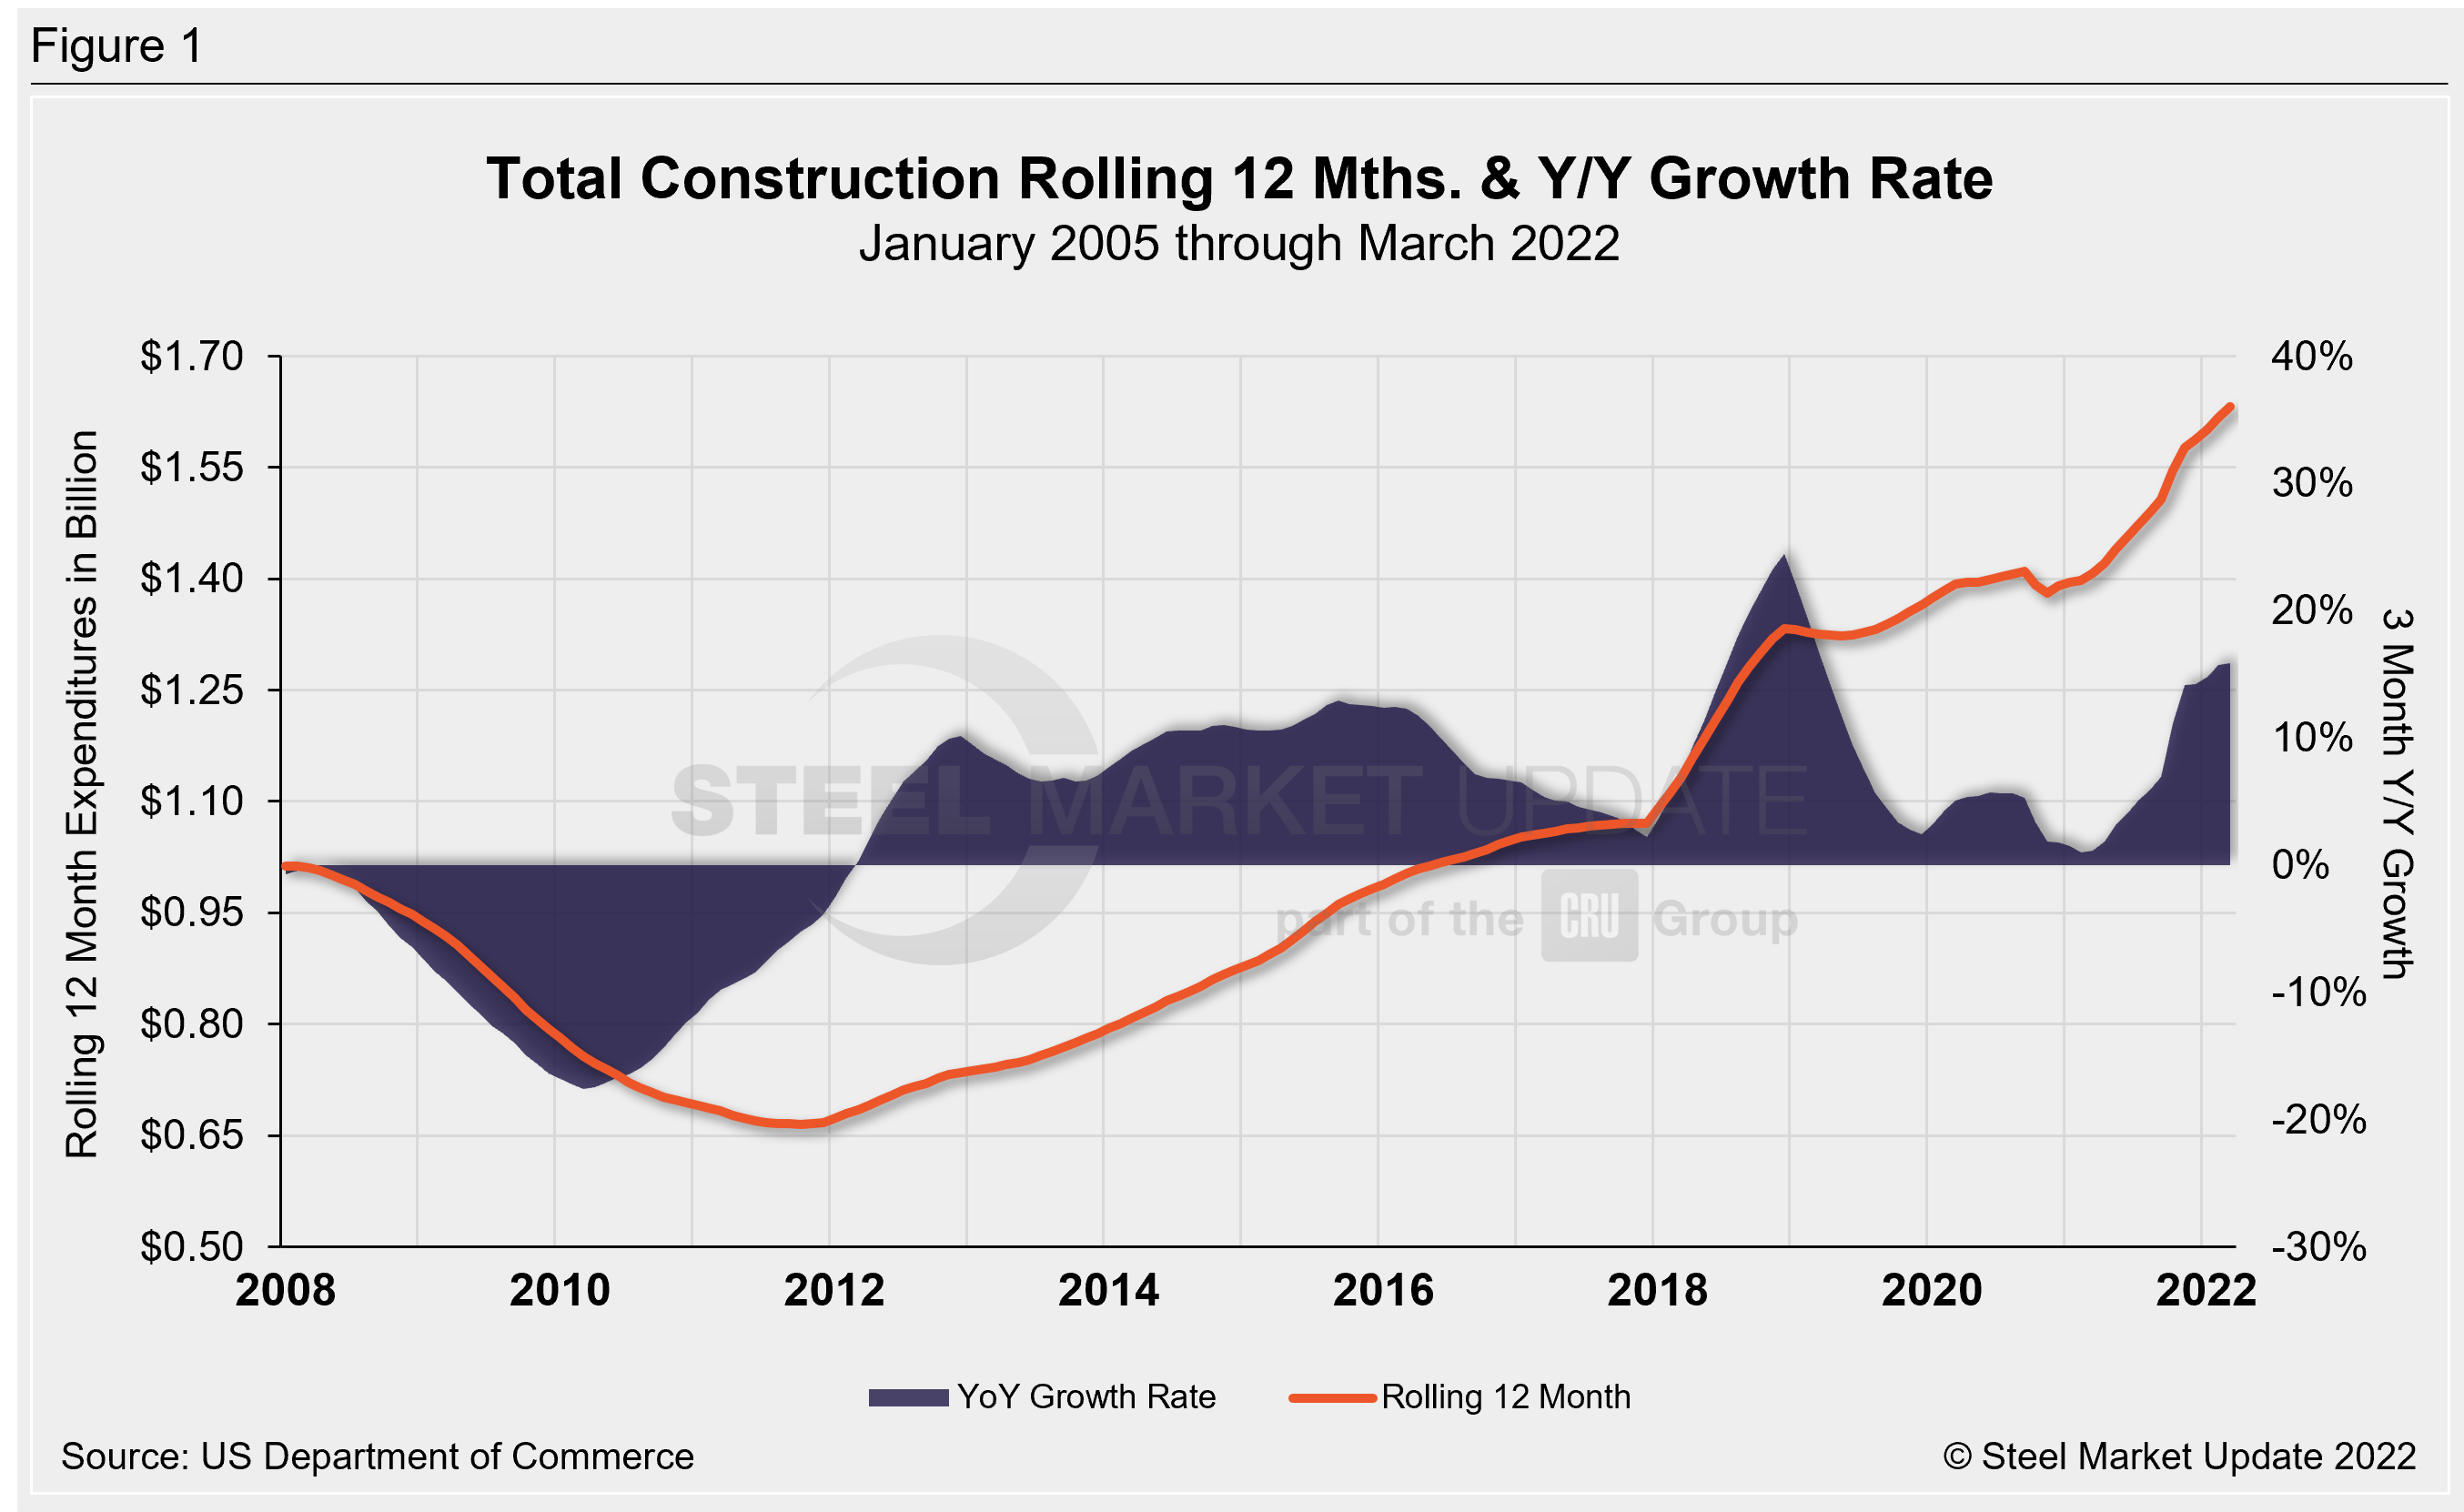
Total construction expenditures and their major categories are shown in Table 1 below. Figure 1 shows total construction and infrastructure expenditures. It details the year-on-year growth rate versus a rolling 12-month average.
Private Construction
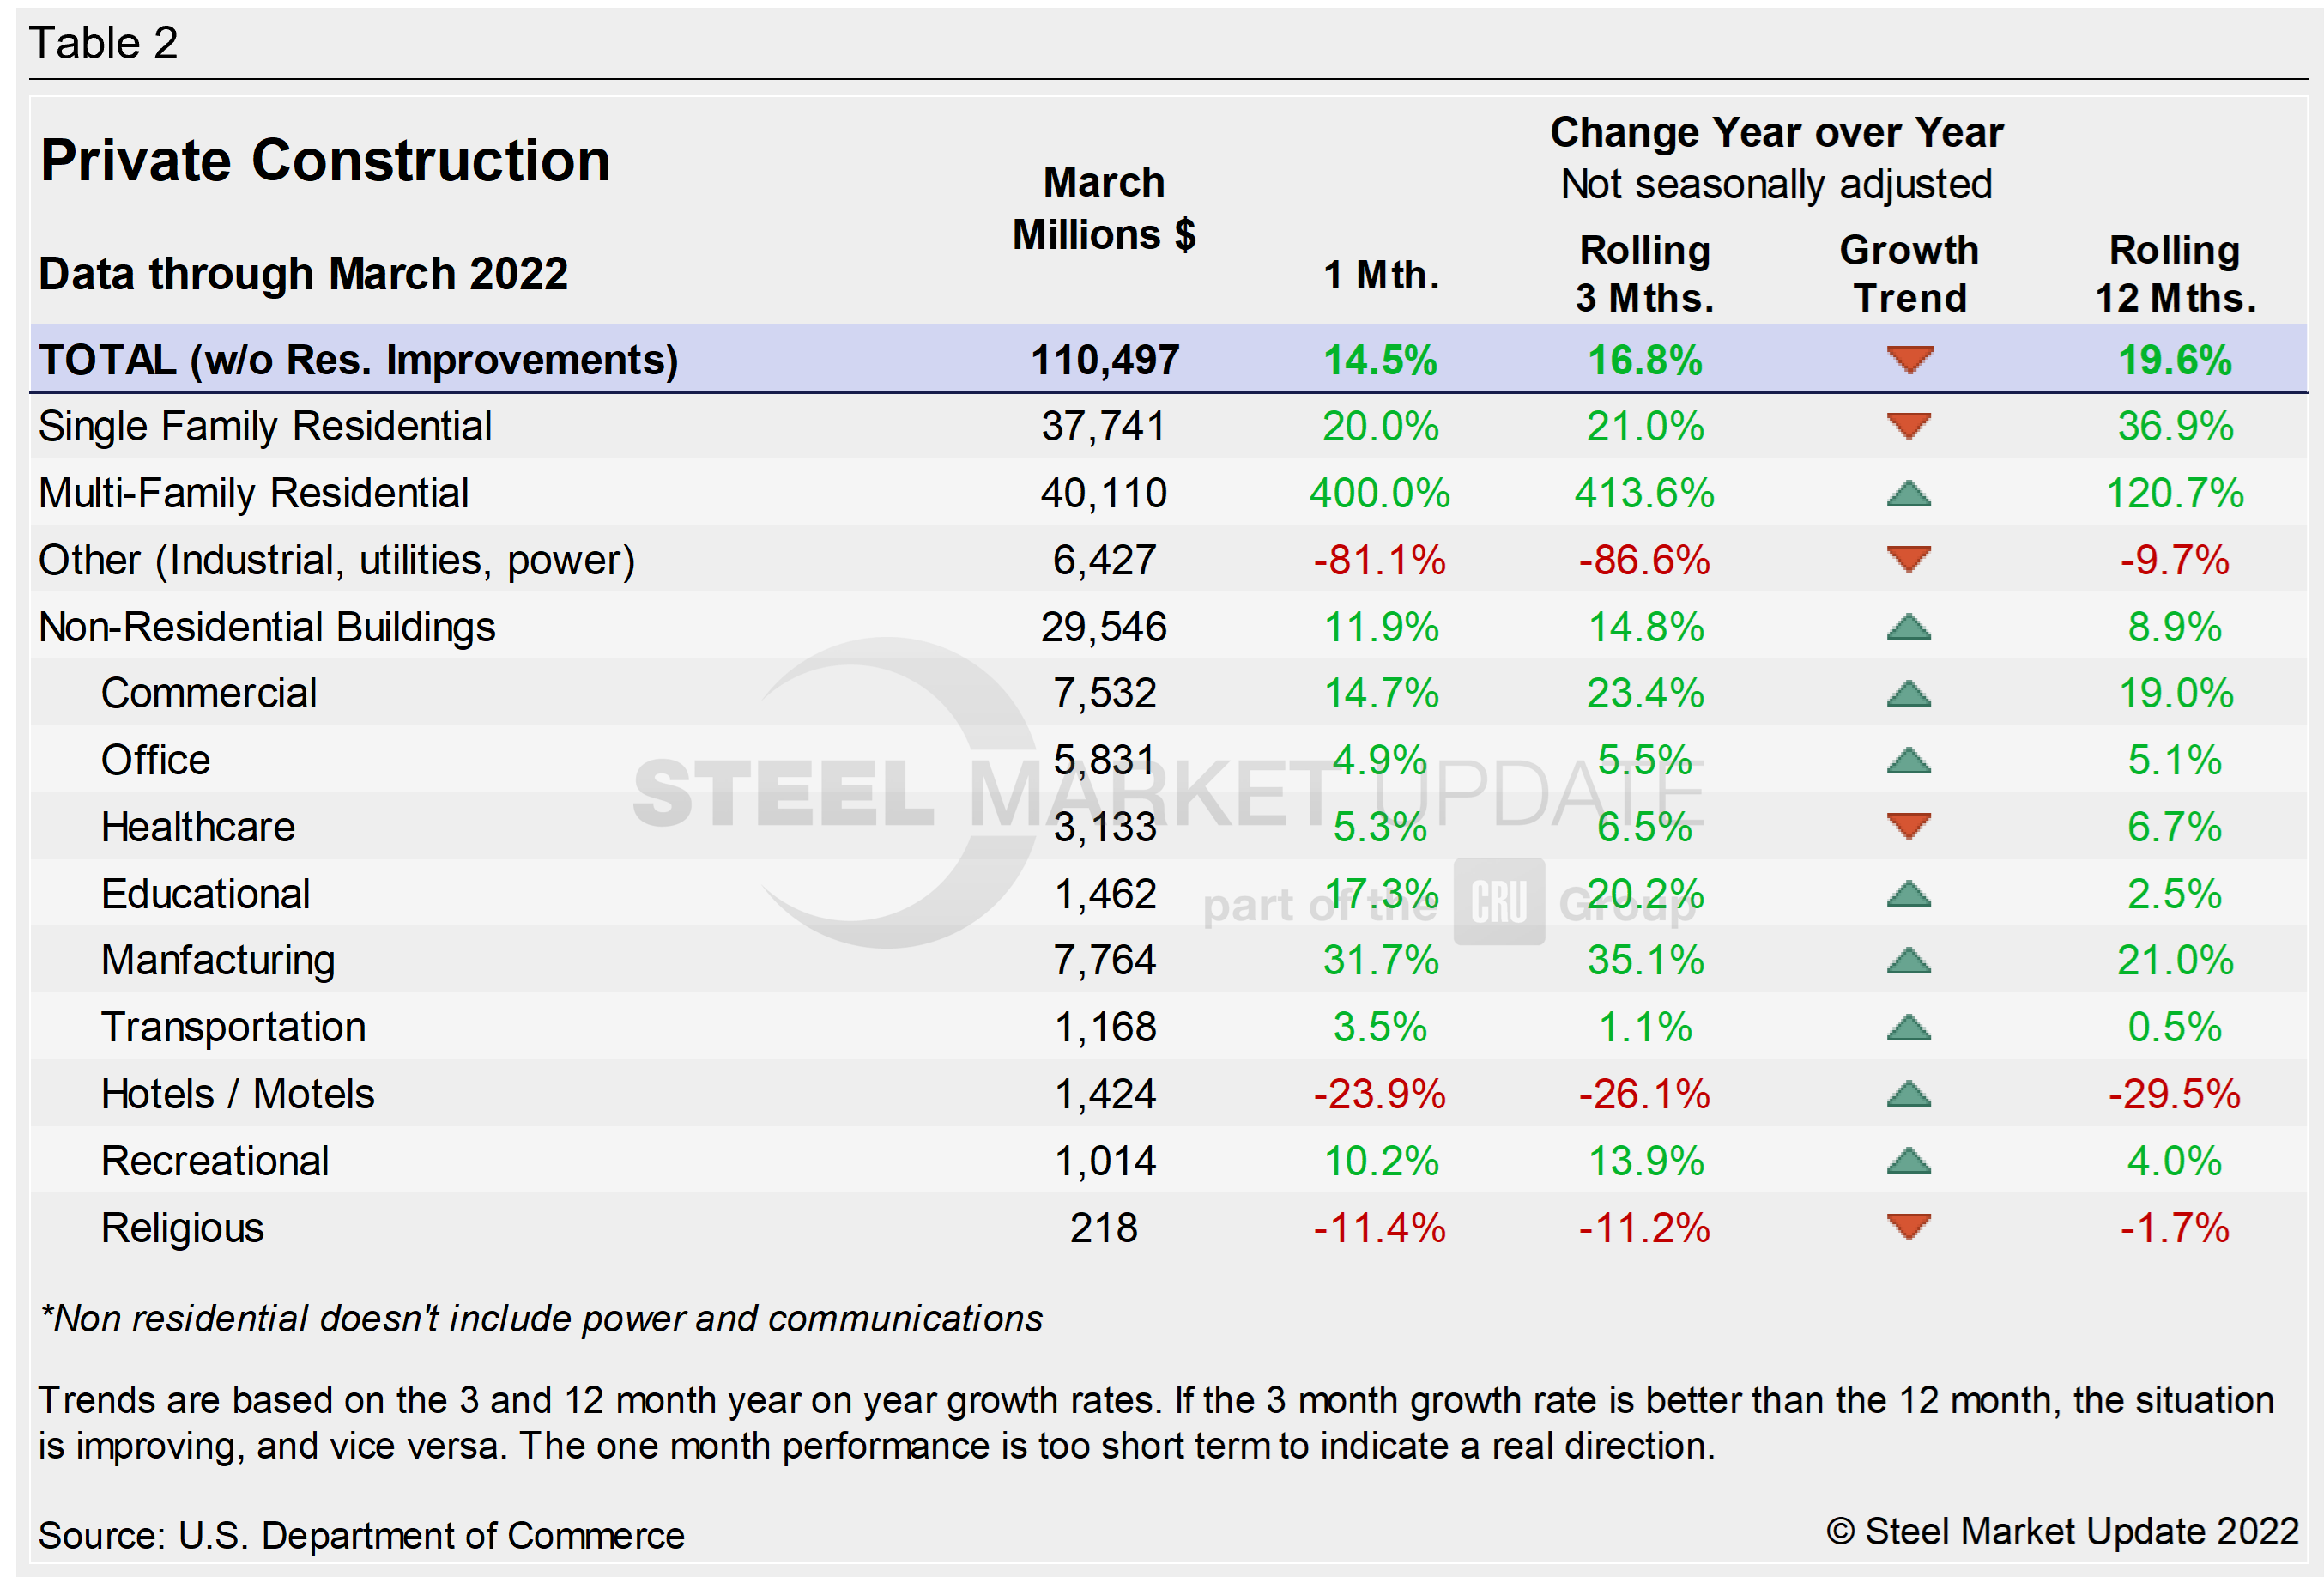
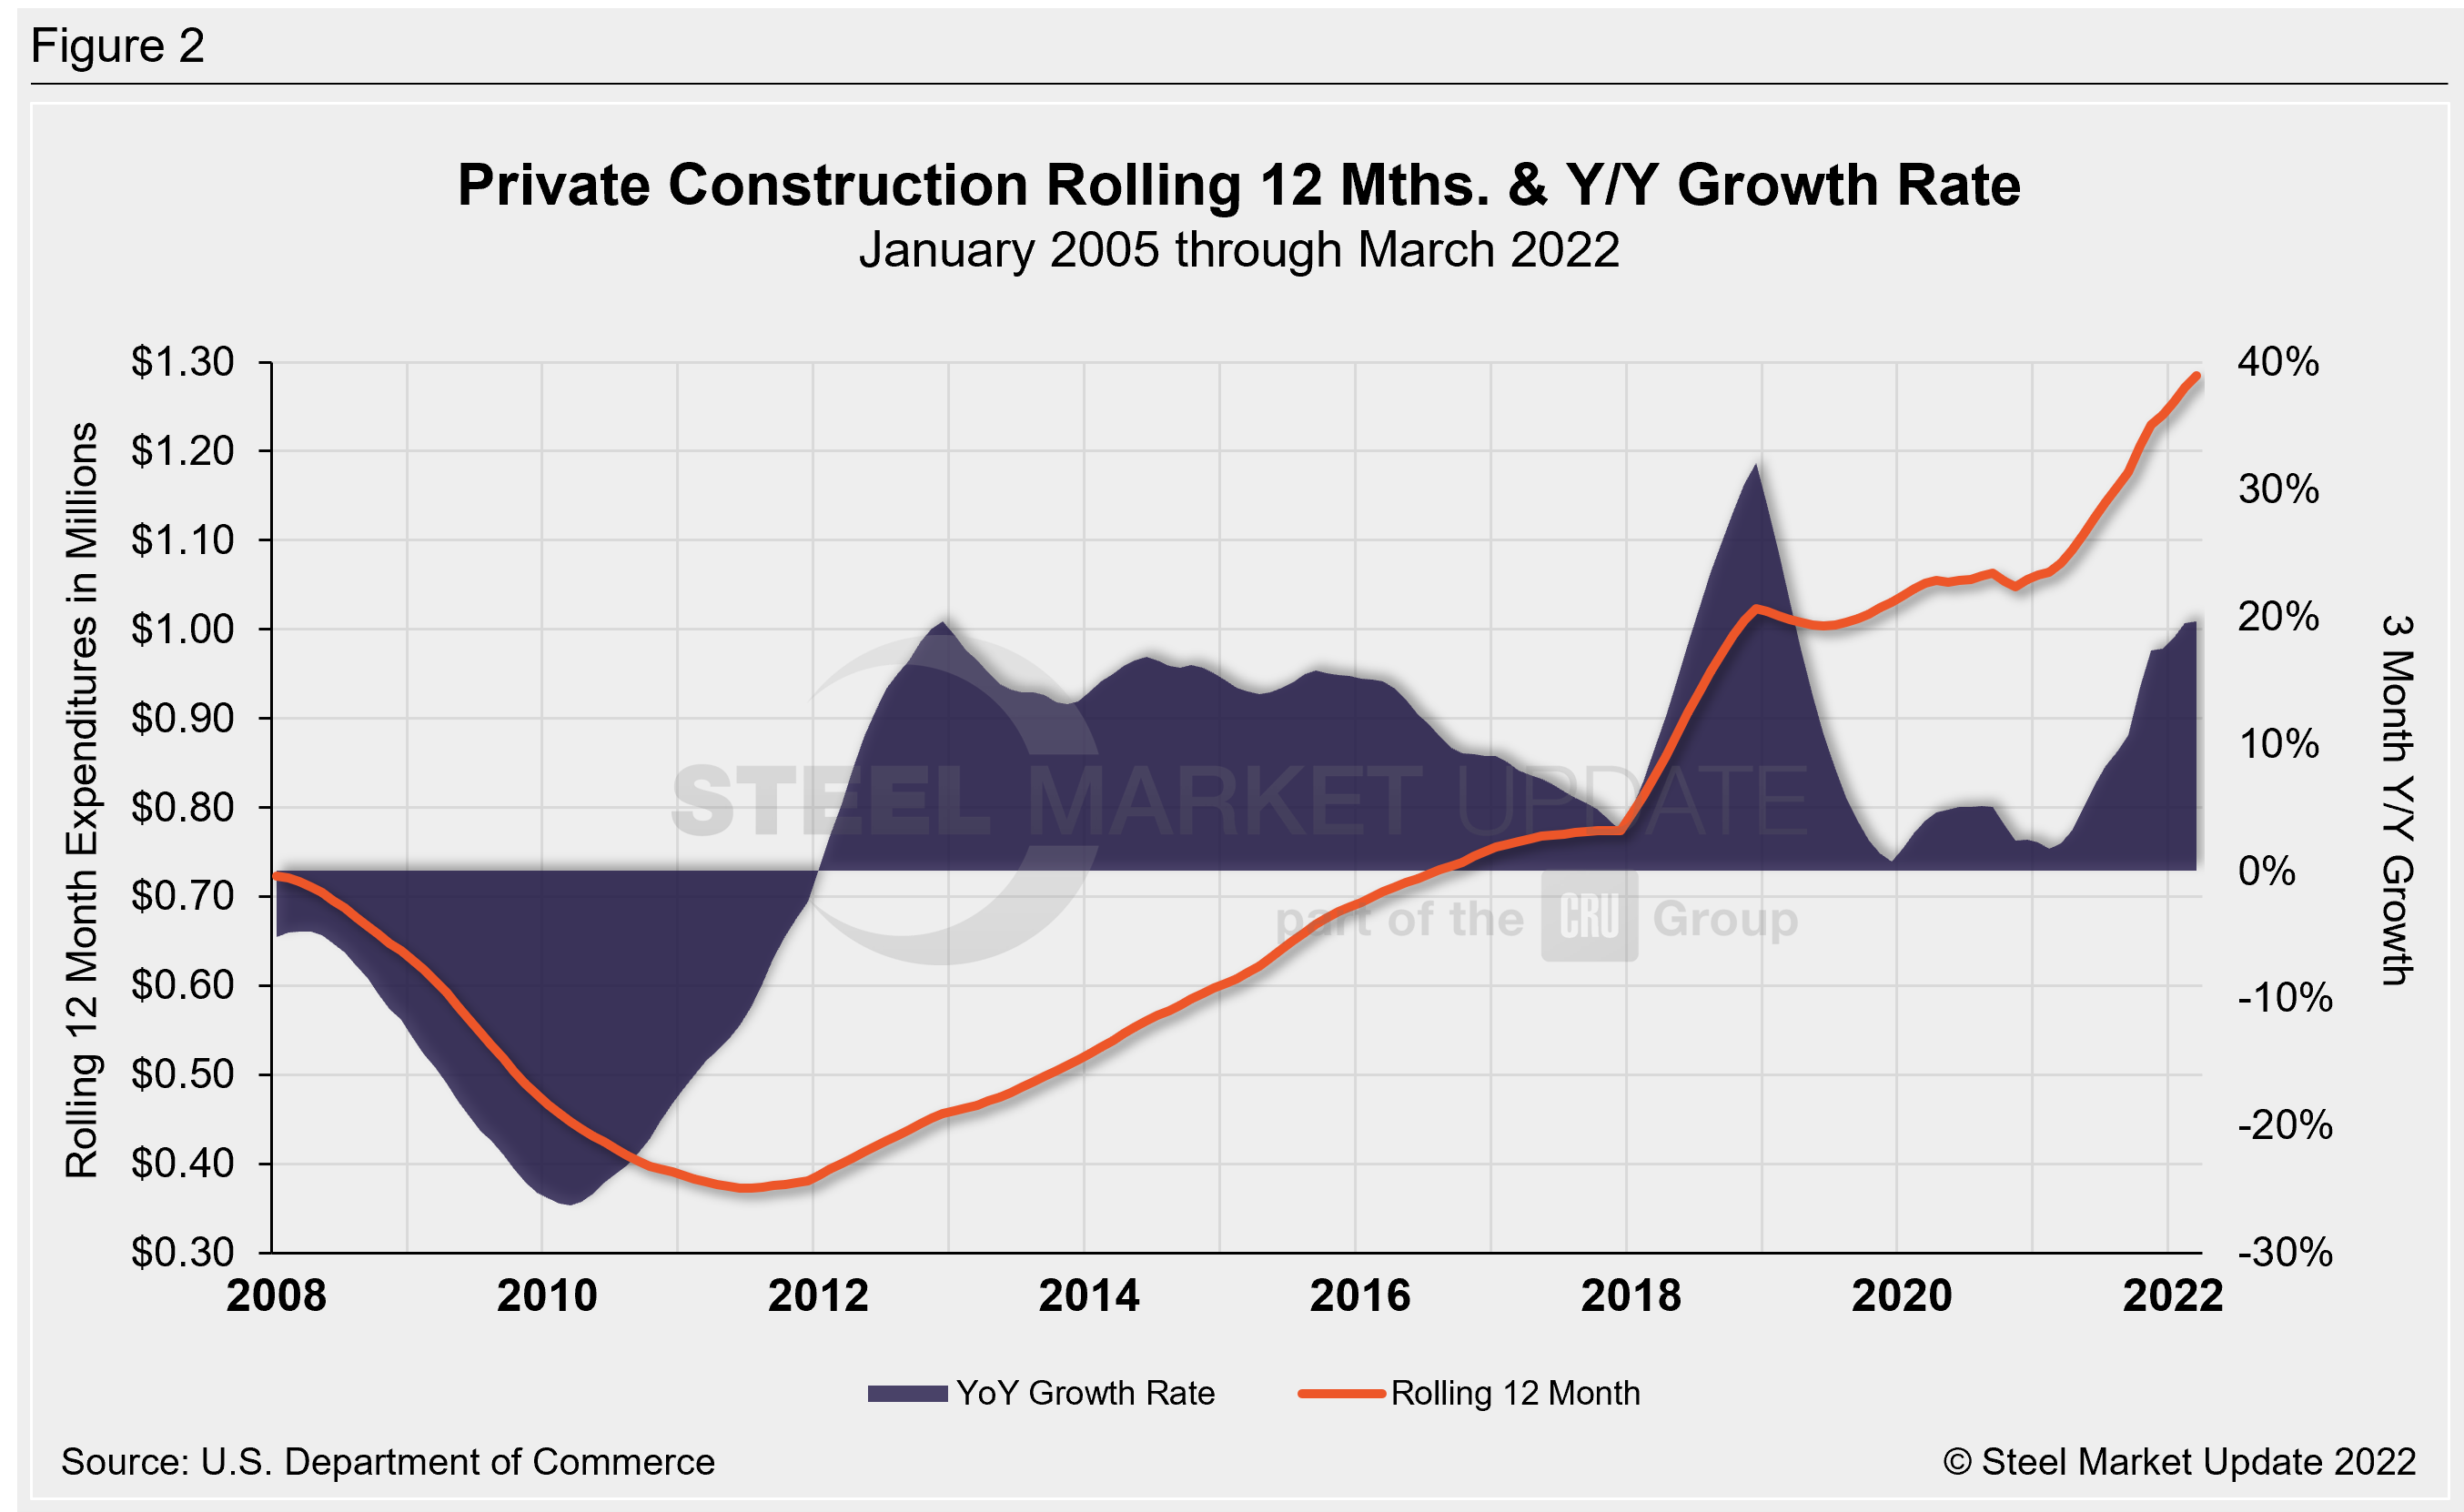
The breakdown of the $1.380 trillion private expenditures into residential and nonresidential, and their subsectors, are highlighted in Table 2 and Figure 2 below. Construction put in place in the private sector in March was up from February’s revised estimate of $1.377 trillion.
Within that category, residential construction was at a seasonally adjusted annual rate of $882.0 billion in March, 1.0% above the revised February estimate of $873.2 billion. Nonresidential construction was at a seasonally adjusted annual rate of $497.6 billion in March, 1.2% below the revised February estimate of $503.6 billion.
For the first time, residential claims the lion’s share of total private construction. It’s a staggering change with respect to the share of ‘total’ claimed by residential and nonresidential. Prior to the pandemic, the former almost always accounted for about 40% of total put-in-place construction, while the latter made up the other 60%.
For the first time, residential now accounts for more than half, at 53%, with nonresidential at 47%, based on year-to-date, non-seasonally-adjusted data.
Despite March’s continued growth among residential segments, homebuilding remains constrained by higher prices for building materials, especially framing lumber. In November, the US doubled antidumping and countervailing duties on softwood lumber imported from Canada, which made an already difficult situation even worse.
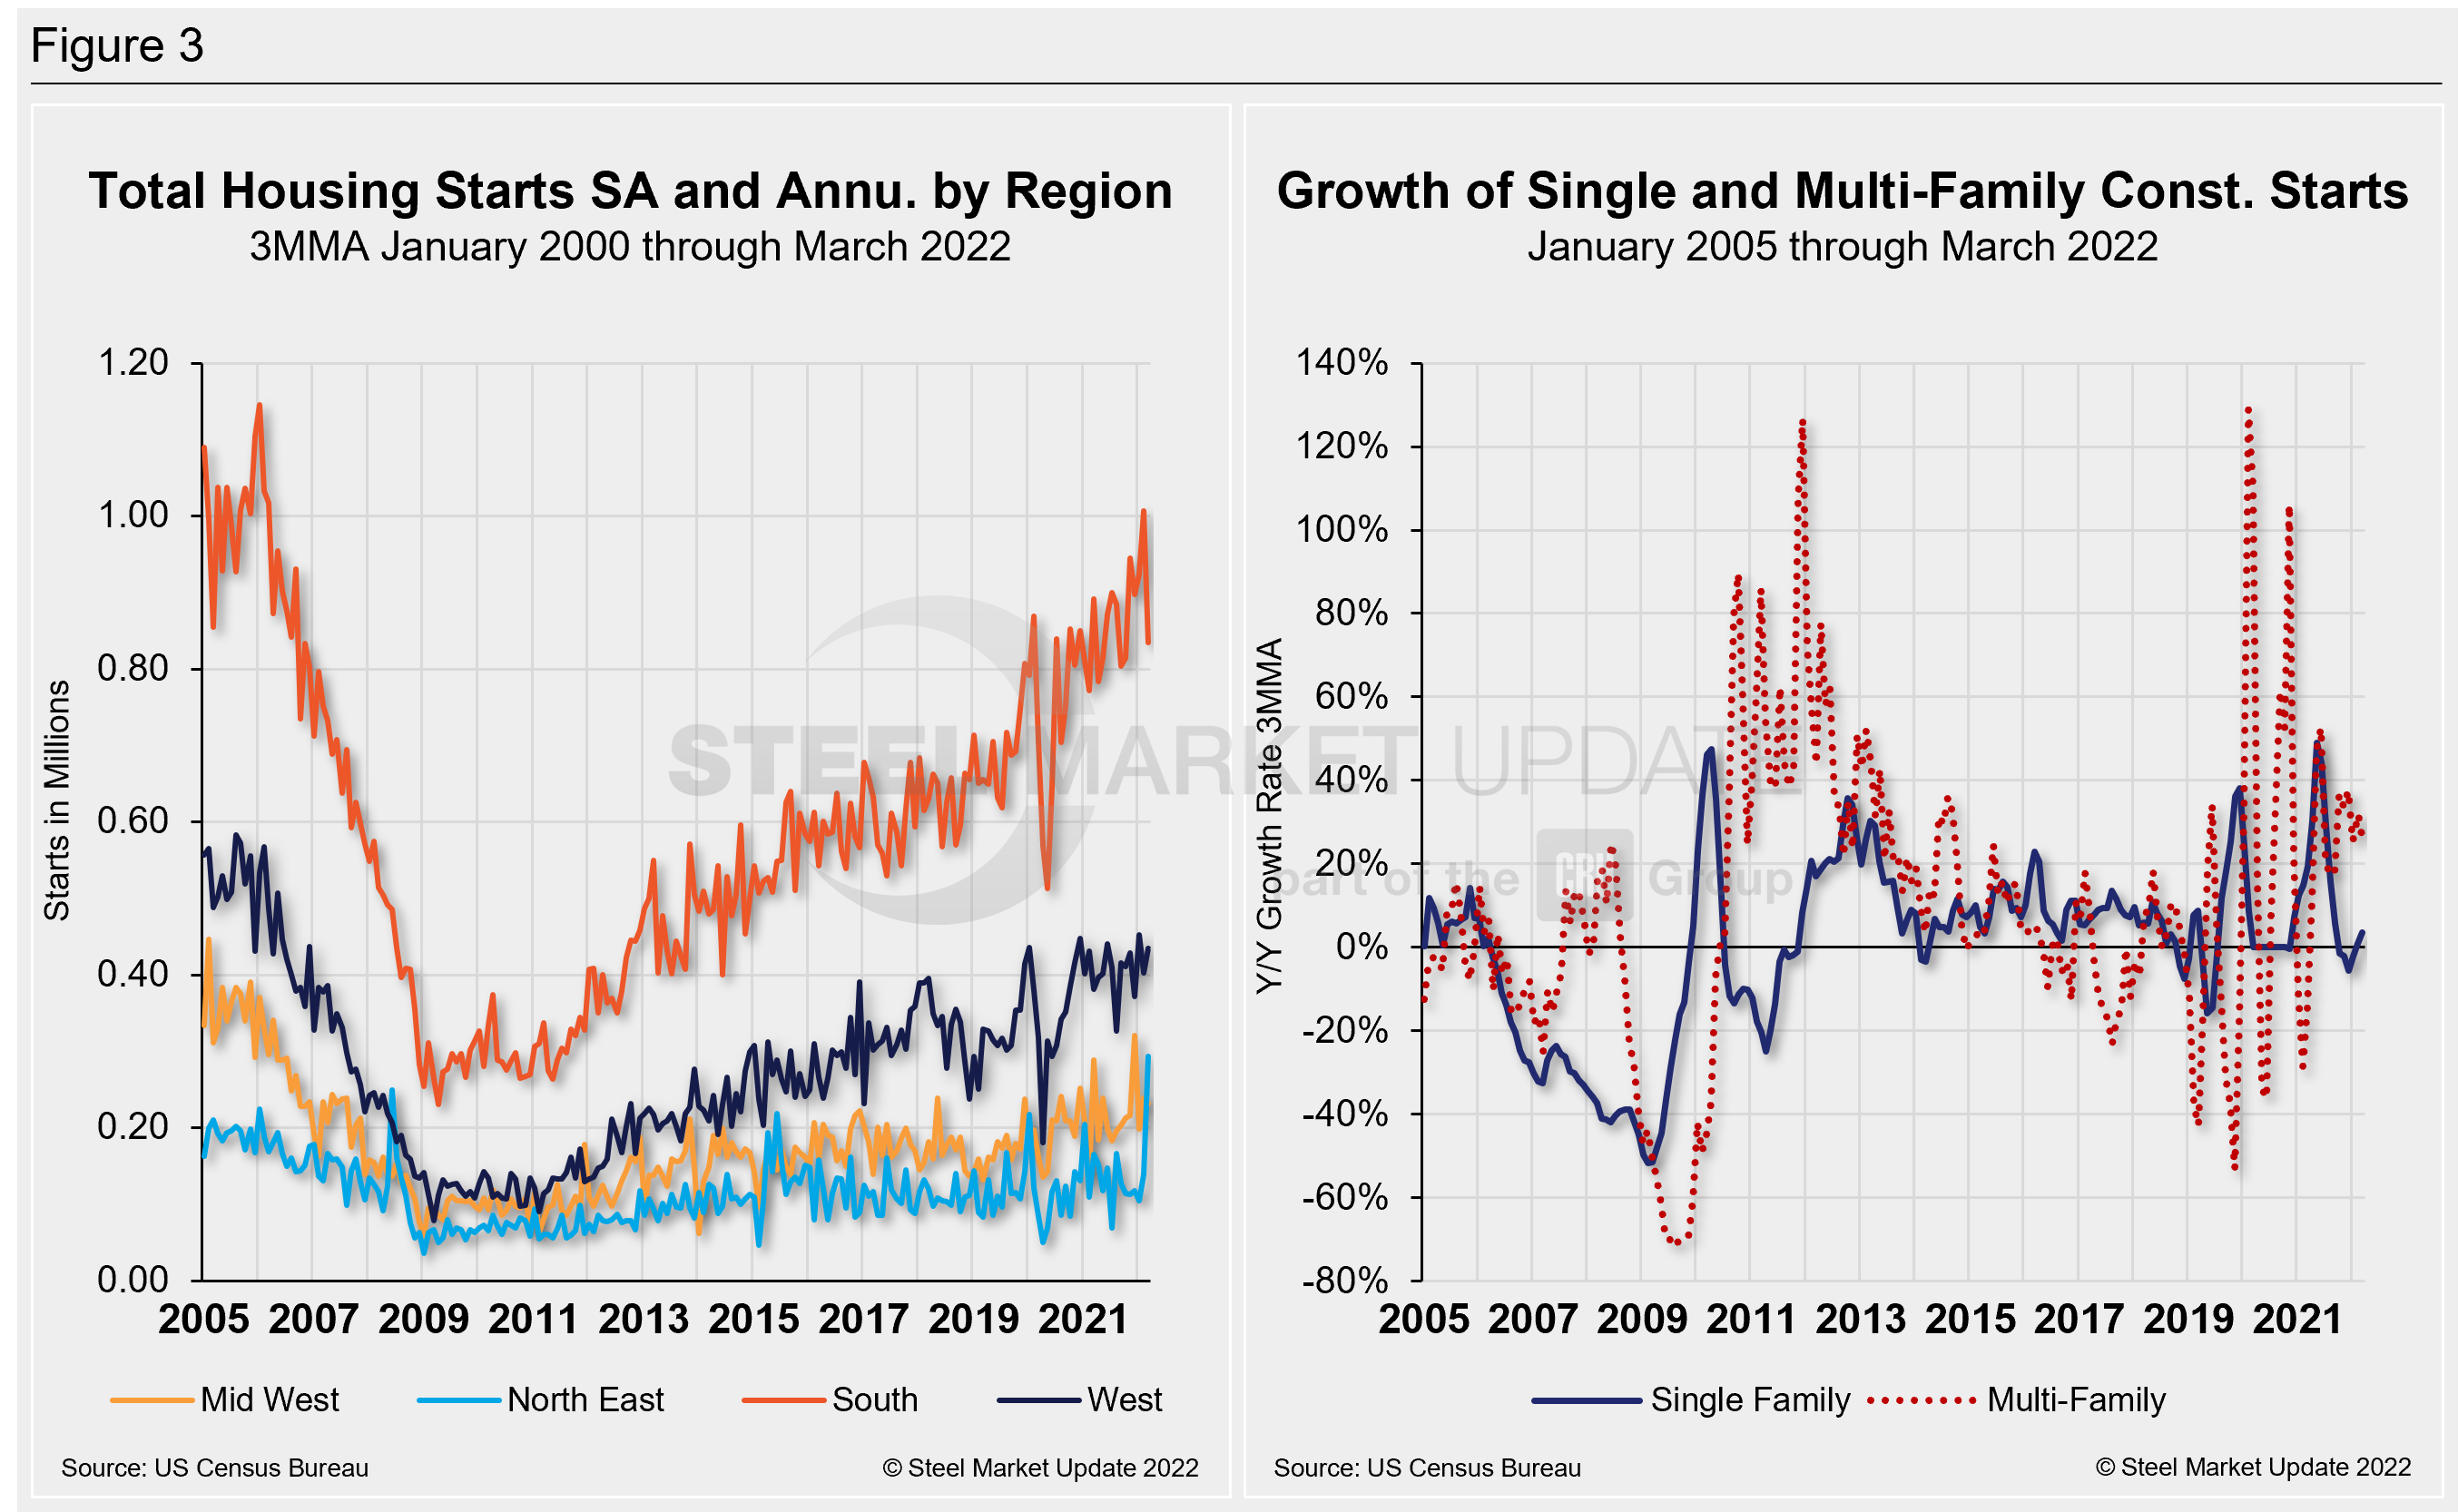
Total housing starts in four regions – the Midwest, Northeast, South and West – are displayed below (Figure 3). Figure three also displays the growth of single- and multi-family construction starts. Privately owned housing starts in March were at a seasonally adjusted annual rate of 1.793 million, up 0.3% from the revised February estimate of 1.788 million.
Regional results were split. The Midwest saw a 2.9% decline in Mach as starts totaled 232,000. The South plunged 17.2%, with 834,000 starts, down from 1 million in February. The West was up 7.7%, with with 434,000 starts in March. And the Northeast saw the largest percentage gain, more than doubling February’s output with total starts of 293,000, up 154,000 starts MoM.
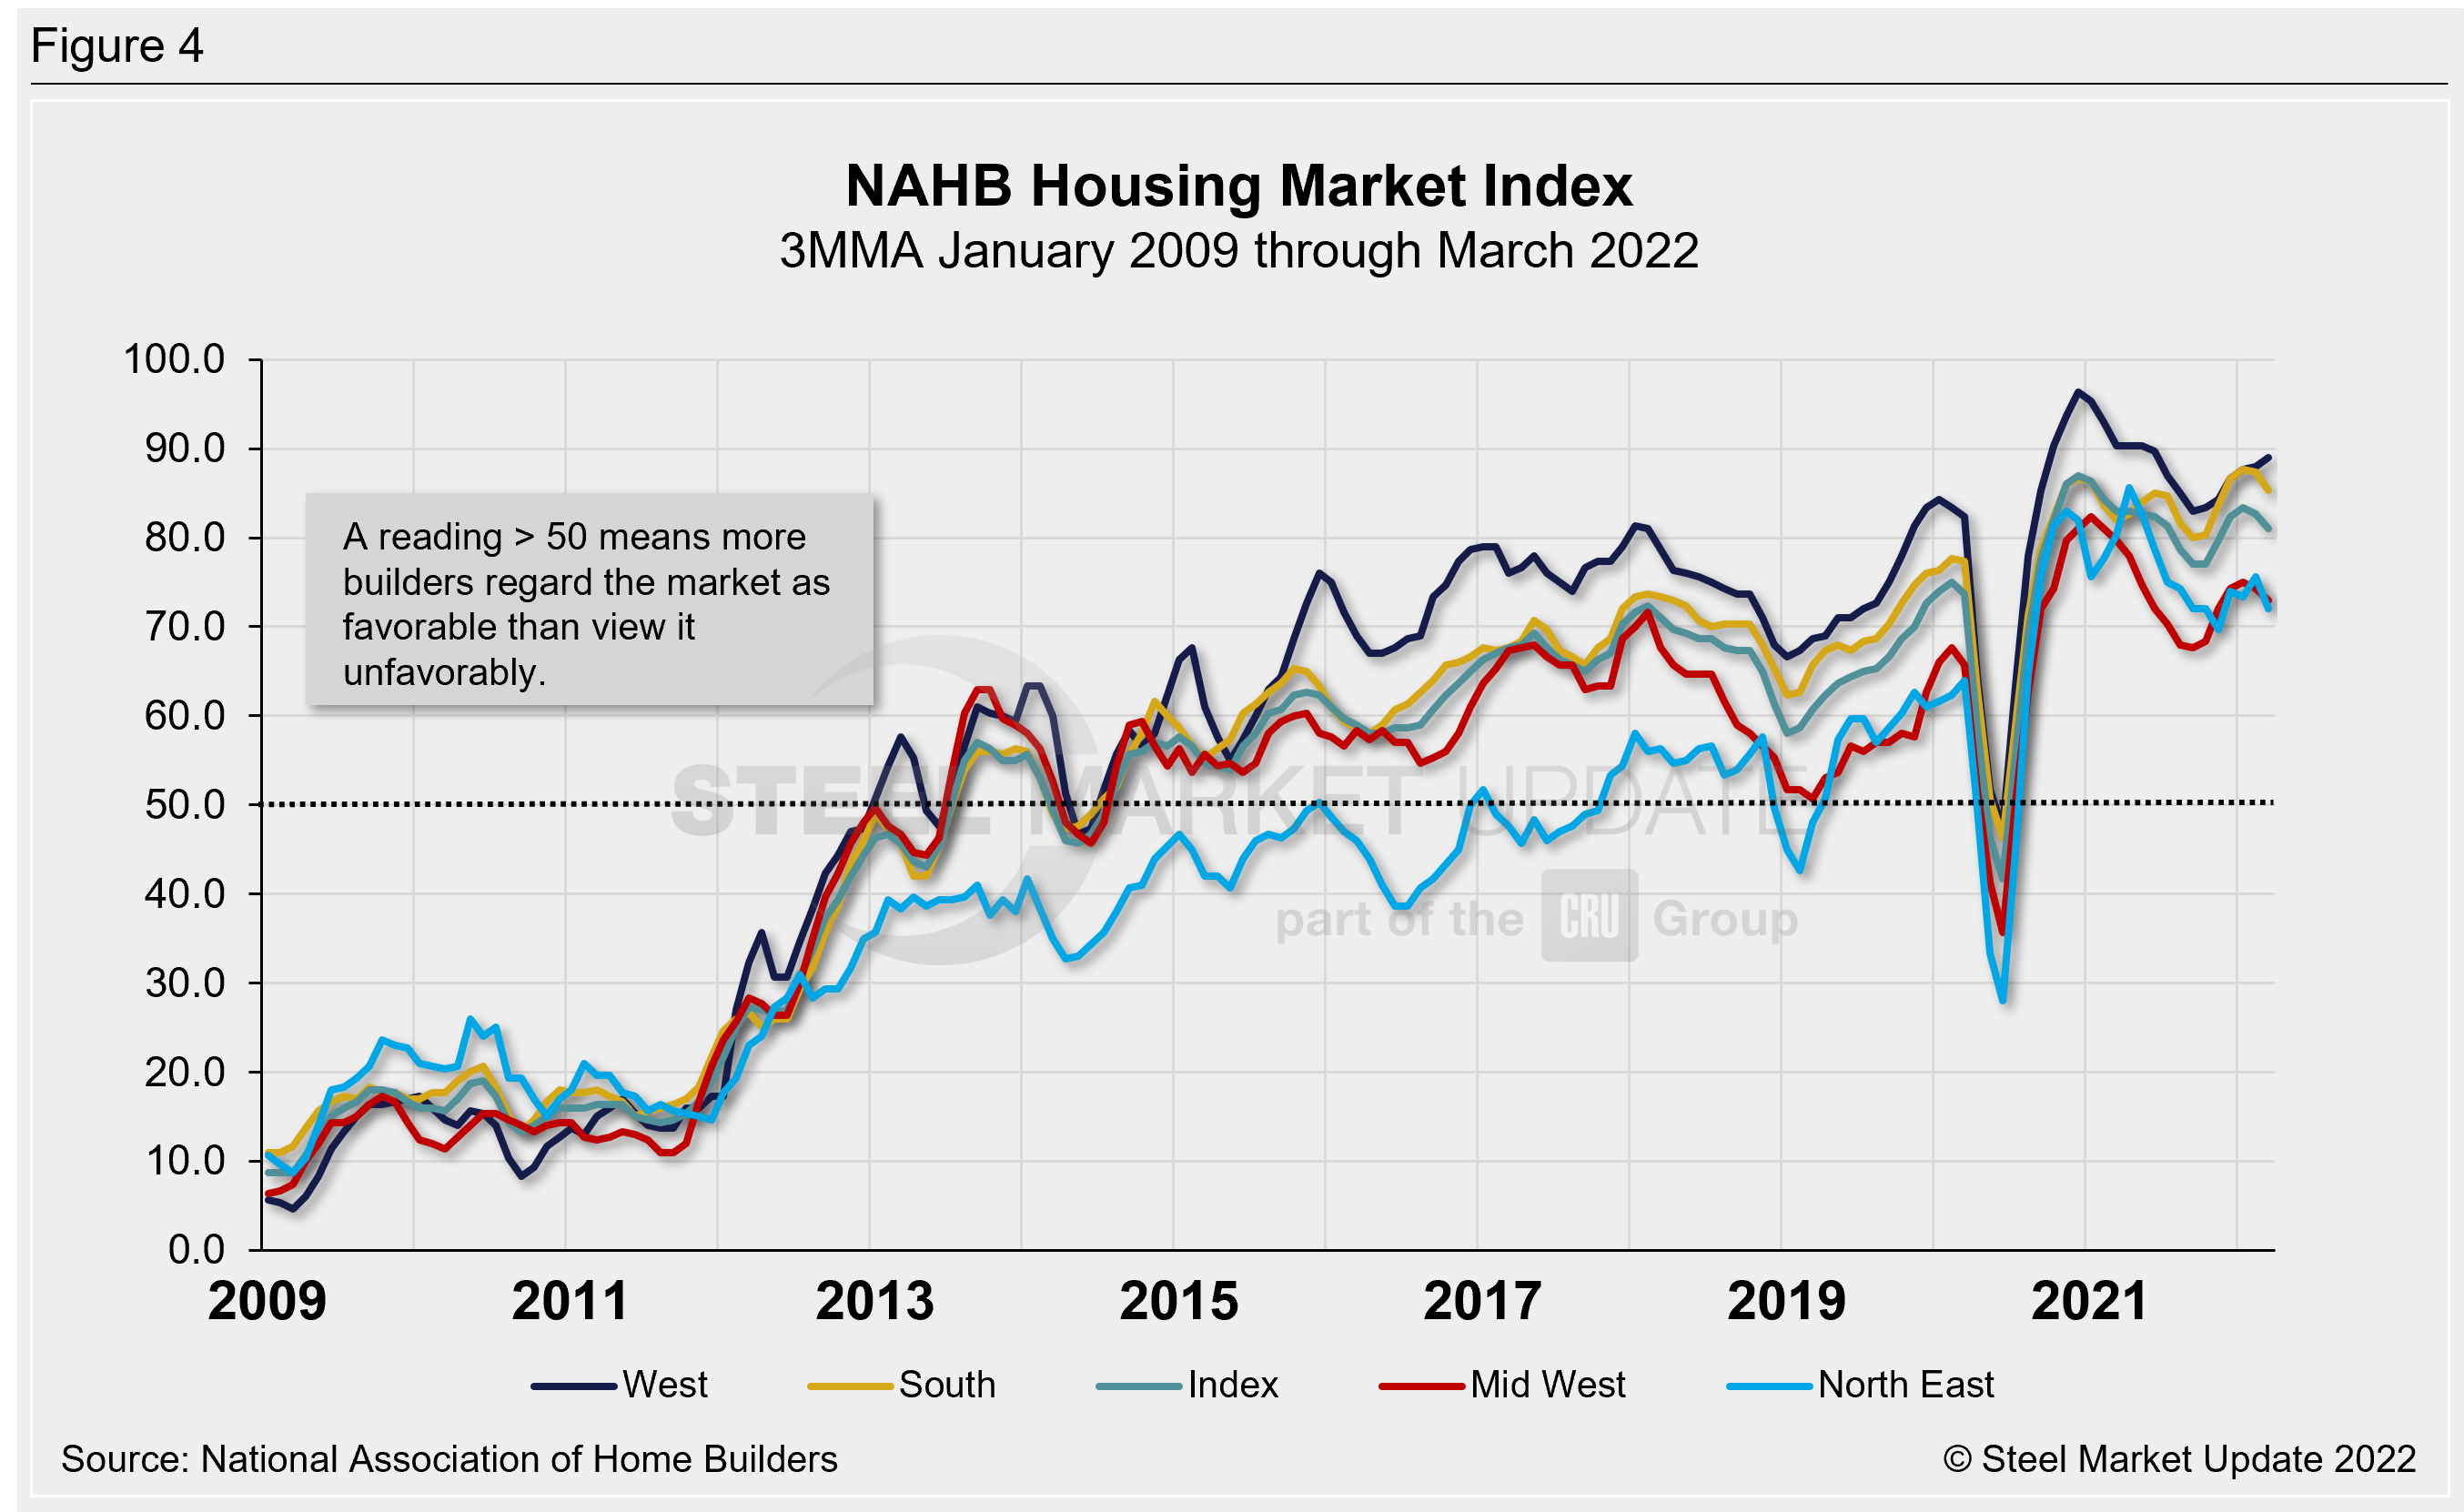
The National Association of Homebuilders (NAHB) said last month that building material production bottlenecks were raising construction costs and delaying projects. NAHB’s Optimism Index registered 79 in March, down slightly from 81 the month prior, and slipping for the third straight month. Advance reports indicate that the index may remain down in April (Figure 4).
State and Local Construction
The private versus public (state and local) tug-of-war within total put-in-place construction is also a compelling story. Private spending, at approximately 82% of 2022’s first-quarter total, is up 14.9% year to date. Public spending, at a little less than 18.2% of the total, is up just 0.7% over the same period. The general takeaway from industry analysts is that the government spending component is flat in ‘current’ dollars and negative in ‘real’ (inflation-adjusted) terms.
The weakness in capital spending from the public sector stands in sharp contrast to hype around the Infrastructure Investment and Jobs Act (IIJA). Expenditures resulting from the IIJA, which became law in November, have been slow to materialize.
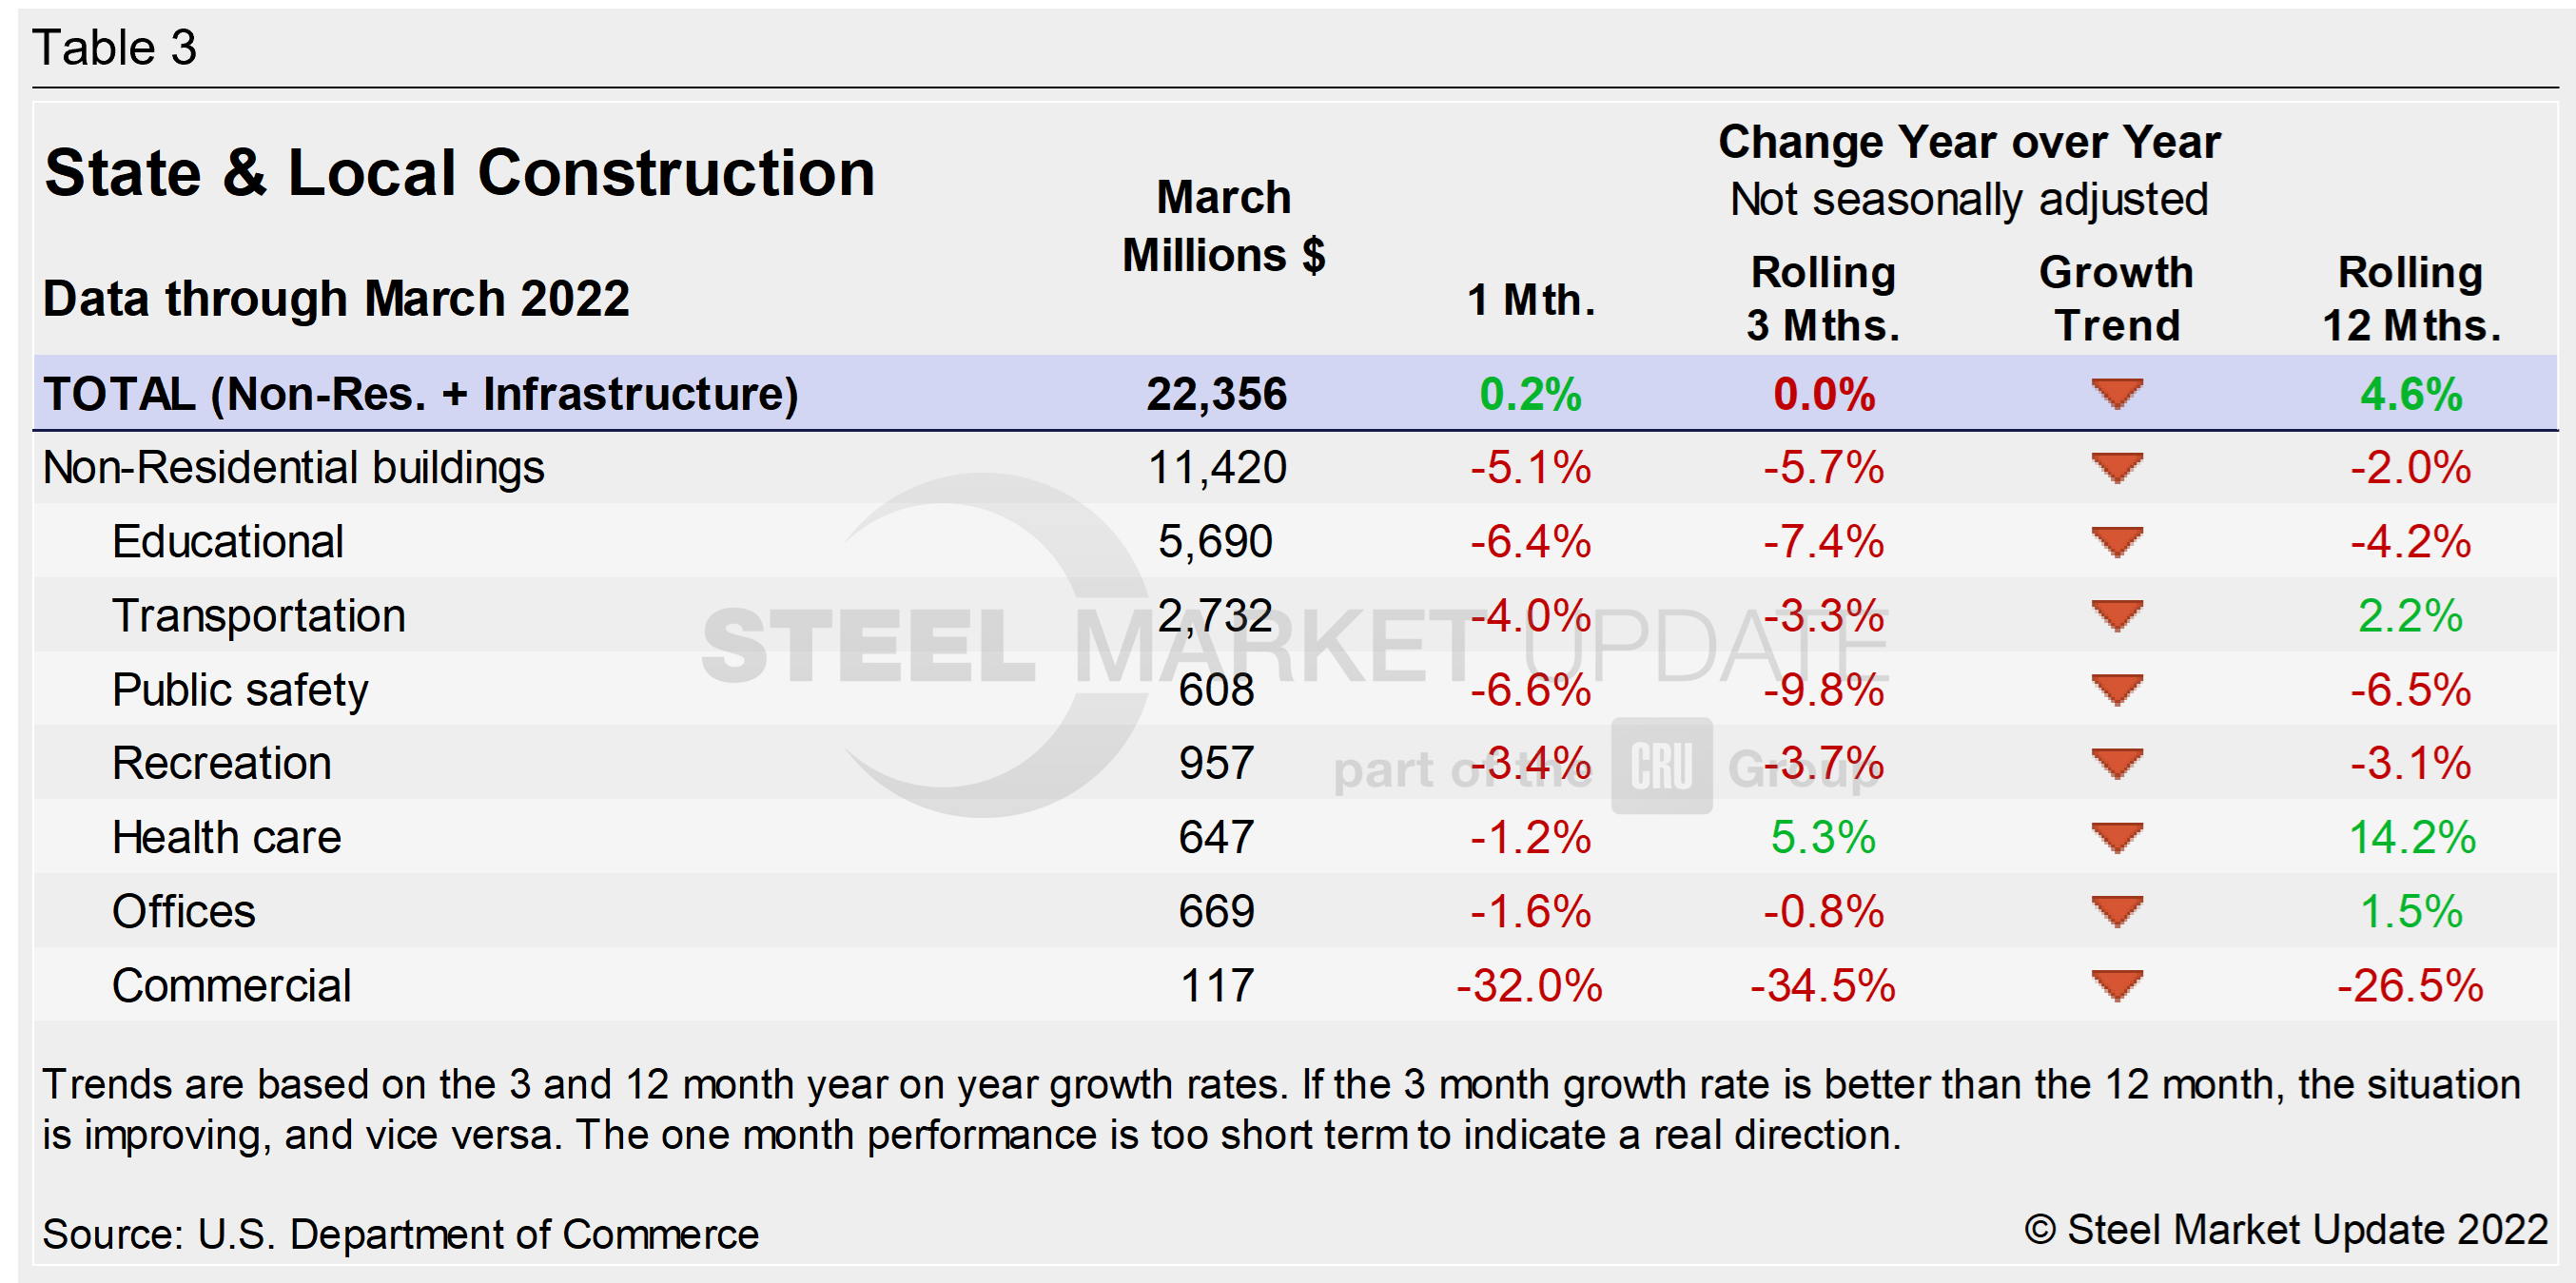
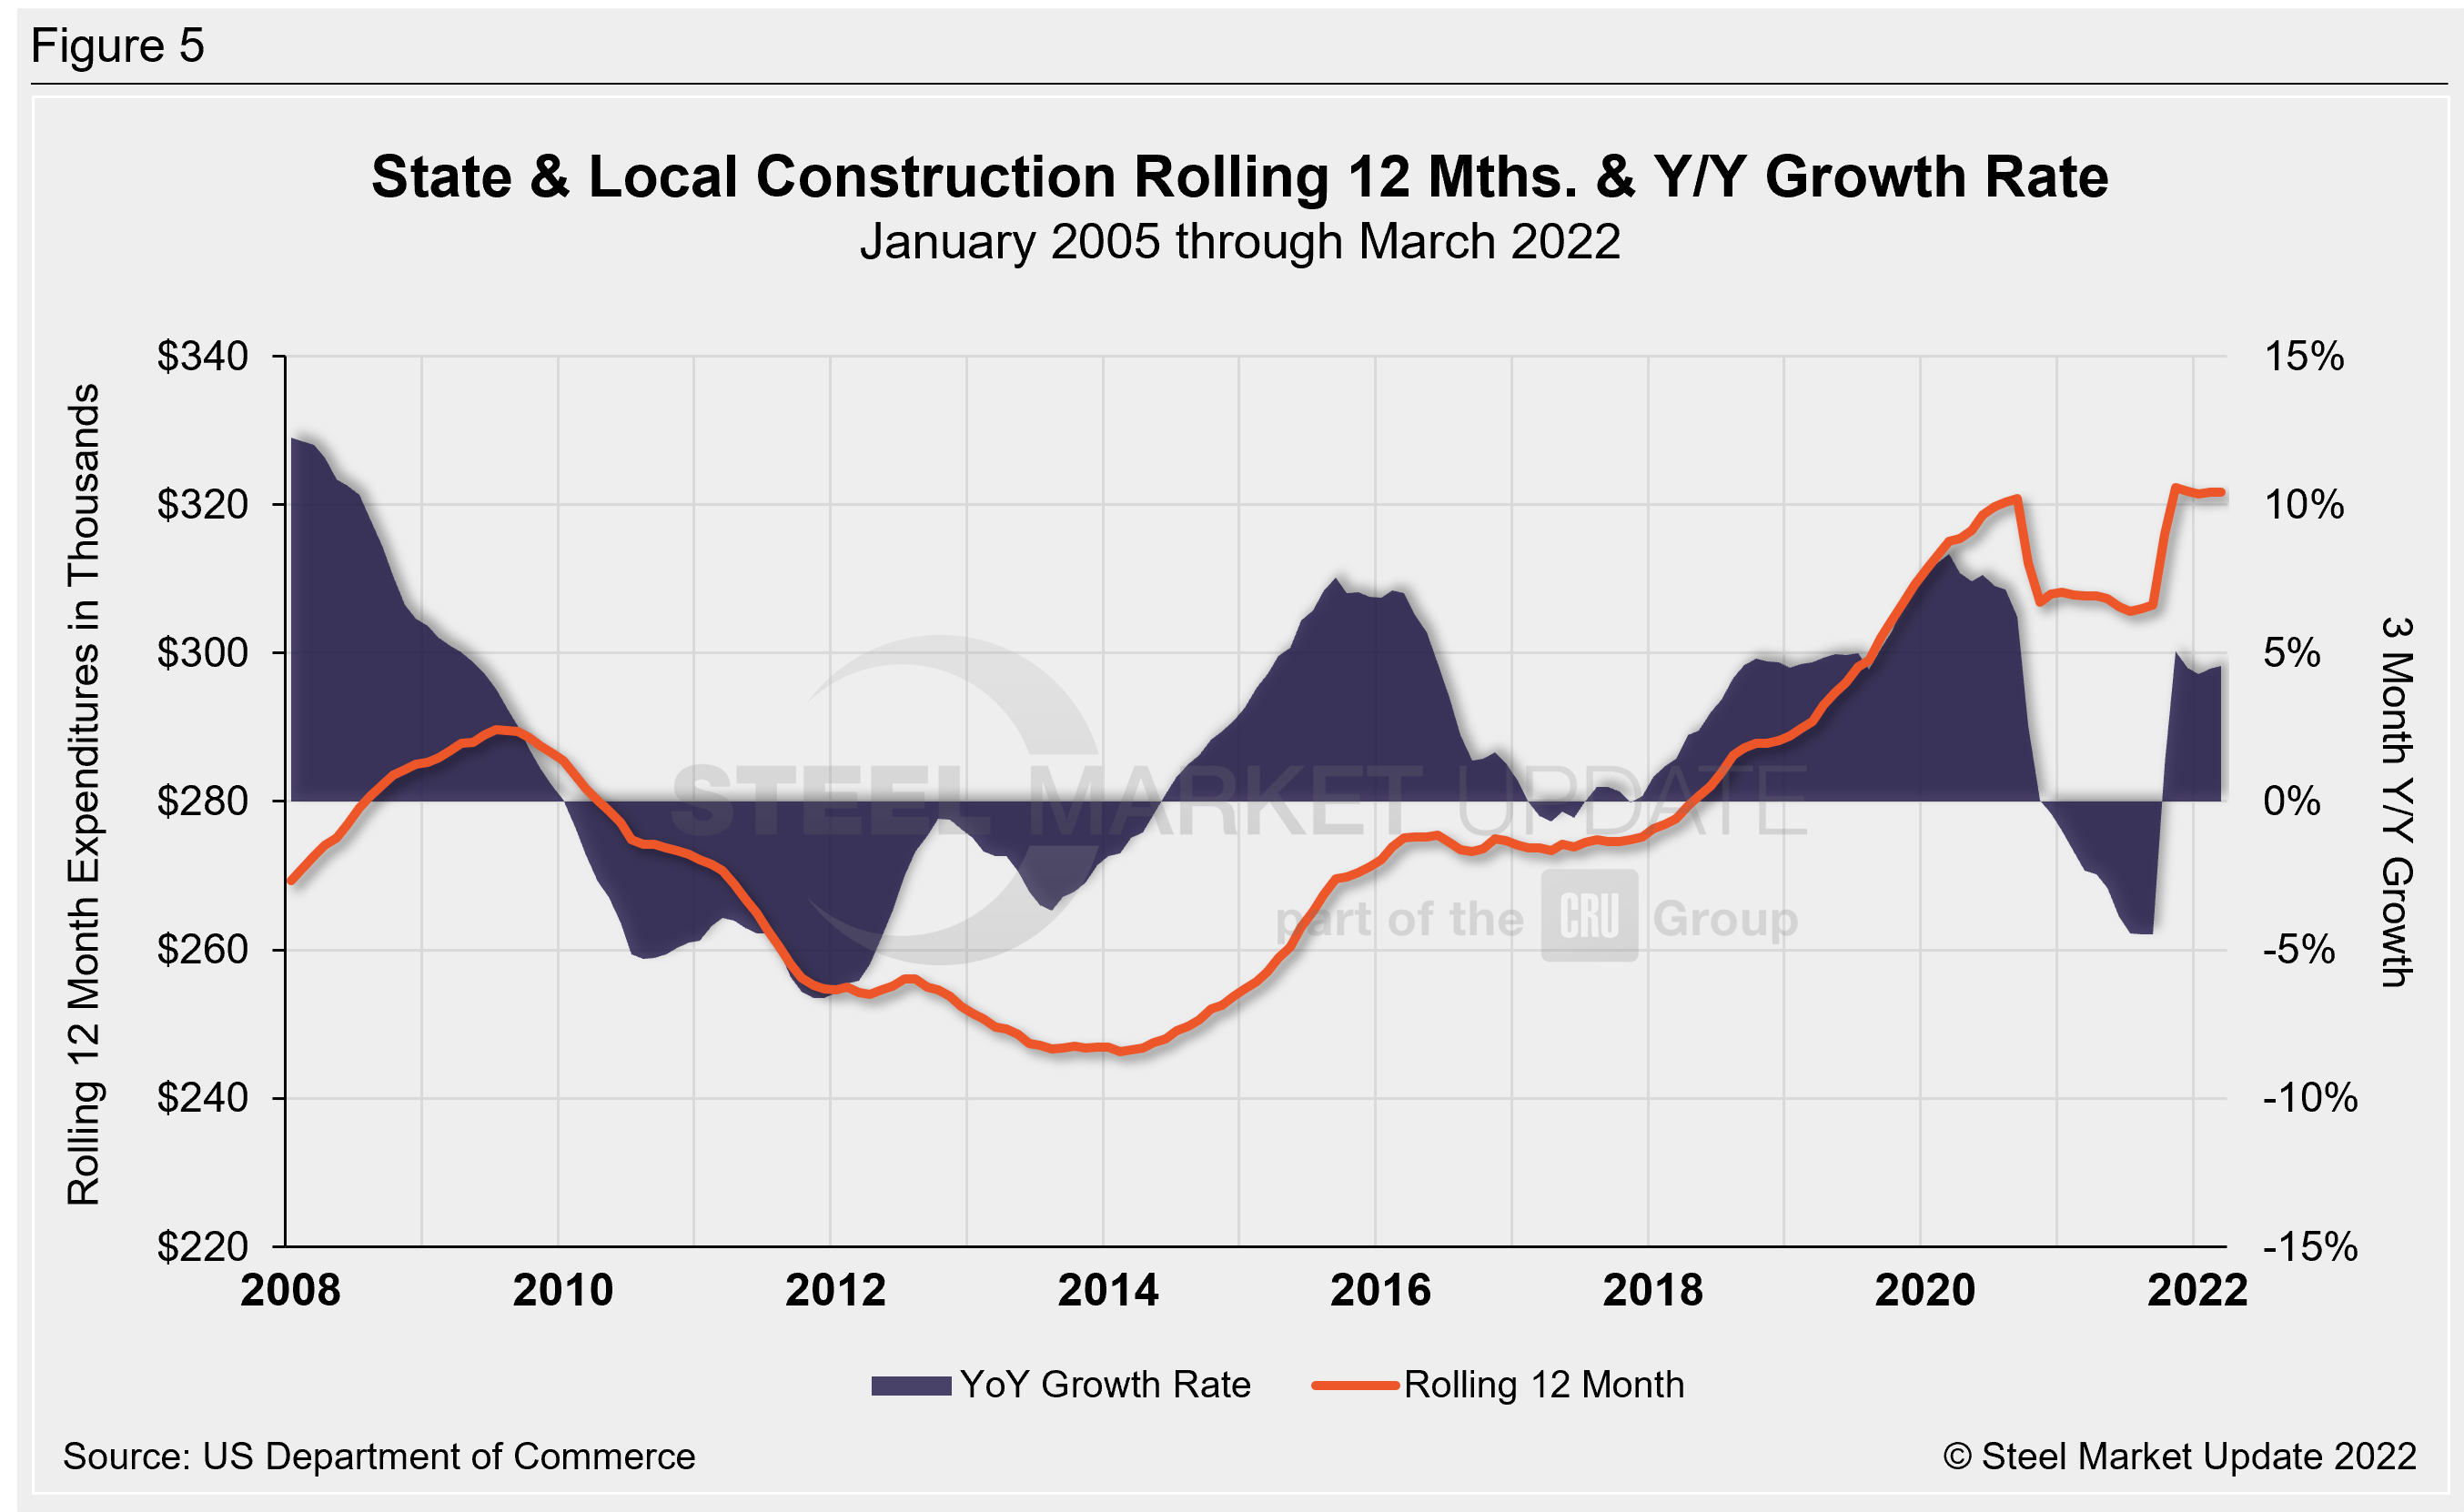
Publicly funded construction spending in March was $350.8 billion, at a seasonally adjusted rate, falling for the second straight month. March’s outlays slipped 0.2% below the revised February estimate of $351.7 billion. Spending on state and local government construction projects rose 8.5%, while federal government spending edged up just 0.1% month on month in March (see Table 3 and Figure 5 below).
Educational construction was at a seasonally adjusted annual rate of $80.3 billion, 0.8% below the revised February estimate of $81.0 billion. Highway construction was at a seasonally adjusted annual rate of $103.1 billion, 0.4% below the revised January estimate of $103.5 billion.
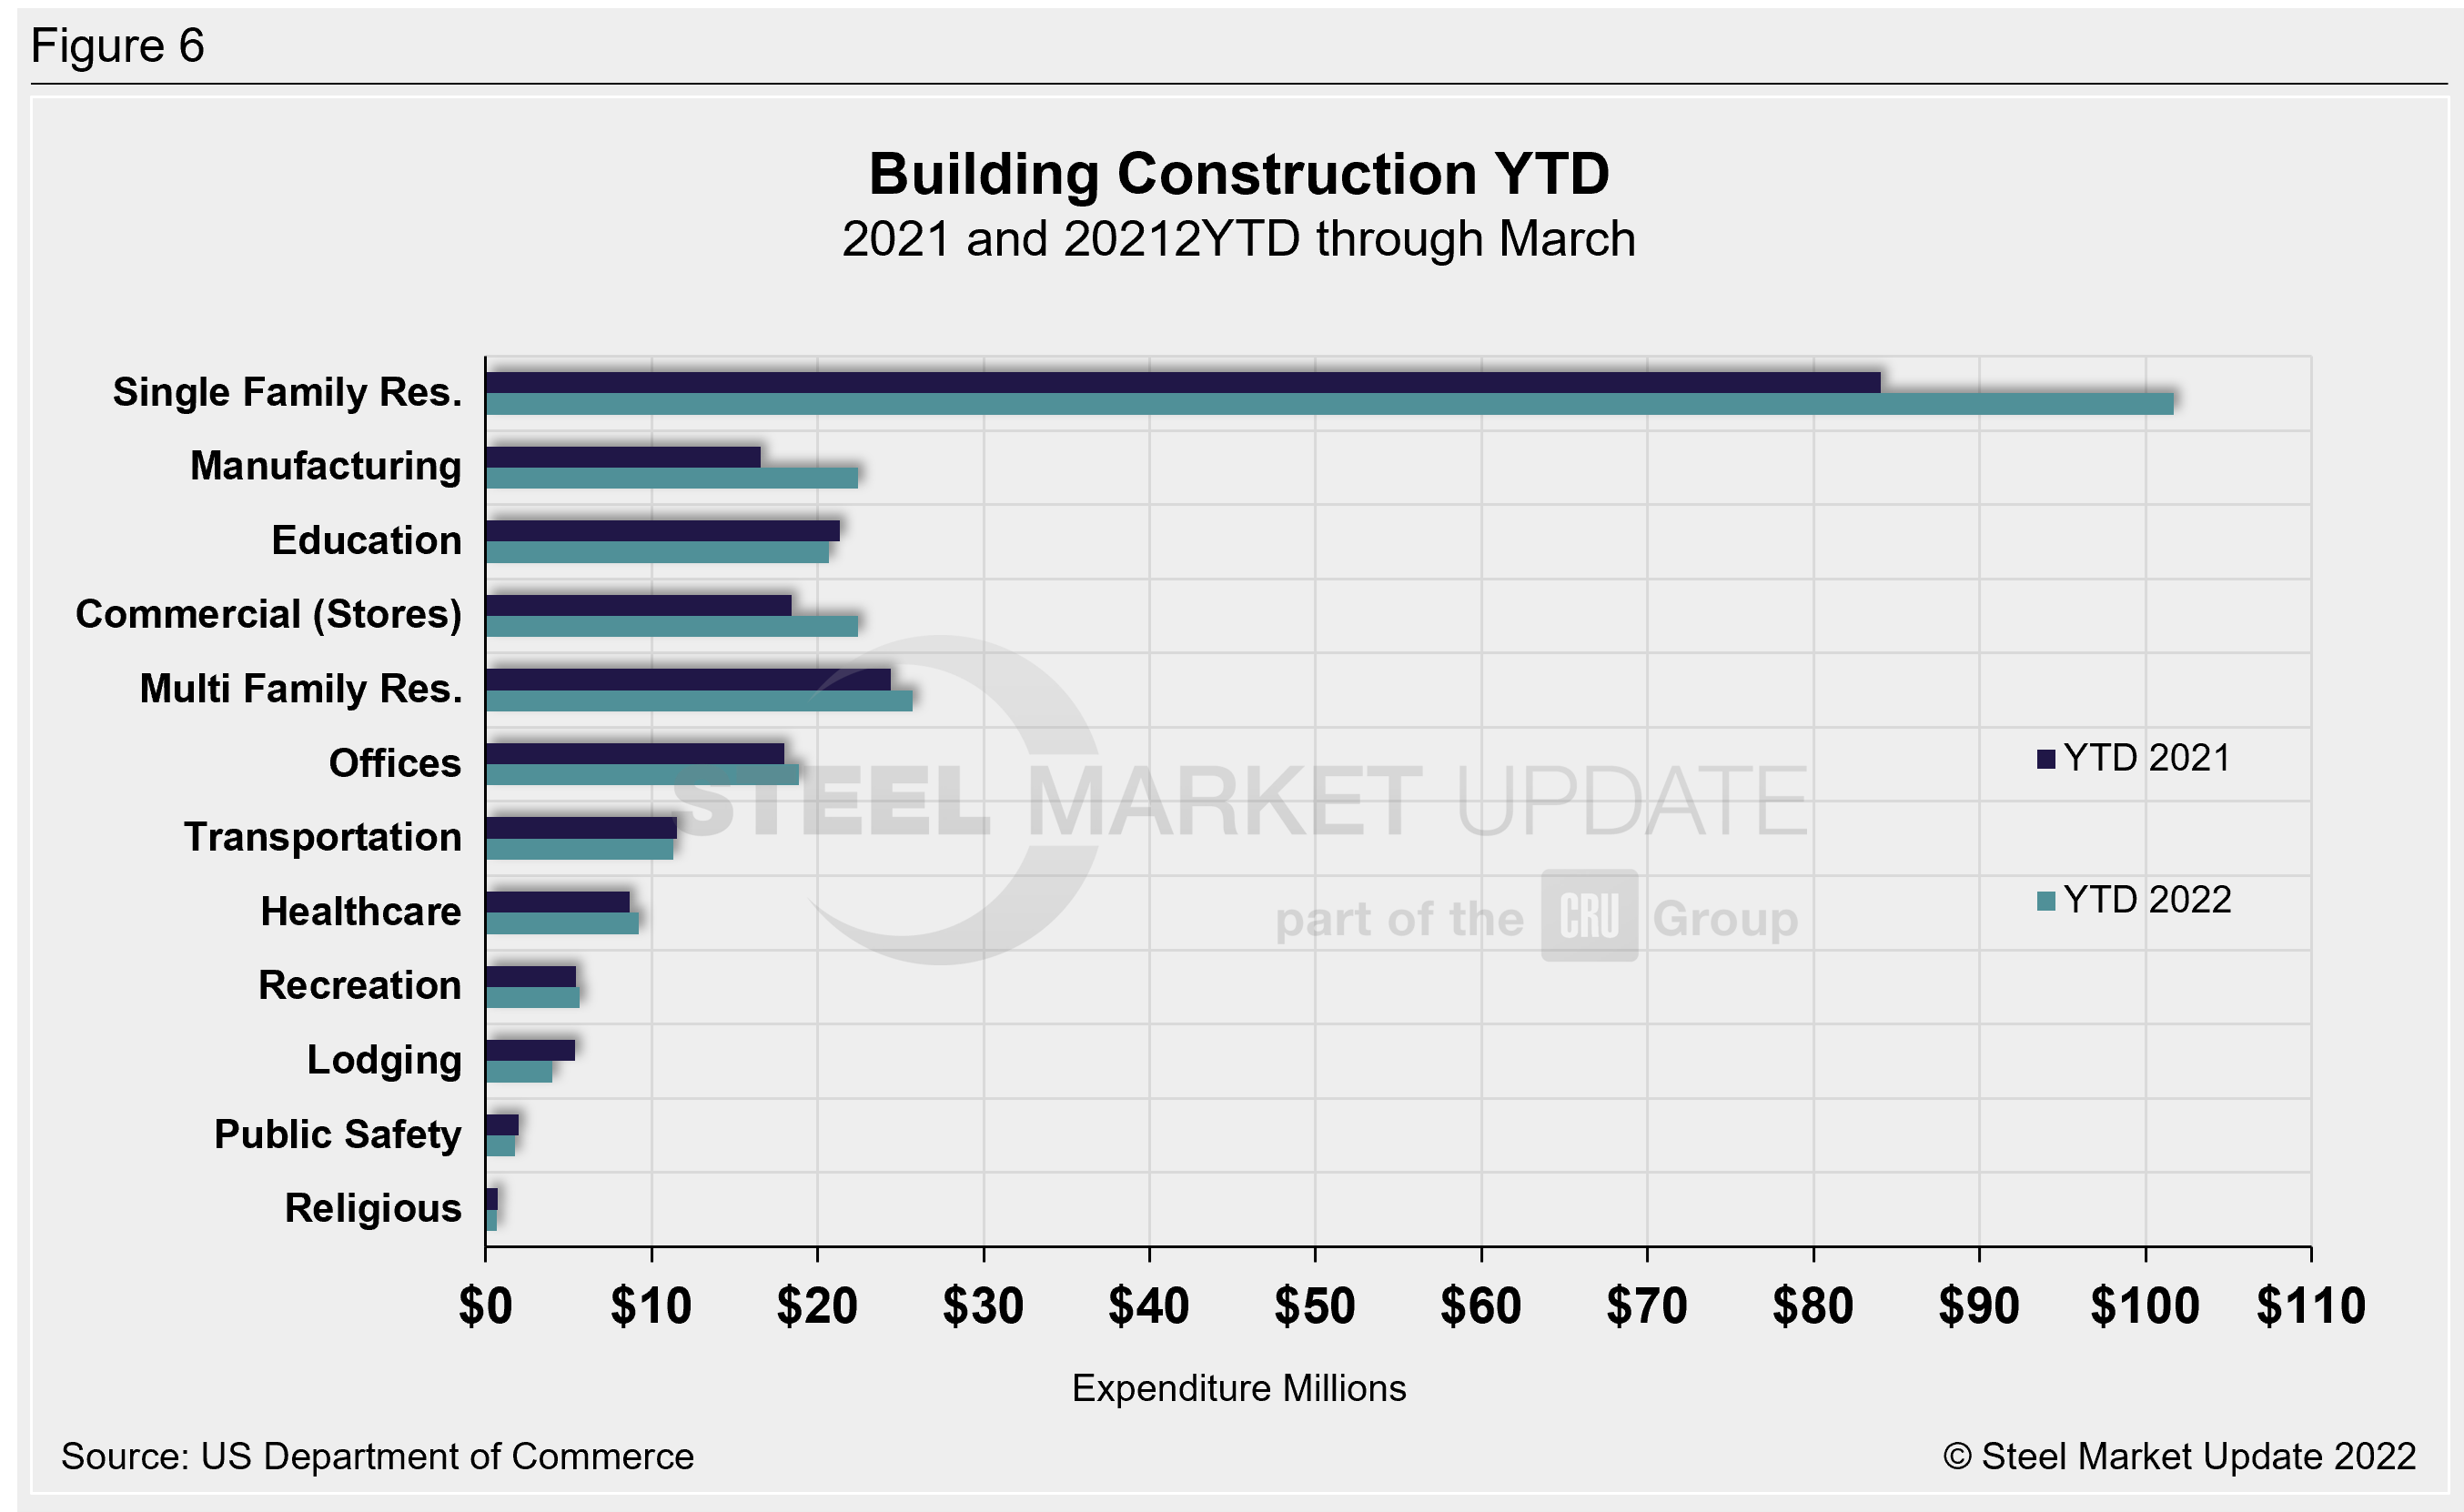
Year-to-date expenditures for construction of the various building sectors for 2021 and 2022 are compared in Figure 6. Single-family residential construction was dominant in 2021, with expenditures totaling $409.9 billion. The trend has continued into 2022: single-family residential totaled $101.7 billion through March, 21.1% above $84.1 billion a year ago. Manufacturing (+35.1%) saw the strongest subsector growth versus last year followed by commercial (+21.7%). Multifamily residential grew by 5.4% and totaled $25.7 billion when compared to the same year-ago period. Lodging is behind by double digits at 26.1% year on year, followed by religious and public safety, down by 11.2% and 9.8% respectively.
Explanation: Each month, the Commerce Department issues its Construction Put in Place (CPIP) data, usually on the first working day covering activity one month and one day earlier. There are three major categories based on funding source: private, state and local, and federal. Within these three groups are about 120 subcategories of construction projects. SMU analyzes the expenditures from the three funding categories to provide a concise summary of the steel-consuming sectors.
By David Schollaert, David@SteelMarketUpdate.com


