Market Data

April 23, 2022
March ABI Shows Strong Growth for Design Services
Written by David Schollaert
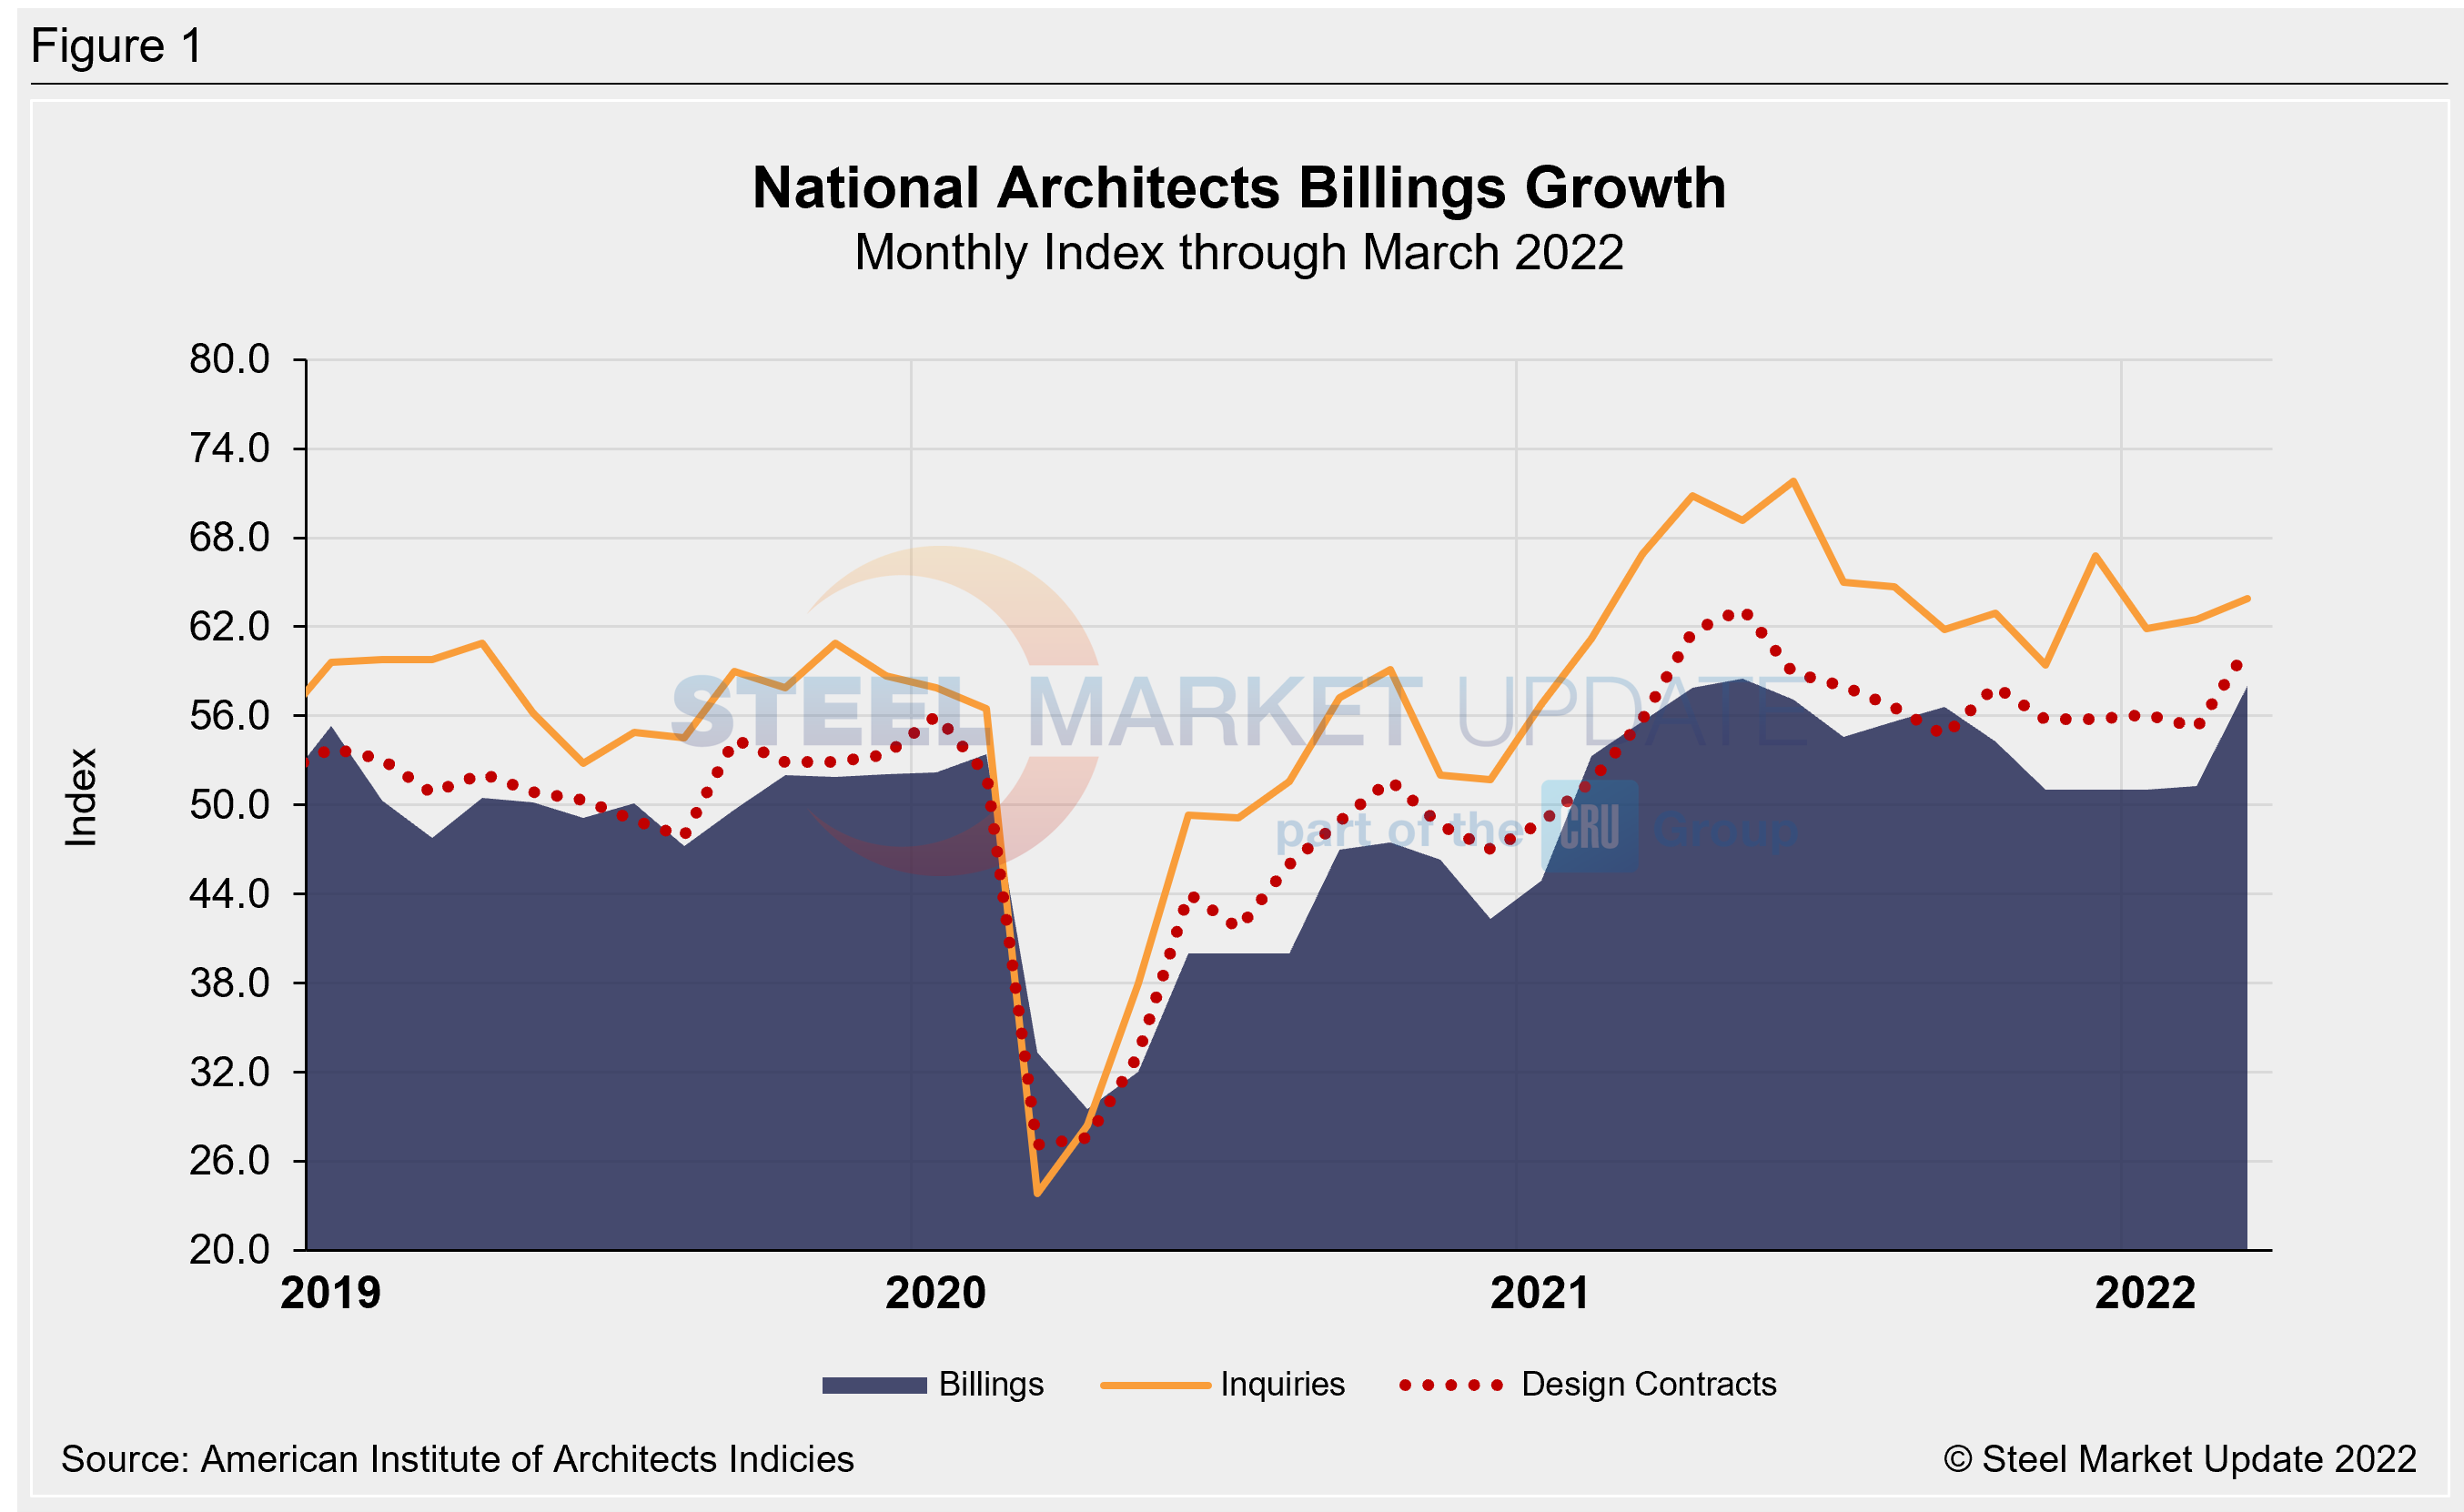
Demand for design services from architecture firms in the US expanded sharply in March, following a more modest increase over the previous three months. The gain marked the 14th consecutive month of growth following the pandemic-induced downturn in 2020.
March’s AIA’s Architecture Billings Index registered 58.0, according to the latest report from the American Institute of Architects, one of the highest scores seen since the economic recovery began just over a year ago. The ABI is an advanced economic indicator for nonresidential construction activity with a lead time of 9-12 months. A score above 50 indicates an increase in activity, and a score below 50 indicates a decrease.
Most architecture firms reported robust business conditions, despite ongoing concerns about rising inflation and the war in Ukraine. Indicators of future work strengthened last month, driven by the value of new design contracts. Backlogs stood at an average of 7.2 months at the end of the first quarter of 2022. The result was more than a month longer versus the same year-ago period, and a new all-time high since data collection on backlogs began in 2010.
Though future design contracts and backlogs are strong and detail plenty of projects in the pipeline, finding enough workers to complete expected projects remains challenging.
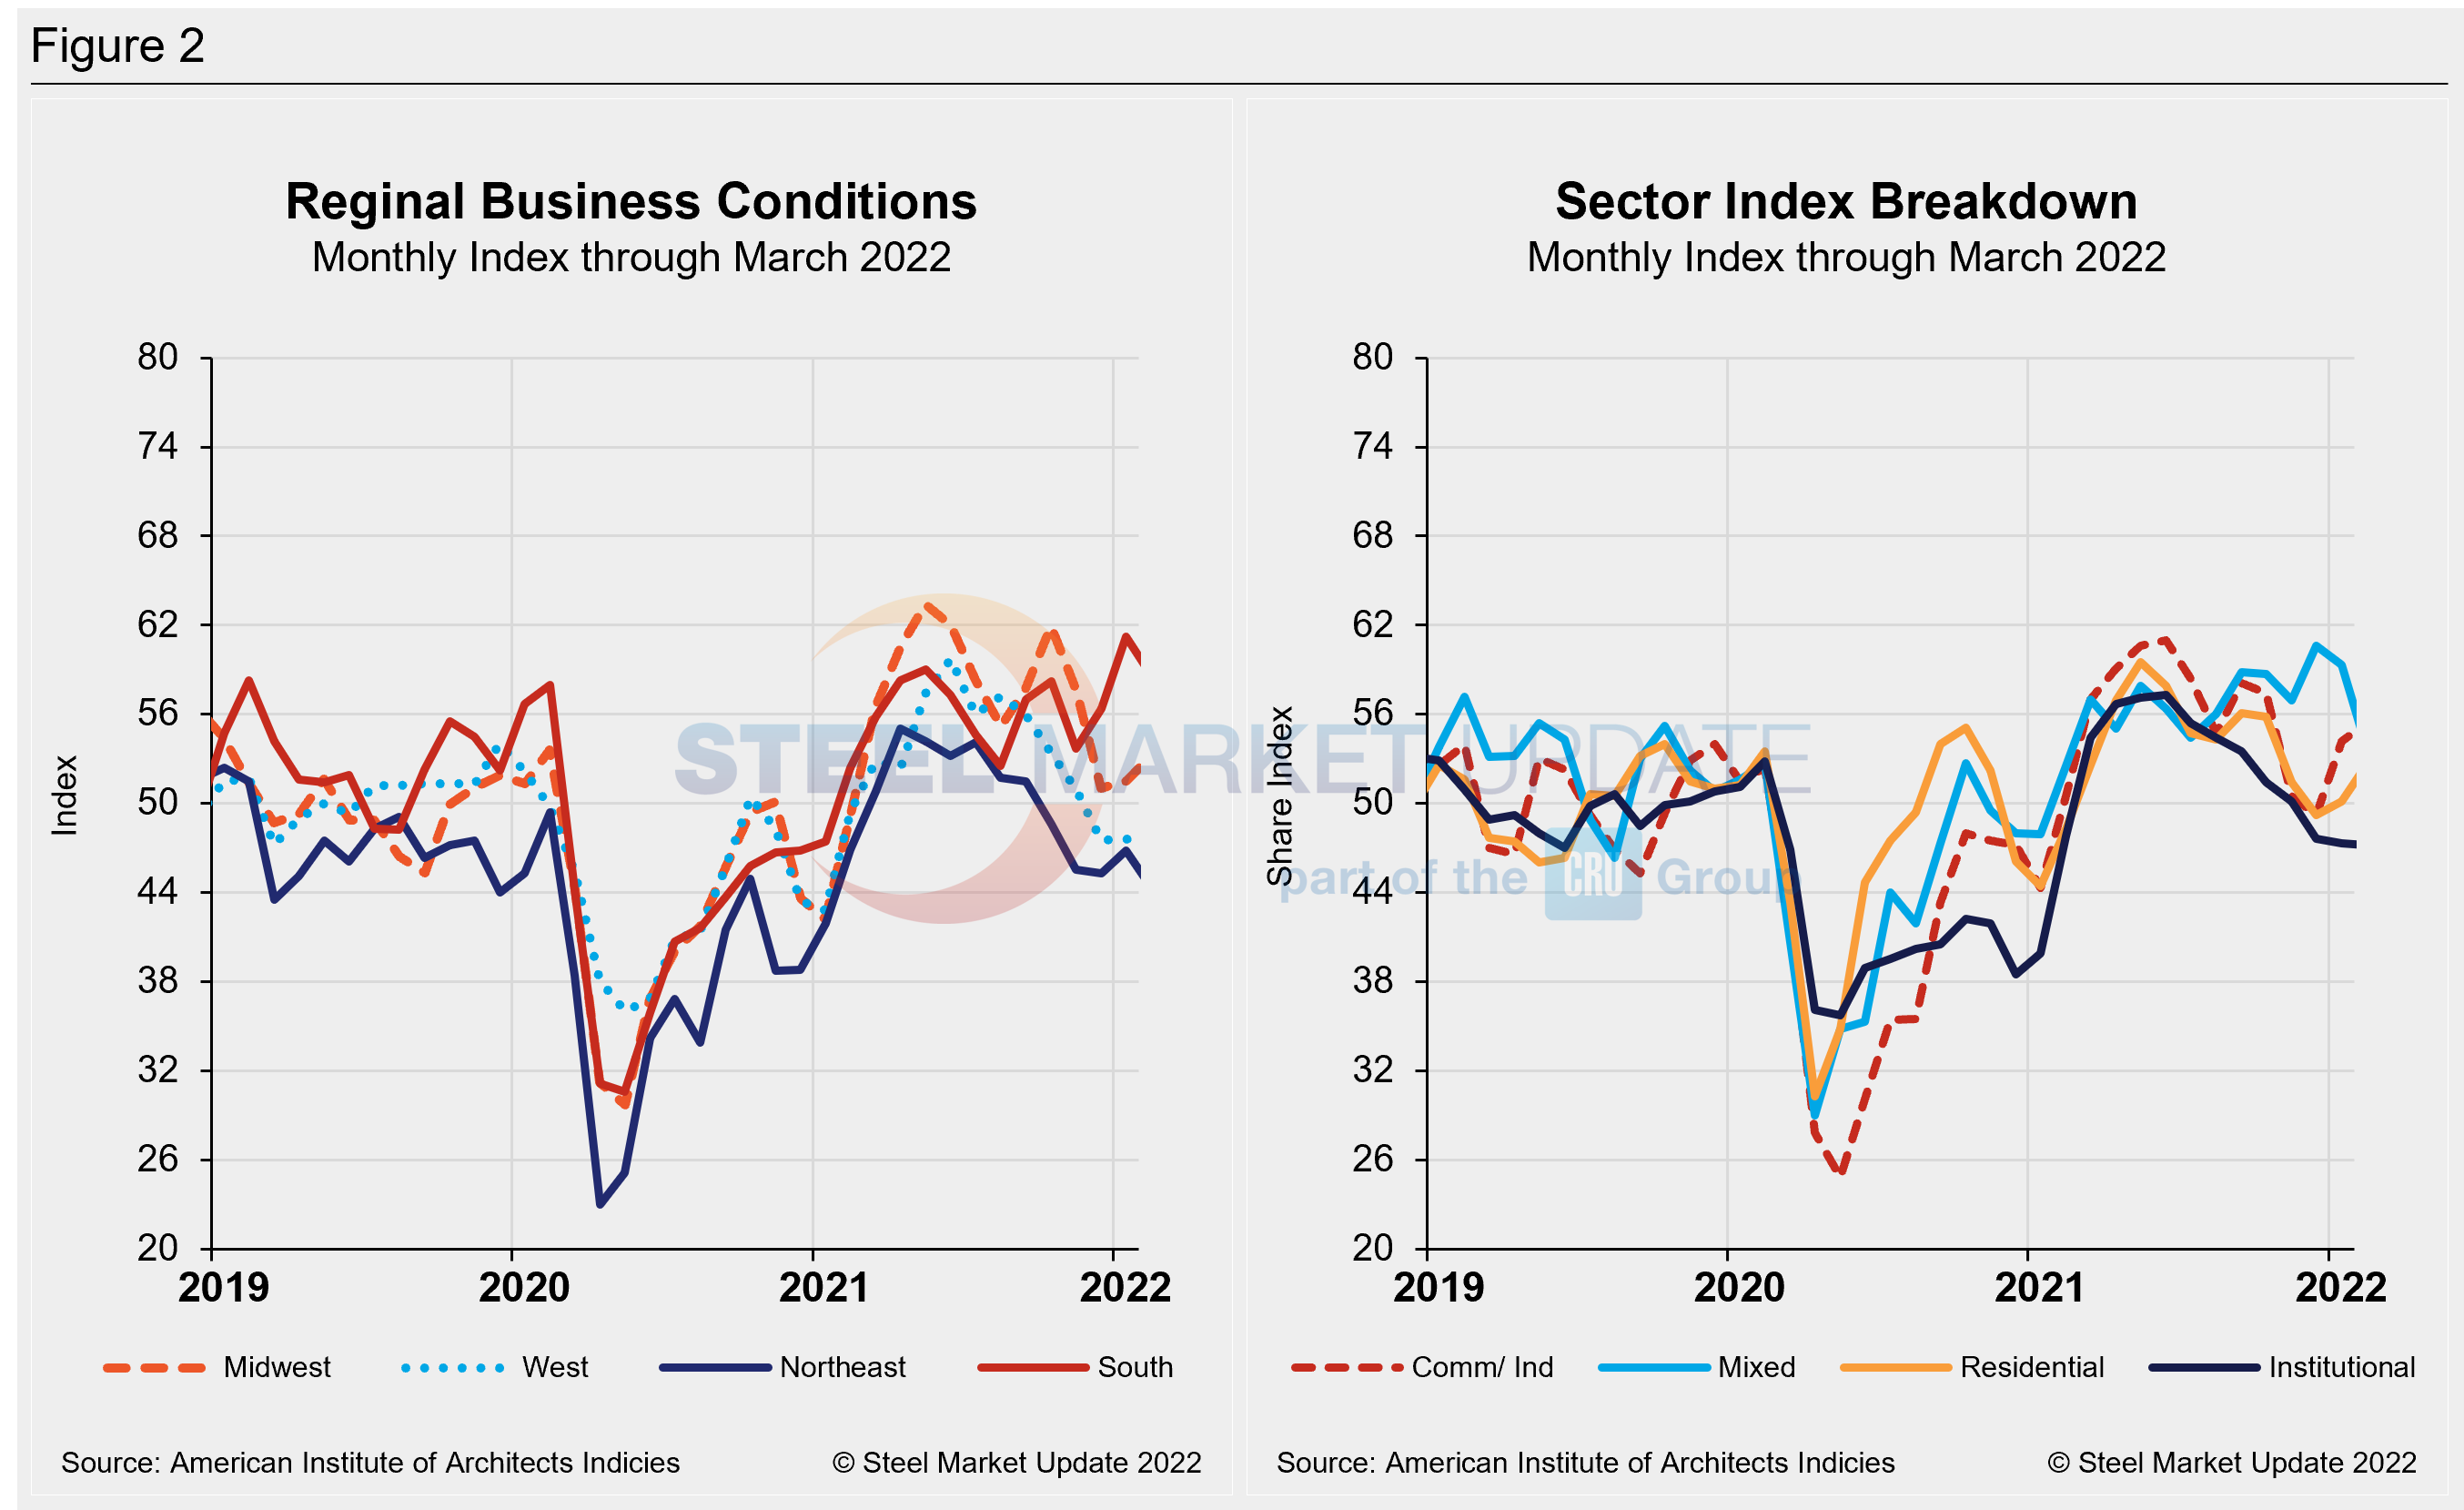
And growth has varied significantly by region. For the seventh straight month, firms in the Northeast continued to report softening billings, while business conditions kept strengthening in the Midwest and West regions. Firms in the South remained at robust levels.
The index for new project inquiries rose by 0.9 points to 63.9, while the new design contracts index expanded from a reading of 55.2 in February to 60.5 last month.
“The spike in firm billings in March may reflect a desire to beat the continued interest rate hikes expected in the coming months,” AIA chief economist Kermit Baker said. “However, since project backlogs at architecture firms have reached seven months, a new all-time high, it appears that firms are having a difficult time keeping up with this uptick in demand for design services.”
Key ABI highlights for March include:
- Regional averages: South (57.2); Midwest (56.2); West (54.0); Northeast (46.3)
- Sector index breakdown: mixed practice (58.2); multi-family residential (57.2); commercial/industrial (55.3); institutional (50.5)
Regional and sector scores are calculated as three-month averages. Below are three charts showing the history of the AIA Architecture Billings Index, Reginal Business Conditions, and Sectors.


An interactive history of the AIA Architecture Billings Index is available on our website. Please contact us at info@SteelMarketUpdate.com if you need assistance logging into or navigating the website.
By David Schollaert, David@SteelMarketUpdate.com


