Prices

April 7, 2022
Hot Rolled Futures: Putin Throws a Monkey Wrench Into the Ferrous Machine
Written by Tim Stevenson
SMU contributor Tim Stevenson is a partner at Metal Edge Partners, a firm engaged in Risk Management and Strategic Advisory. In this role, he and his firm design and execute risk management strategies for clients along with providing process and analytical support. In Tim’s previous role, he was a Director at Cargill Risk Management, and prior to that led the derivative trading efforts within the North American Cargill Metals business. You can learn more about Metal Edge at www.metaledgepartners.com. Tim can be reached at Tim@metaledgepartners.com for queries/comments/questions.
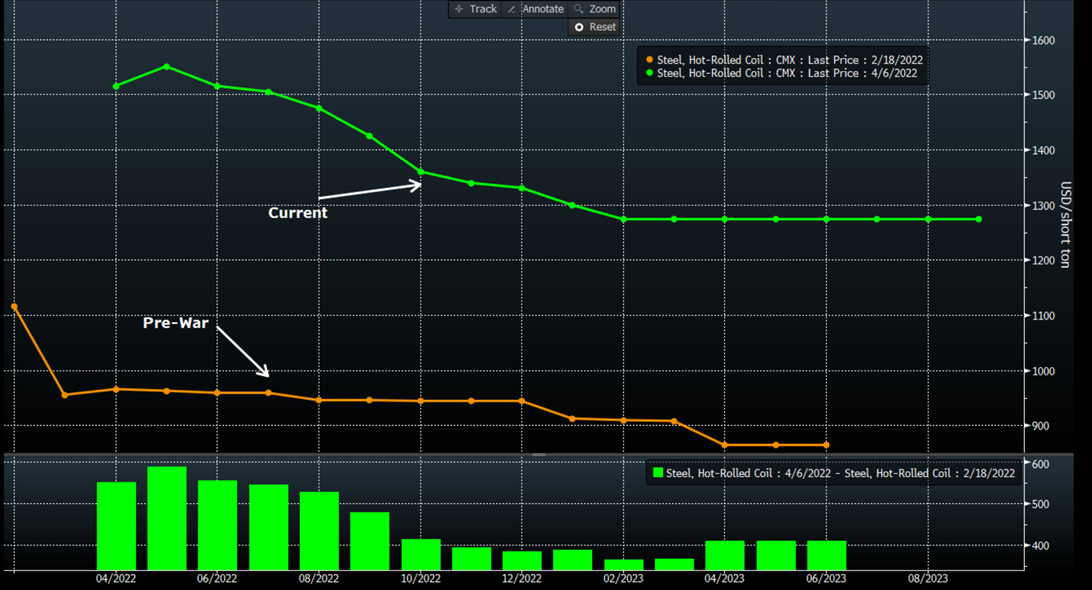
The tragic events in Europe have been horrific to watch, and the loss of life and needless destruction of property have resulted in dramatic changes in many people’s lives, and in commodity markets as well. Commodity prices are set by supply and demand, just like everything else, and the lack of some commodity flows out of Russia and Ukraine have had a profound impact on many markets. We thought we would look at some of the curves from a pre-war and current perspective, and see if we can make any sense out of the movements. The upward surge in the US HRC curve and spot prices on physical steel has been remarkable. As the world tried to calibrate just how important exports of semi-finished and finished steel were from those two countries, the forward curve lurched higher. Putin, in a sense, threw a “monkey wrench” into the global ferrous supply chain, and the US was not immune to this.

Given the lack of exports from those countries, it’s maybe not too much of a surprise to see a massive price rise. Perhaps the more interesting chart would be one of “open interest”. On the CME website, open interest is defined as “the total number of futures contracts held by market participants at the end of the trading day. It is used as an indicator to determine market sentiment and the strength behind price trends.” Looking at the open interest in the HRC contract, you can see a large drop in the most current reading vs before the conflict:

Since this happened during a period of rapidly increasing prices, this would indicate a “short squeeze”, where some participants in the market have covered short positions and are not initiating new trades in the market. This could mean that some of the trades we saw at very high prices were driven by fear rather than by fundamentals. And more recently the curve has pulled back a bit from the peak.
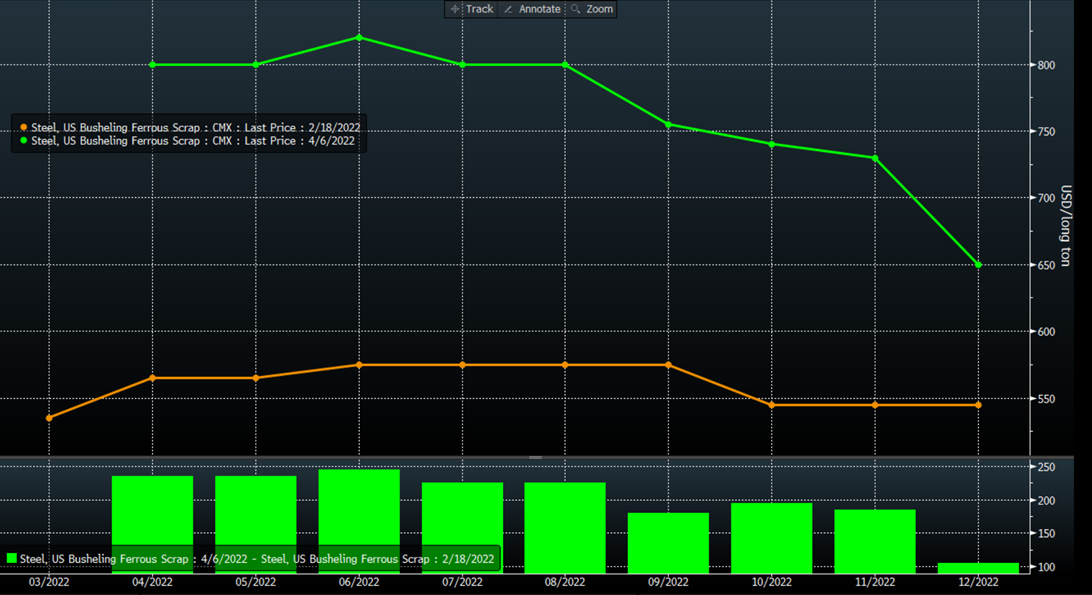
Something similar happened to the busheling curve. This also makes sense – no pig iron from Ukraine/Russia means more scrap demand here in the US. The chart below shows the pre-war curve vs the current level (green).

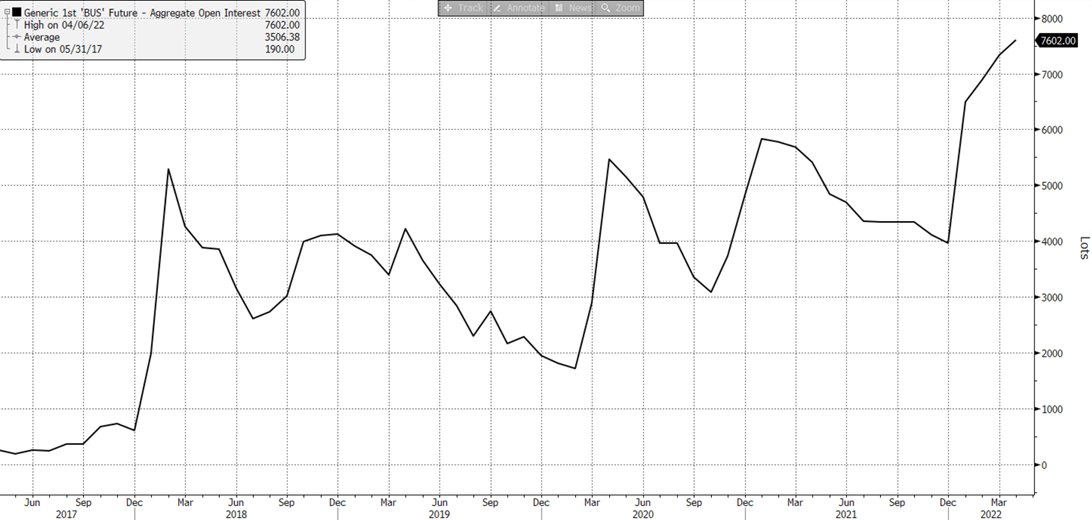
The open interest chart, however, is diametrically opposed to HRC. We’ve seen a decent increase in open interest in scrap, which according to some traders indicates that the move higher may have more validity vs a move up with lower open interest. Something to think about.

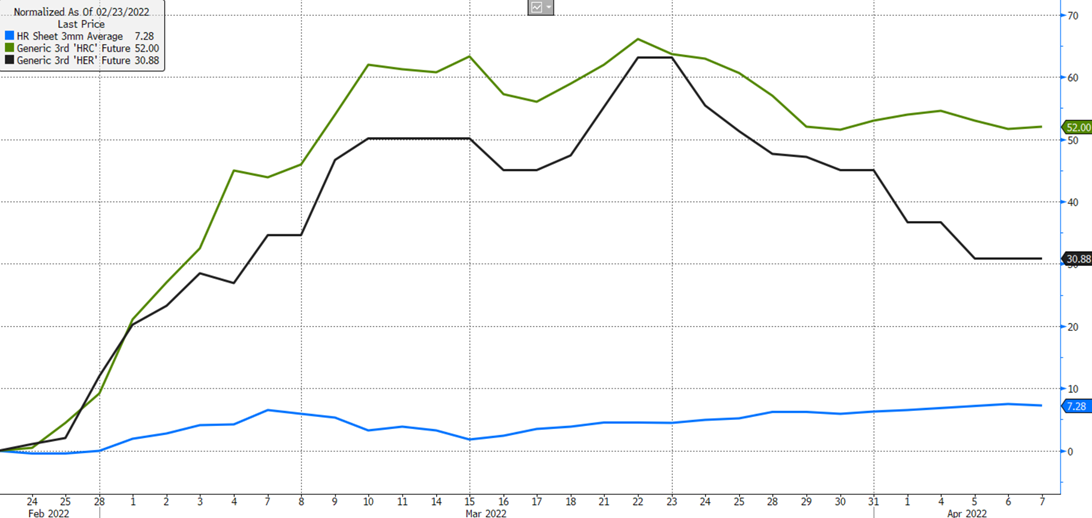
Below is one other chart we found interesting. This is the percentage price change in Chinese spot HRC prices (in blue), the 3 month forward future in the US (HRC – the green line), and the 3 month forward contract for European HRC (HER – the black line). The chart starts the day before the invasion.

To us, the fact that Chinese prices haven’t moved nearly as much as those in the US and Europe isn’t too surprising. Many people believe that the raw materials that Russia can no longer sell the Western world will flow to China, and we’ve recently heard that this has started. Thus, the supply demand picture for some commodities may have actually improved for China due to the conflict. To us, the surprising conclusion from this chart is that US prices on the forward curve have gone up more than in Europe! Why would that be? Europe is at the heart of the supply chain issues due to the conflict. Why would US prices go up more? We don’t know, but maybe the futures market is thinking that a recession in Europe may develop more quickly than in the US. The recent release of factory orders in Germany was a bit ominous. The data missed expectations by a decent margin. And it was from February, so largely before the conflict started.
All that said – I’ll close with some comments on the recent volatility we’ve seen. Many participants in the market ask what the next “black swan” event will be. The thing about black swan events is that by their very nature they are unpredictable. And it seems that over the past 3-4 years we’ve had so many black swans, that we’ve just started calling them swans. They seem to like to fly over us and release their droppings all over our plans. Thus, planning is tough in this world. Whether it’s black swans, swans, or monkey wrenches, things are unpredictable, and the use of futures to manage risk is a more powerful tool than ever. Thanks for reading!
Disclaimer: The information in this write-up does not constitute “investment service”, “investment advice”, or “financial product advice” as defined by laws and/or regulations in any jurisdiction. Neither does it constitute nor should be considered as any form of financial opinion or recommendation. The views expressed in the above article by Metal Edge Partners are subject to change based on market and other conditions. The information given above must be independently verified and Metal Edge Partners does not assume responsibility for the accuracy of the information.


