

Market Data

March 7, 2022
Steel Product Shipments and Inventories through January
Written by David Schollaert
Steel Market Update is pleased to share this Premium content with Executive members. For information on upgrading to a Premium-level subscription, email Info@SteelMarketUpdate.com.
The value of U.S. steel product shipments was virtually unchanged in January at $12.320 billion or 0.1% above December’s total. Though negligible, the increase follows declines over the prior two months after reaching $12.483 billion last October, according to Census Bureau data.
January’s rate was nearly 22% higher than the same year-ago total, and still 60% above the pandemic-era low of $7.716 billion seen in May 2020 when poor demand from COVID-19 shutdowns had hot rolled coil prices averaging $460 per ton, according to SMU ’s check of the market on April 28, 2020.
New orders for steel production were up 2.2% in January to $12.432 billion, outpacing shipments for the first time since last July. This shift suggests a slight pick-up in demand at the start of the year.
Manufacturing inventories saw an improved rate of rise in January following a slowdown at the end of the fourth quarter, according to the latest available Census Bureau data on inventories, shipments, and new orders for total U.S. manufacturing and steel products.
Total manufacturing inventories rose 1.2% in January – maintaining an 11 consecutive month run – and 10.8% above January 2021. Steel product inventories have seen a stronger growth rate over the same period. January’s total is up just 1.5% from the month prior, but up 24.8% and 20.6% versus the same 2021 and 2020 period, respectively.
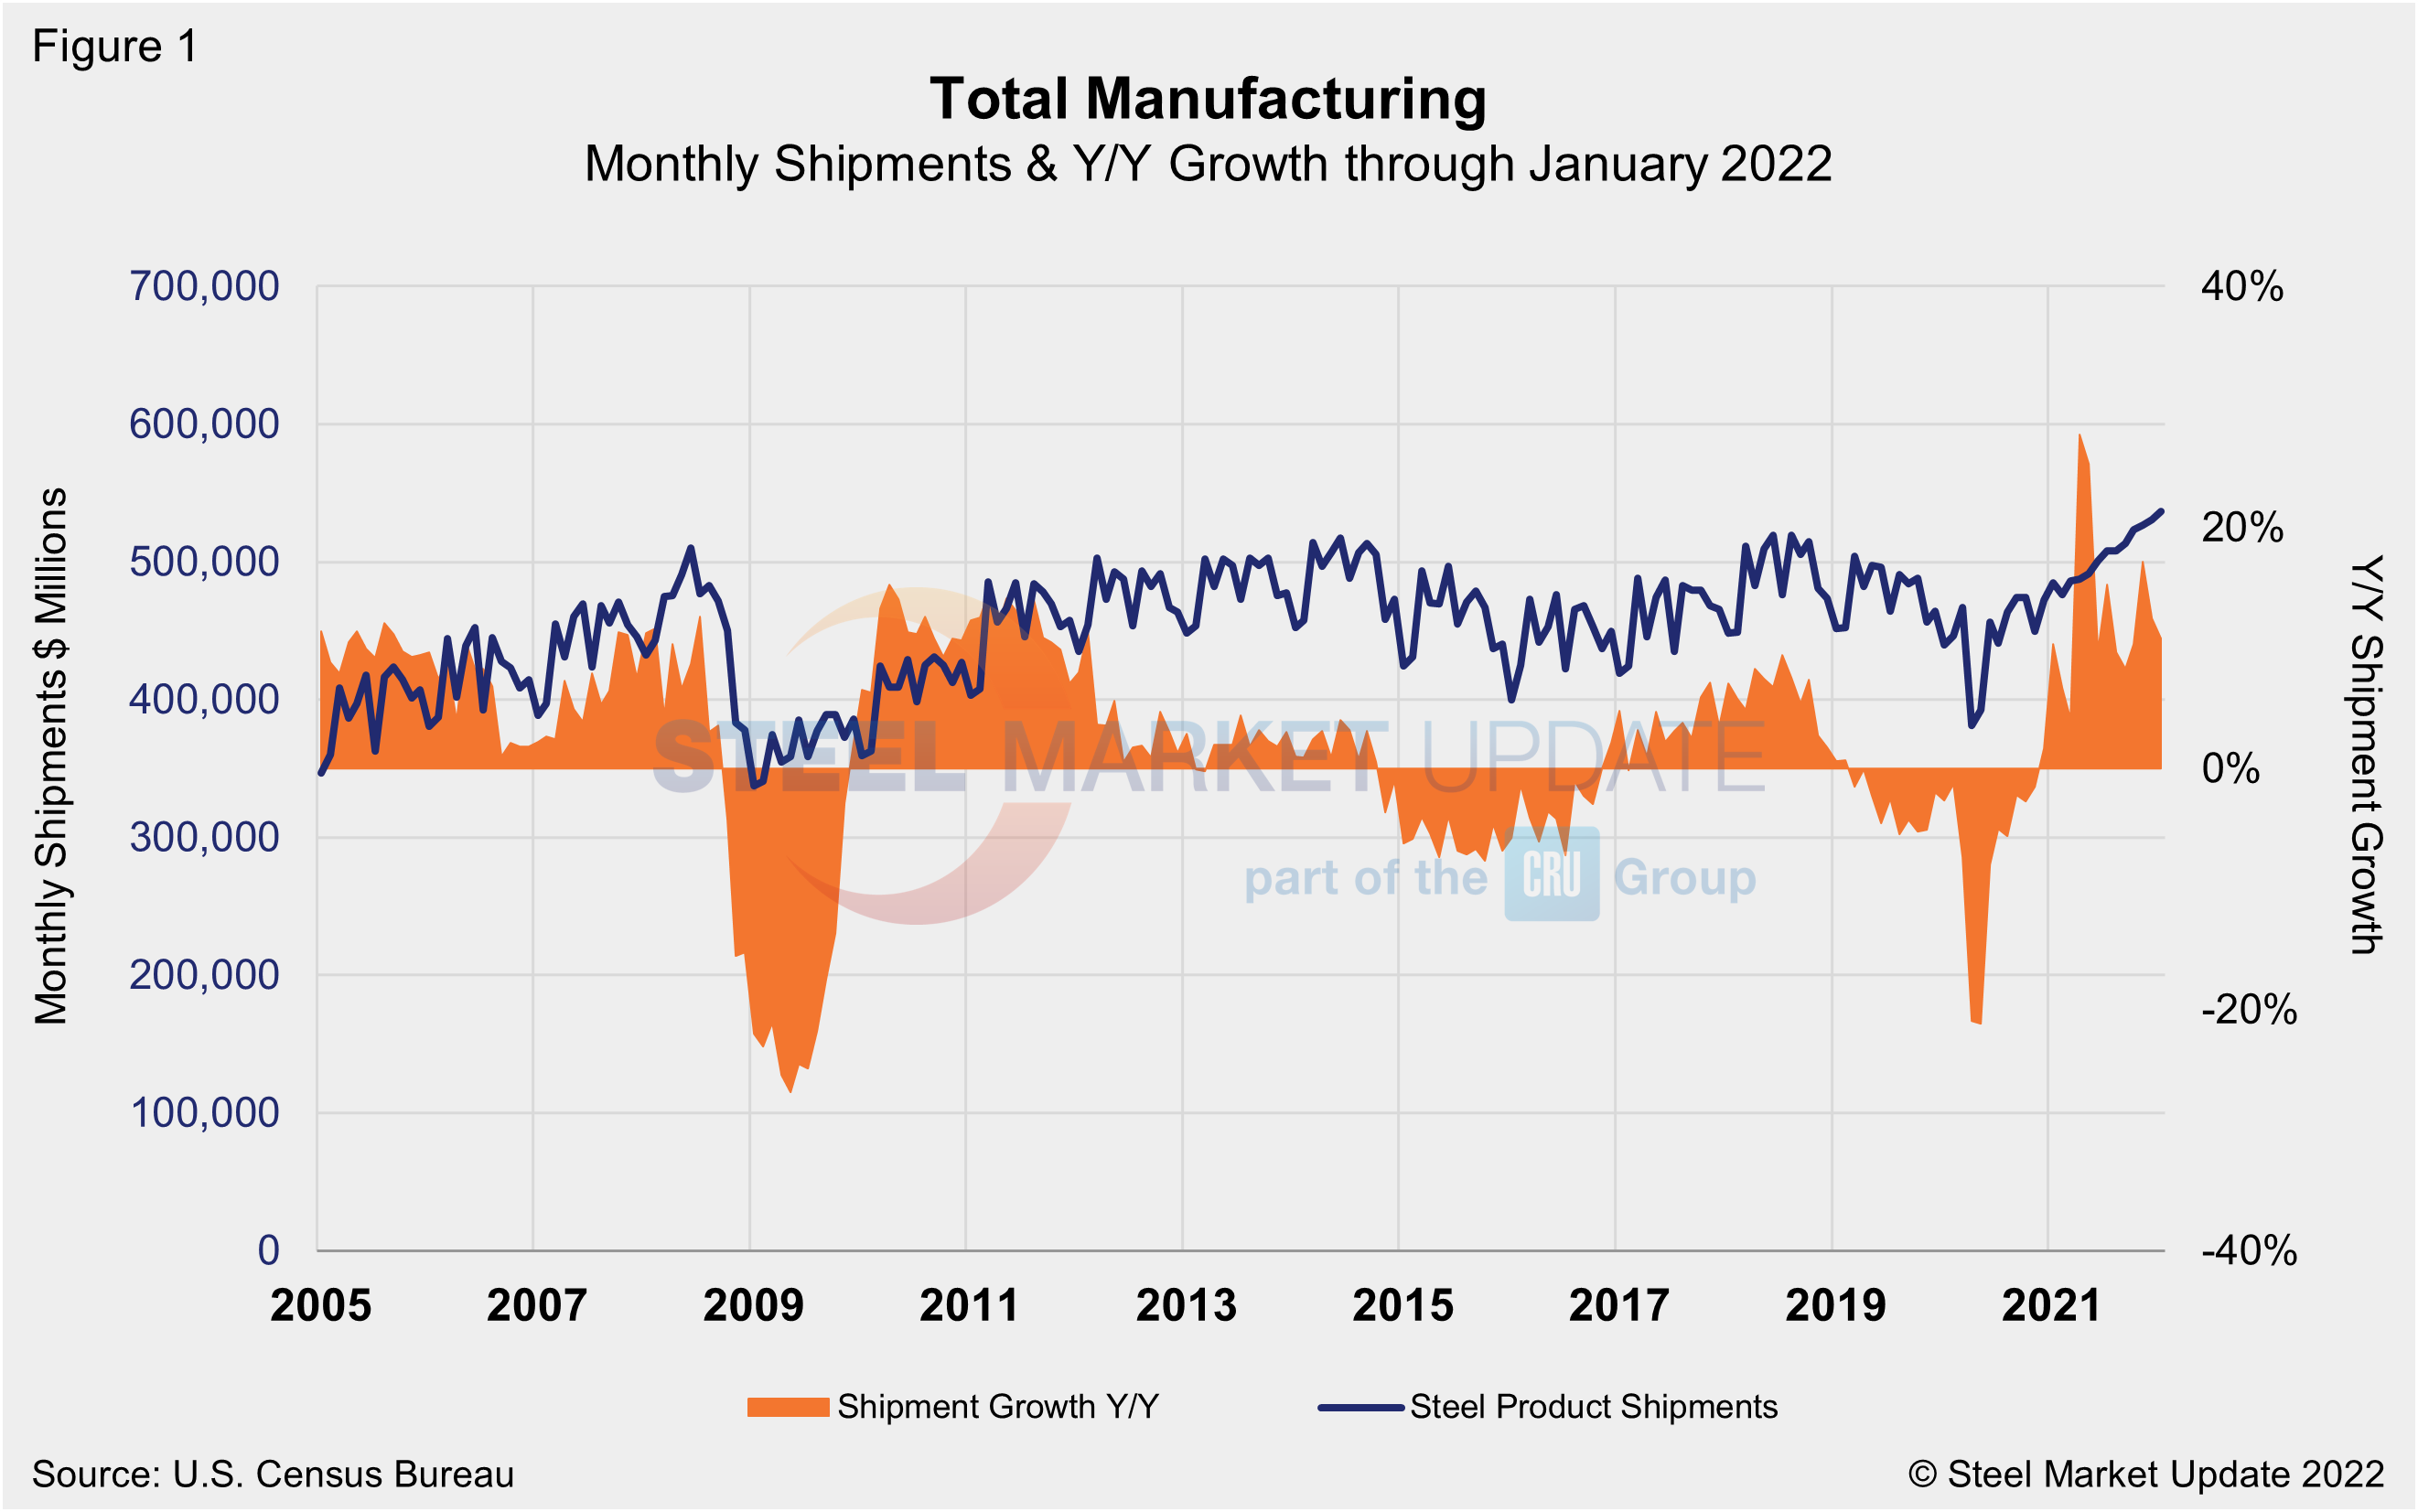
Total shipments and inventories are reported in millions of dollars, seasonally adjusted. Total steel shipments in January were 21.7% higher than in the same year-ago period and 59.7% above the same pre-pandemic period in 2019. Year over year through January, total manufactured product shipments rose by 10.2% and were up 19.0% when compared to the same 2019 period.
During the first wave of the global pandemic in April 2020, total manufacturing shipments plunged by 19.4% and steel product shipments fell by 21.4% compared with the prior year. Both have recovered since. Figure 1 and Figure 2 show the history of both since 2005.
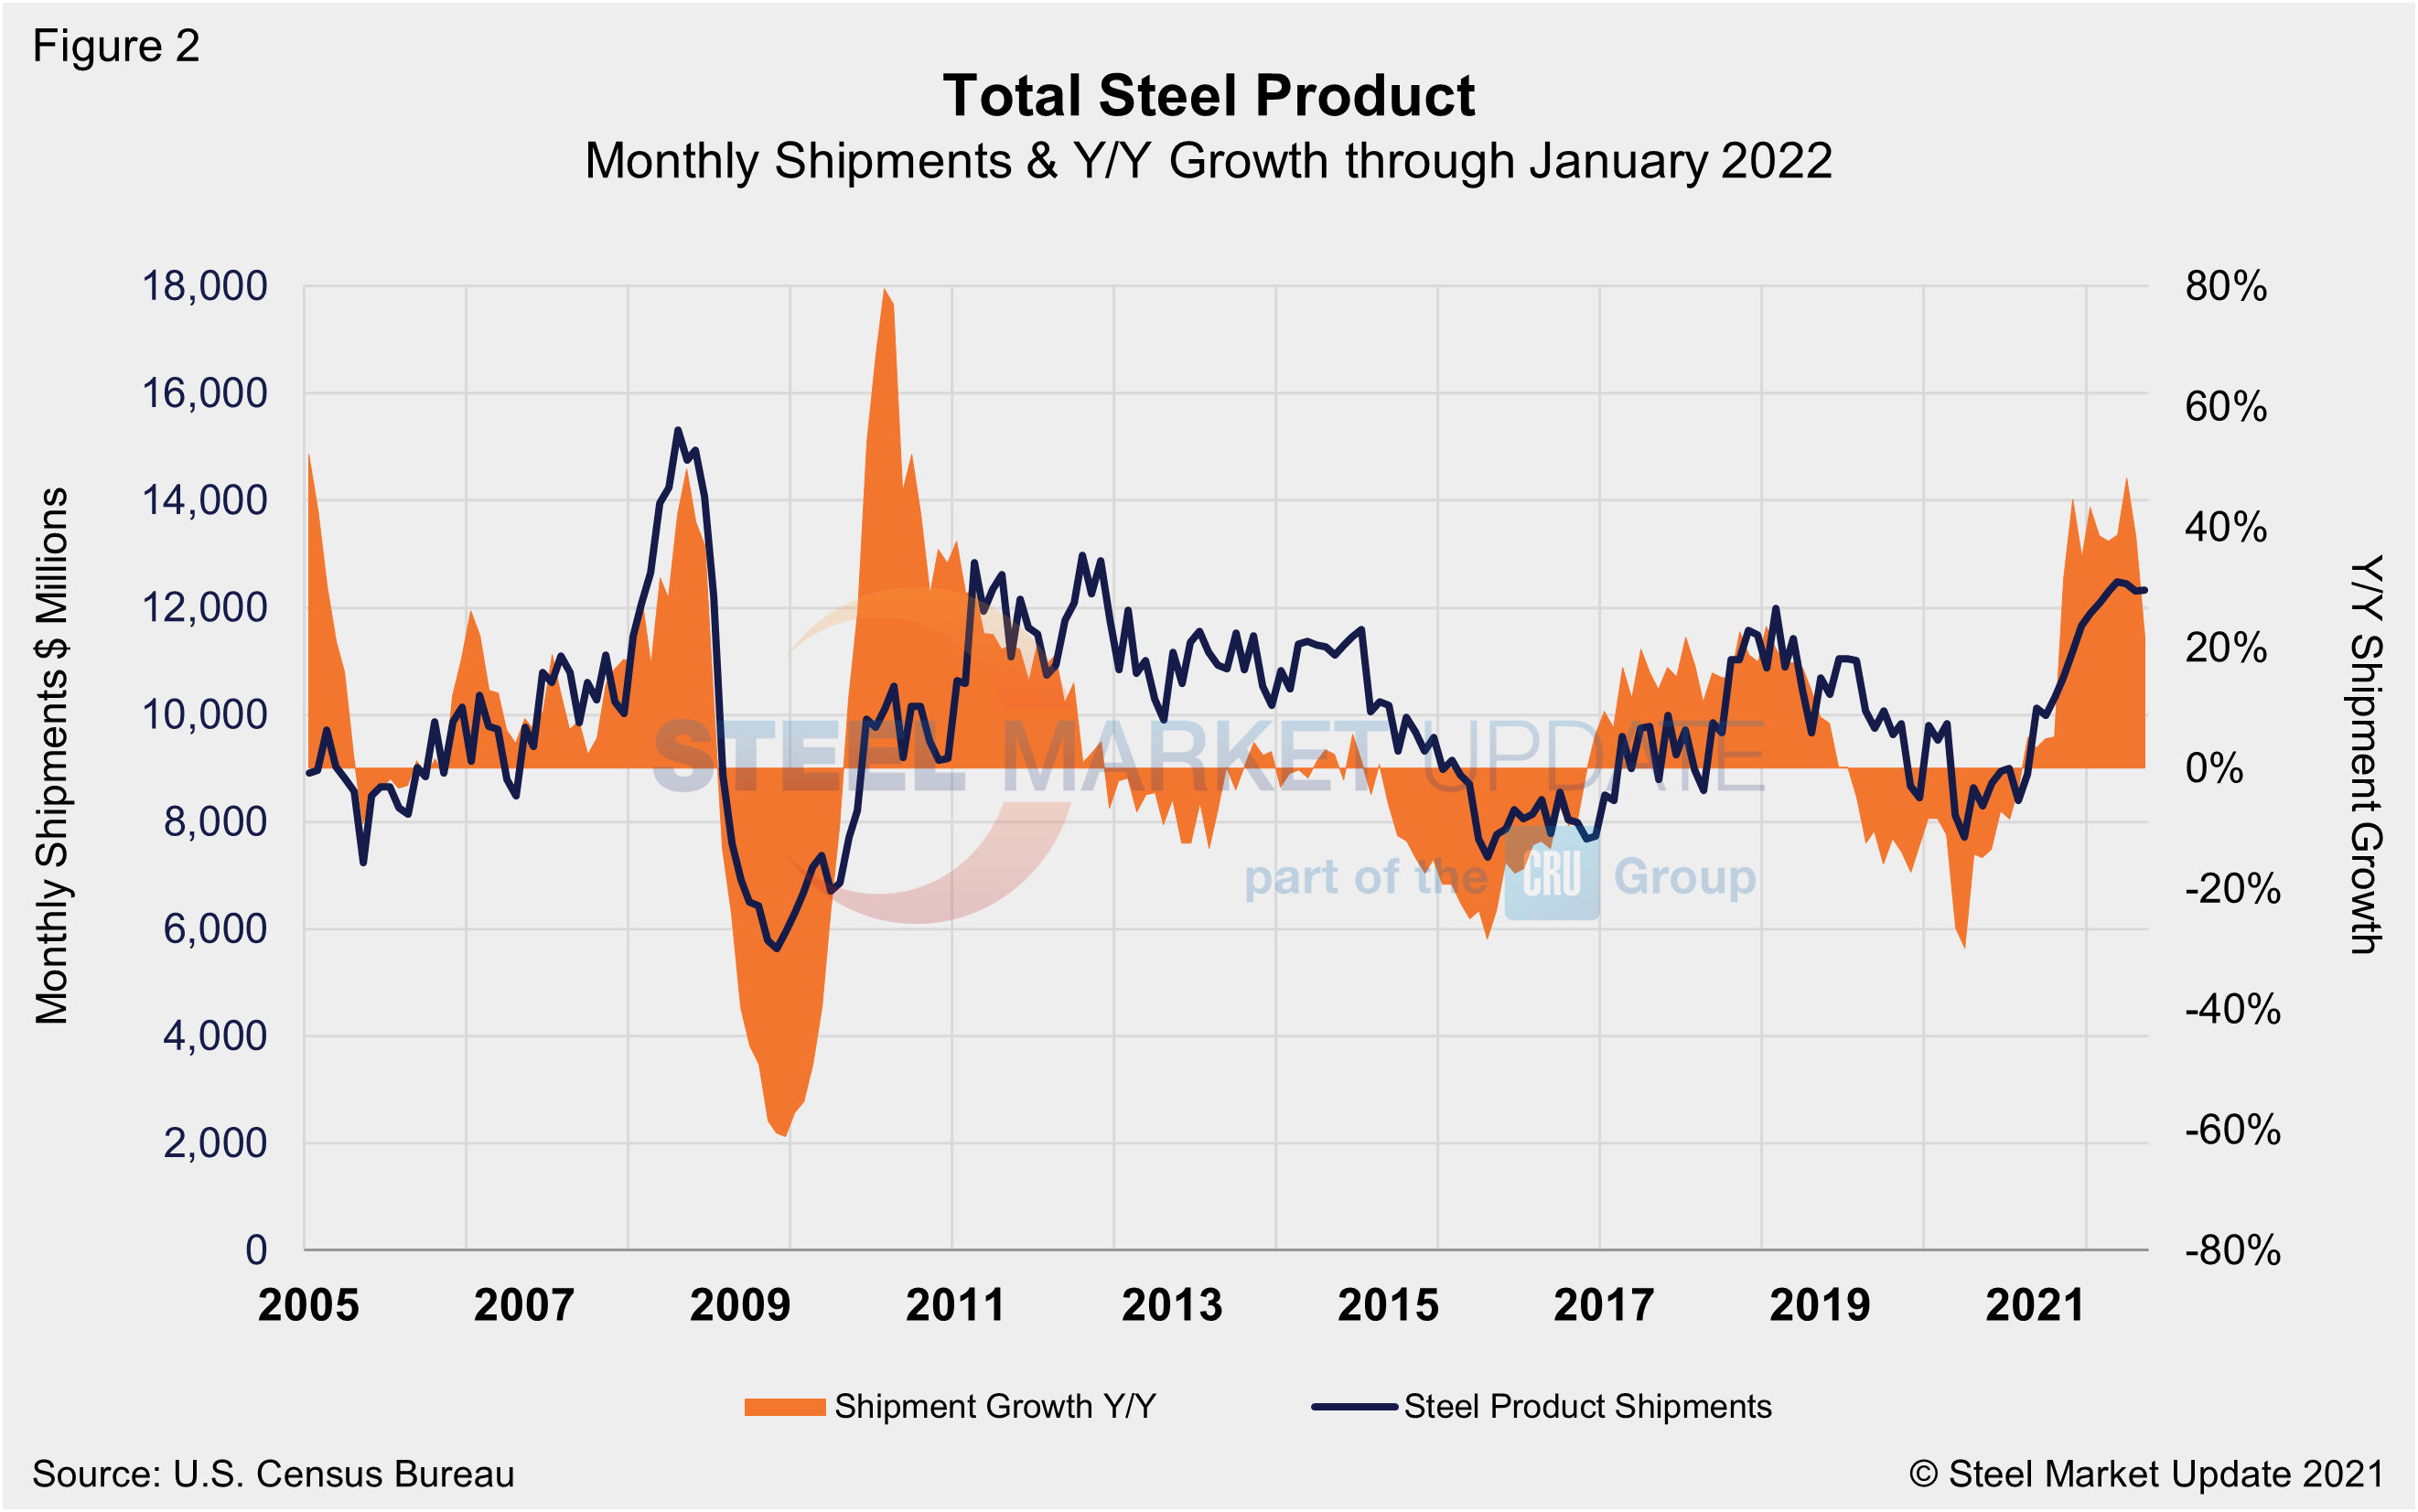
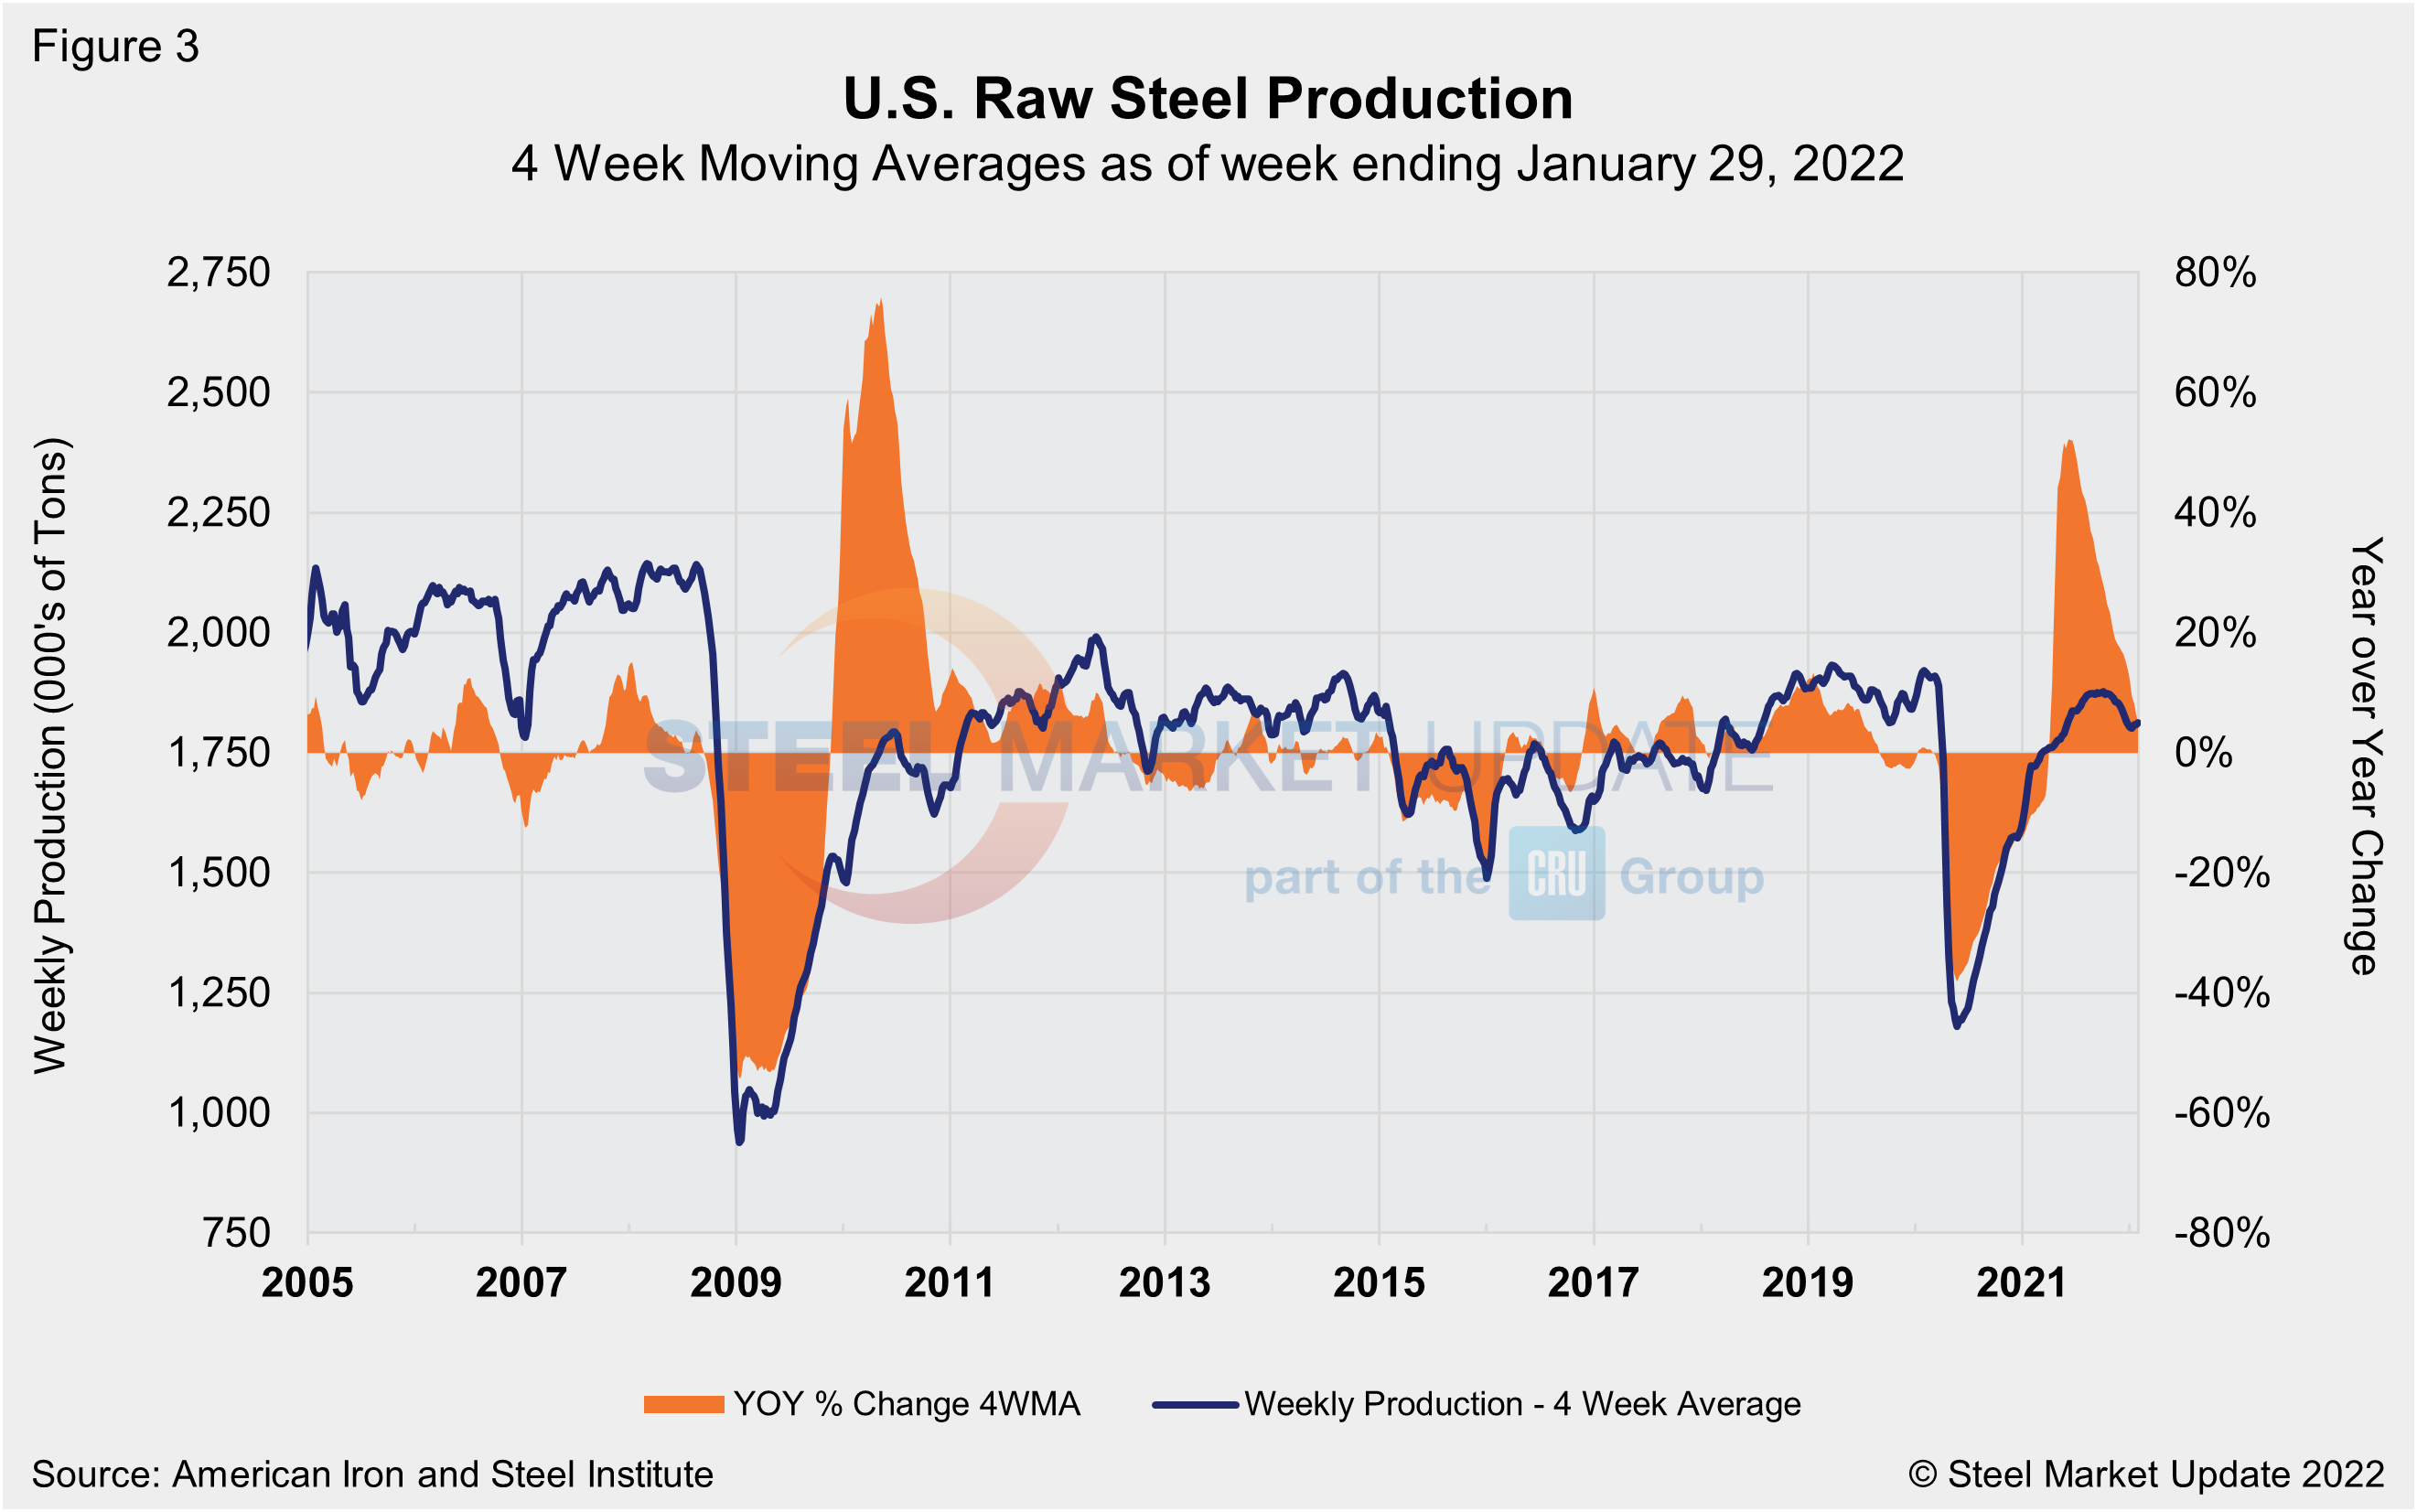
The Census data in Figure 2 compares well over the long term with the American Iron and Steel Institute (AISI) weekly crude steel production shown in Figure 3. Figure 2 is in dollars and Figure 3 is in tons, but they paint a similar picture. Steel production has rebounded since the freefall seen during the first wave of the pandemic, according to AISI data shown on a four-week moving average basis. Crude steel production was up 4.6%% in the week ending Jan. 29 compared to the same period a year ago.
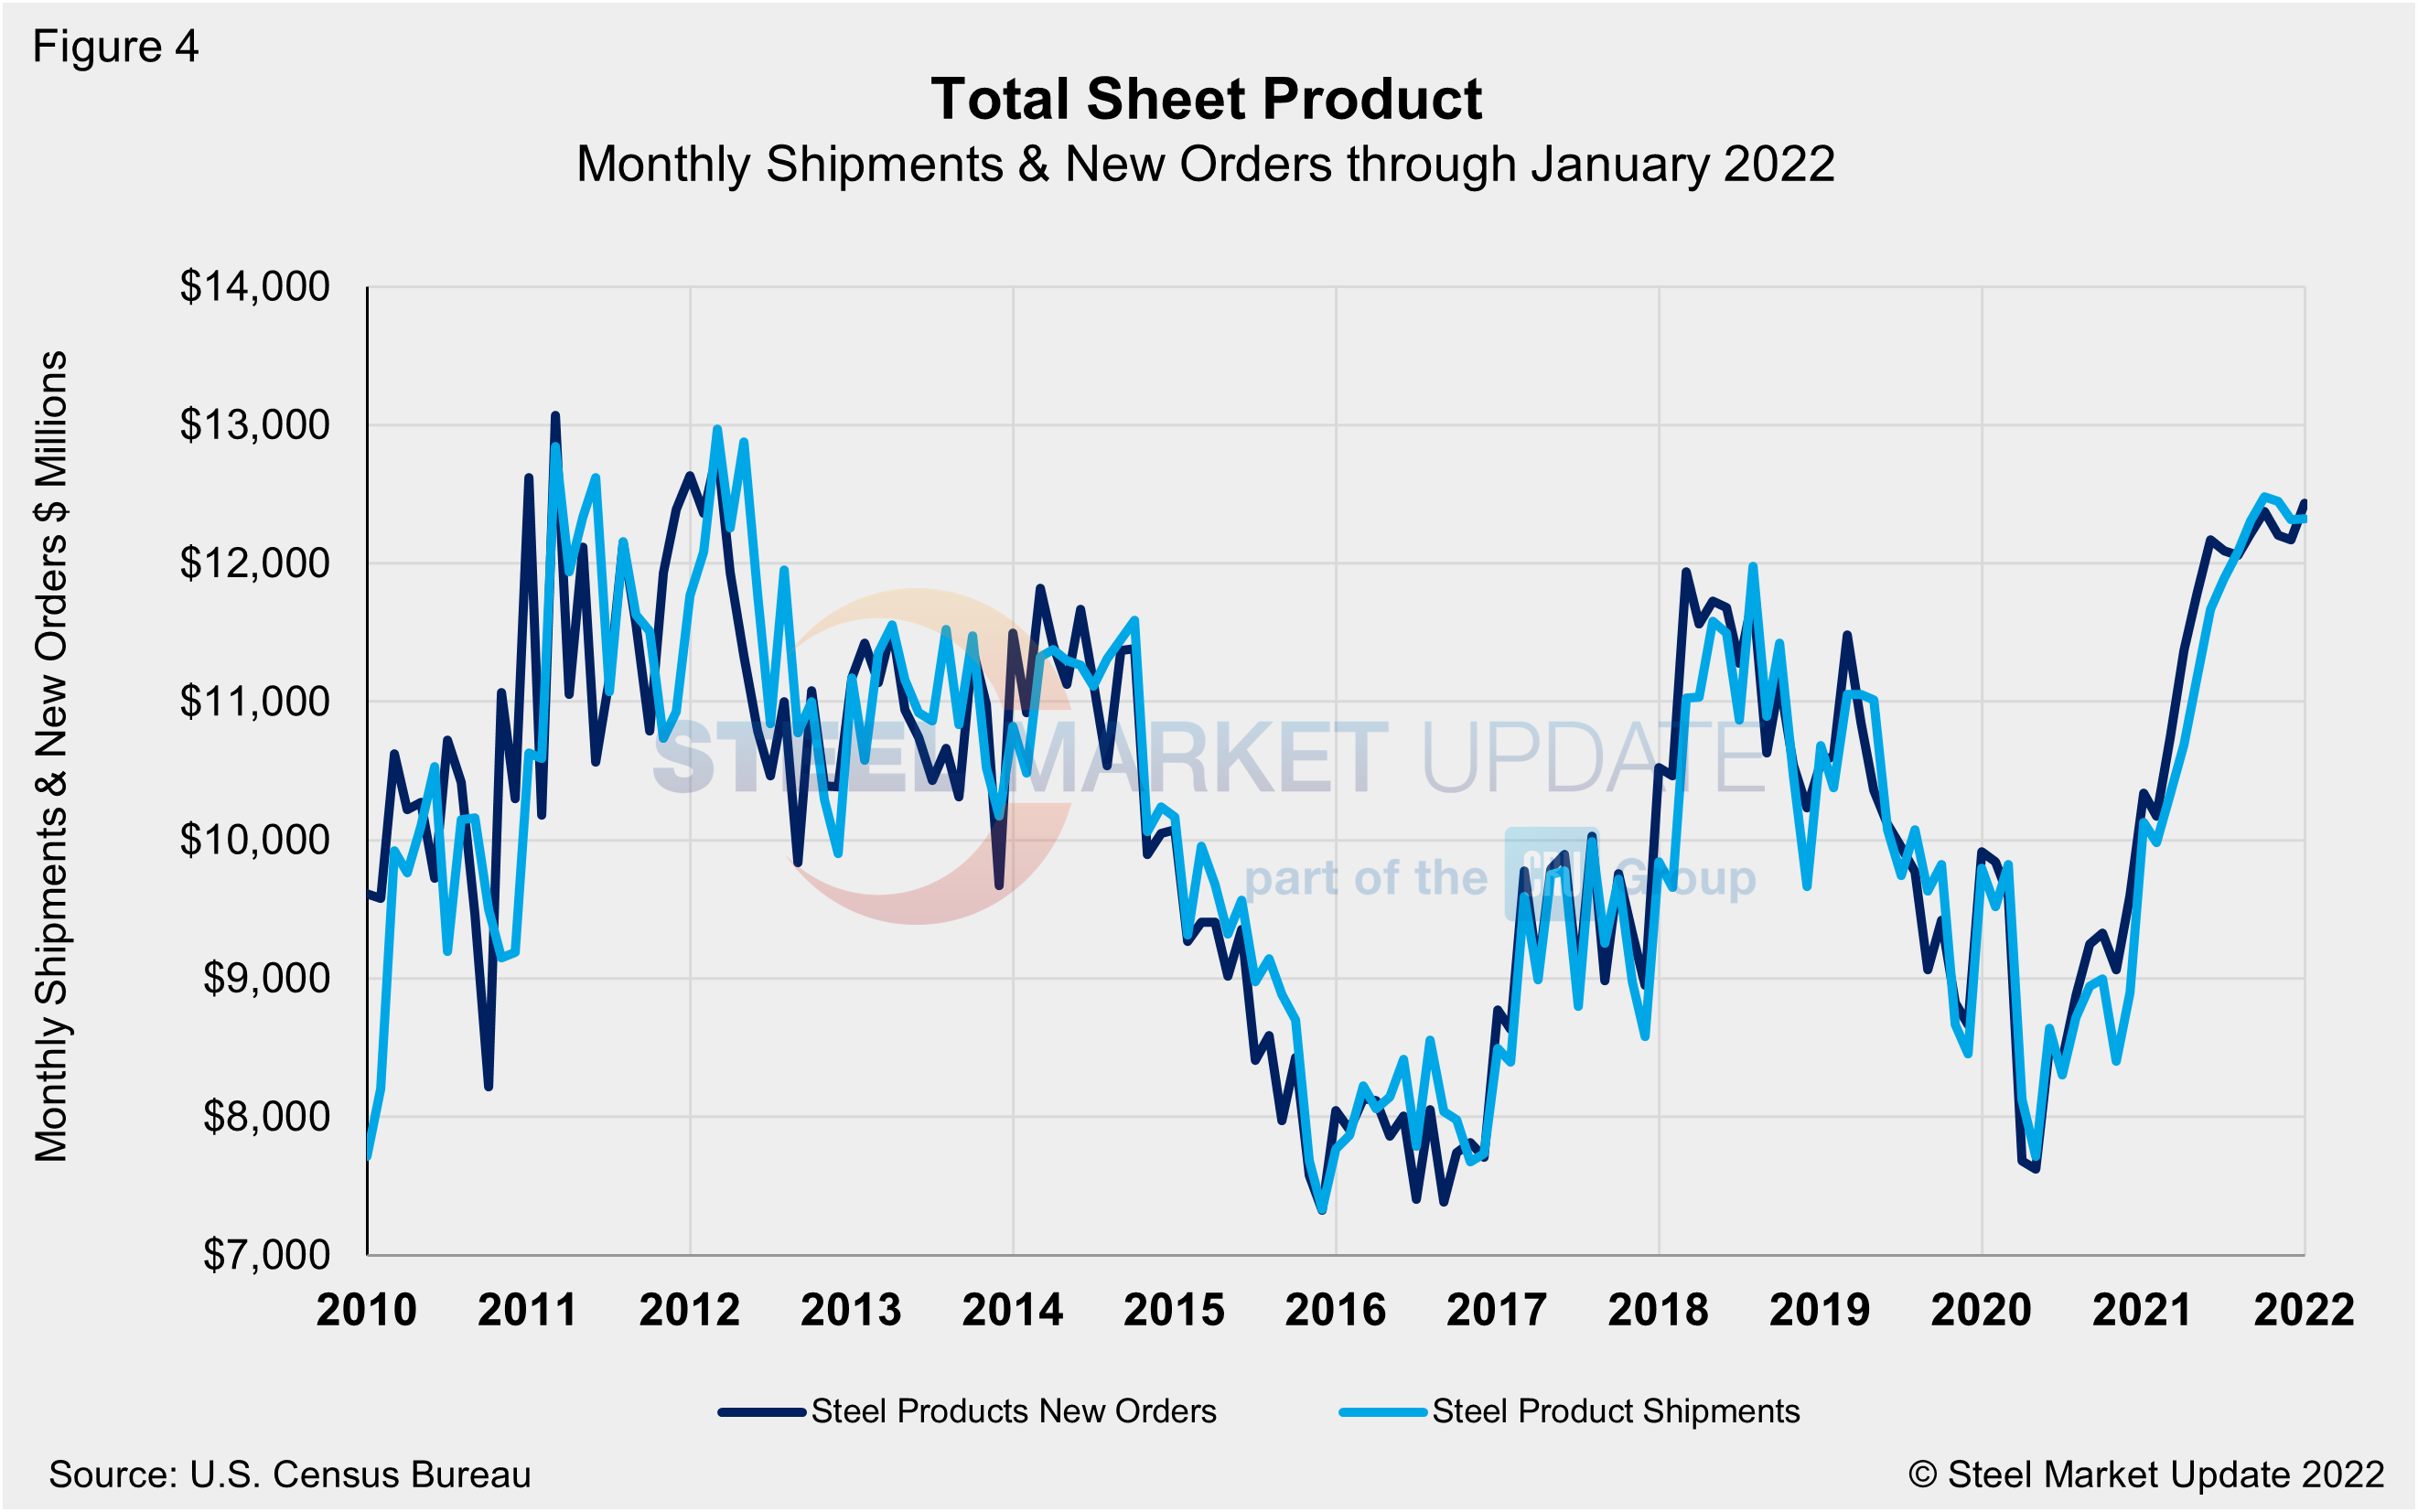
Steel product shipments and new orders monthly since 2010 are shown in Figure 4. New orders and shipments saw similar declines in April 2020 but were back in balance by June. Since then, despite a slight reversal midway through the fourth quarter, new orders have exceeded shipments and continued to steadily outpace them. New orders totaled $112 million more than shipments in January despite a steady decline in steel prices. The trend correlates well with leaner inventories and declining lead times.
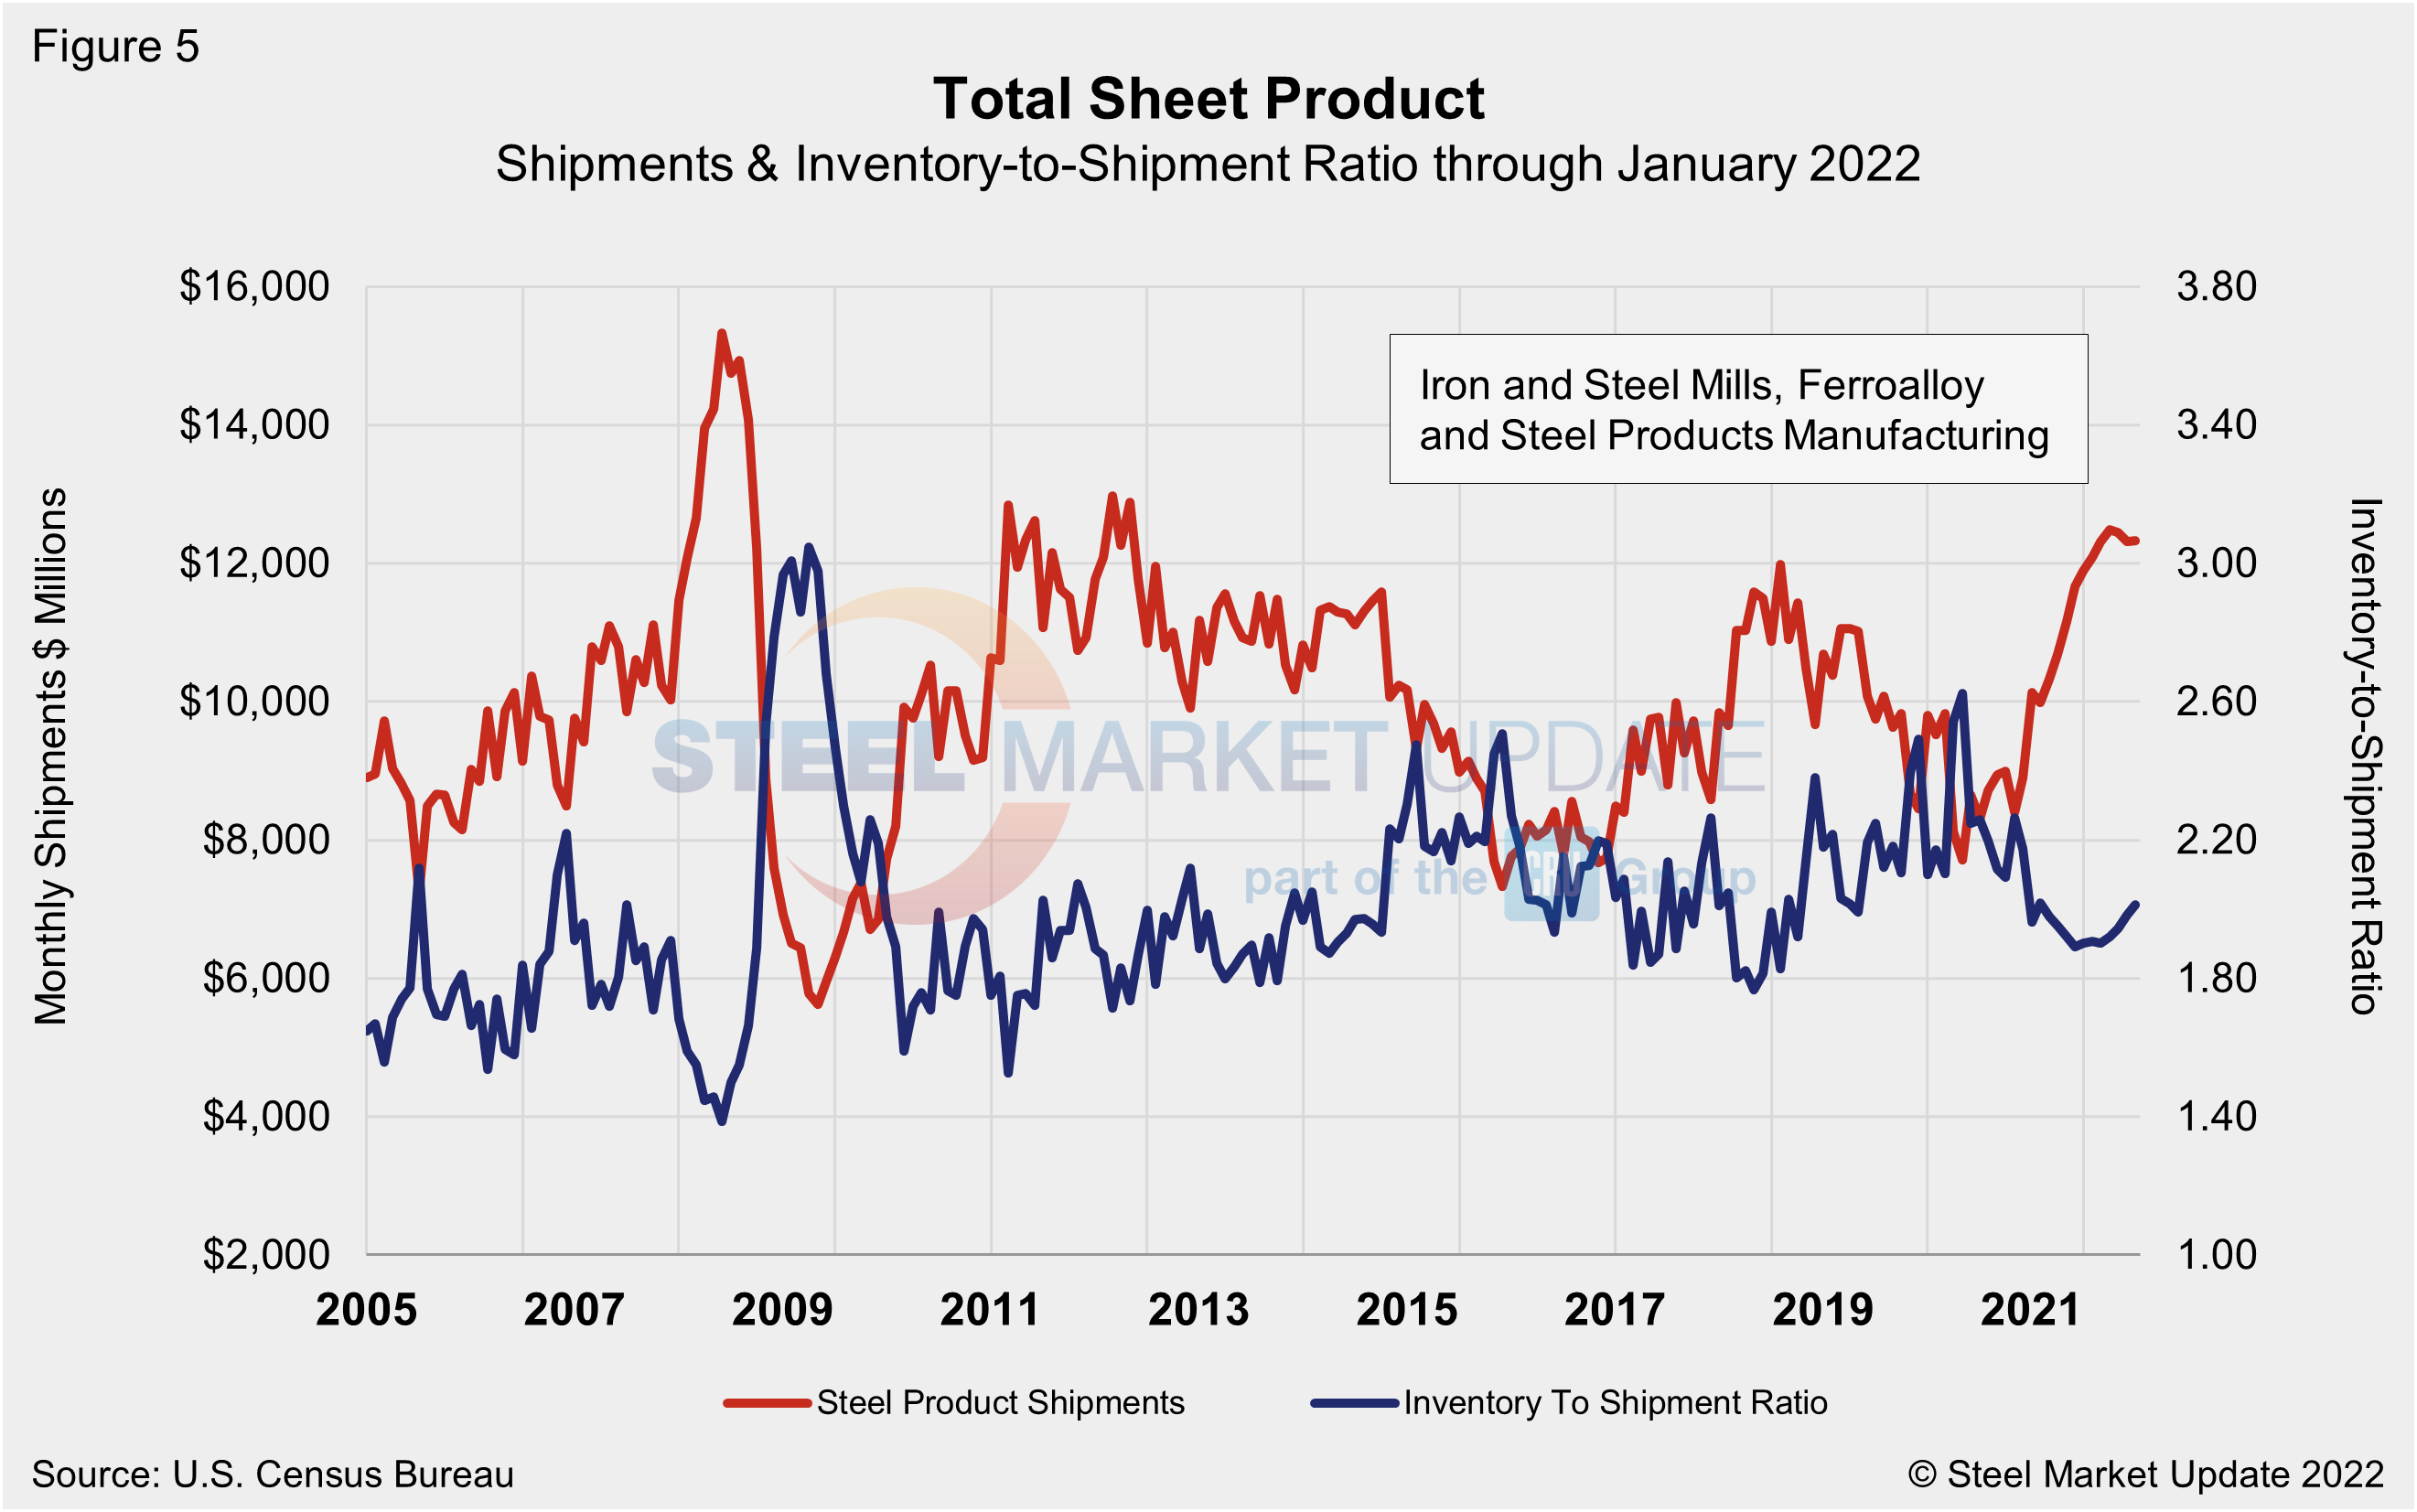
The same total shipment line as in Figure 2 is shown below in Figure 5, but now includes the inventory-to-shipment (IS) ratio. The IS ratio is a measure of how much inventory is necessary to support the level of shipments. Thus, the lower the IS ratio, the better. The IS ratio for steel products shot up in May 2020 to 2.62% as shipments declined due to supply-chain disruptions from COVID-19-related closures. At the peak of steel demand and prices, the ratio slipped to 1.89% in June 2021. Now, nearly approaching the two-year mark since the onset of the pandemic, the IS ratio has inched up to 2.01% and repeatedly expanded since October. The dynamic points to higher inventories as demand cooled, no longer outpacing supply.
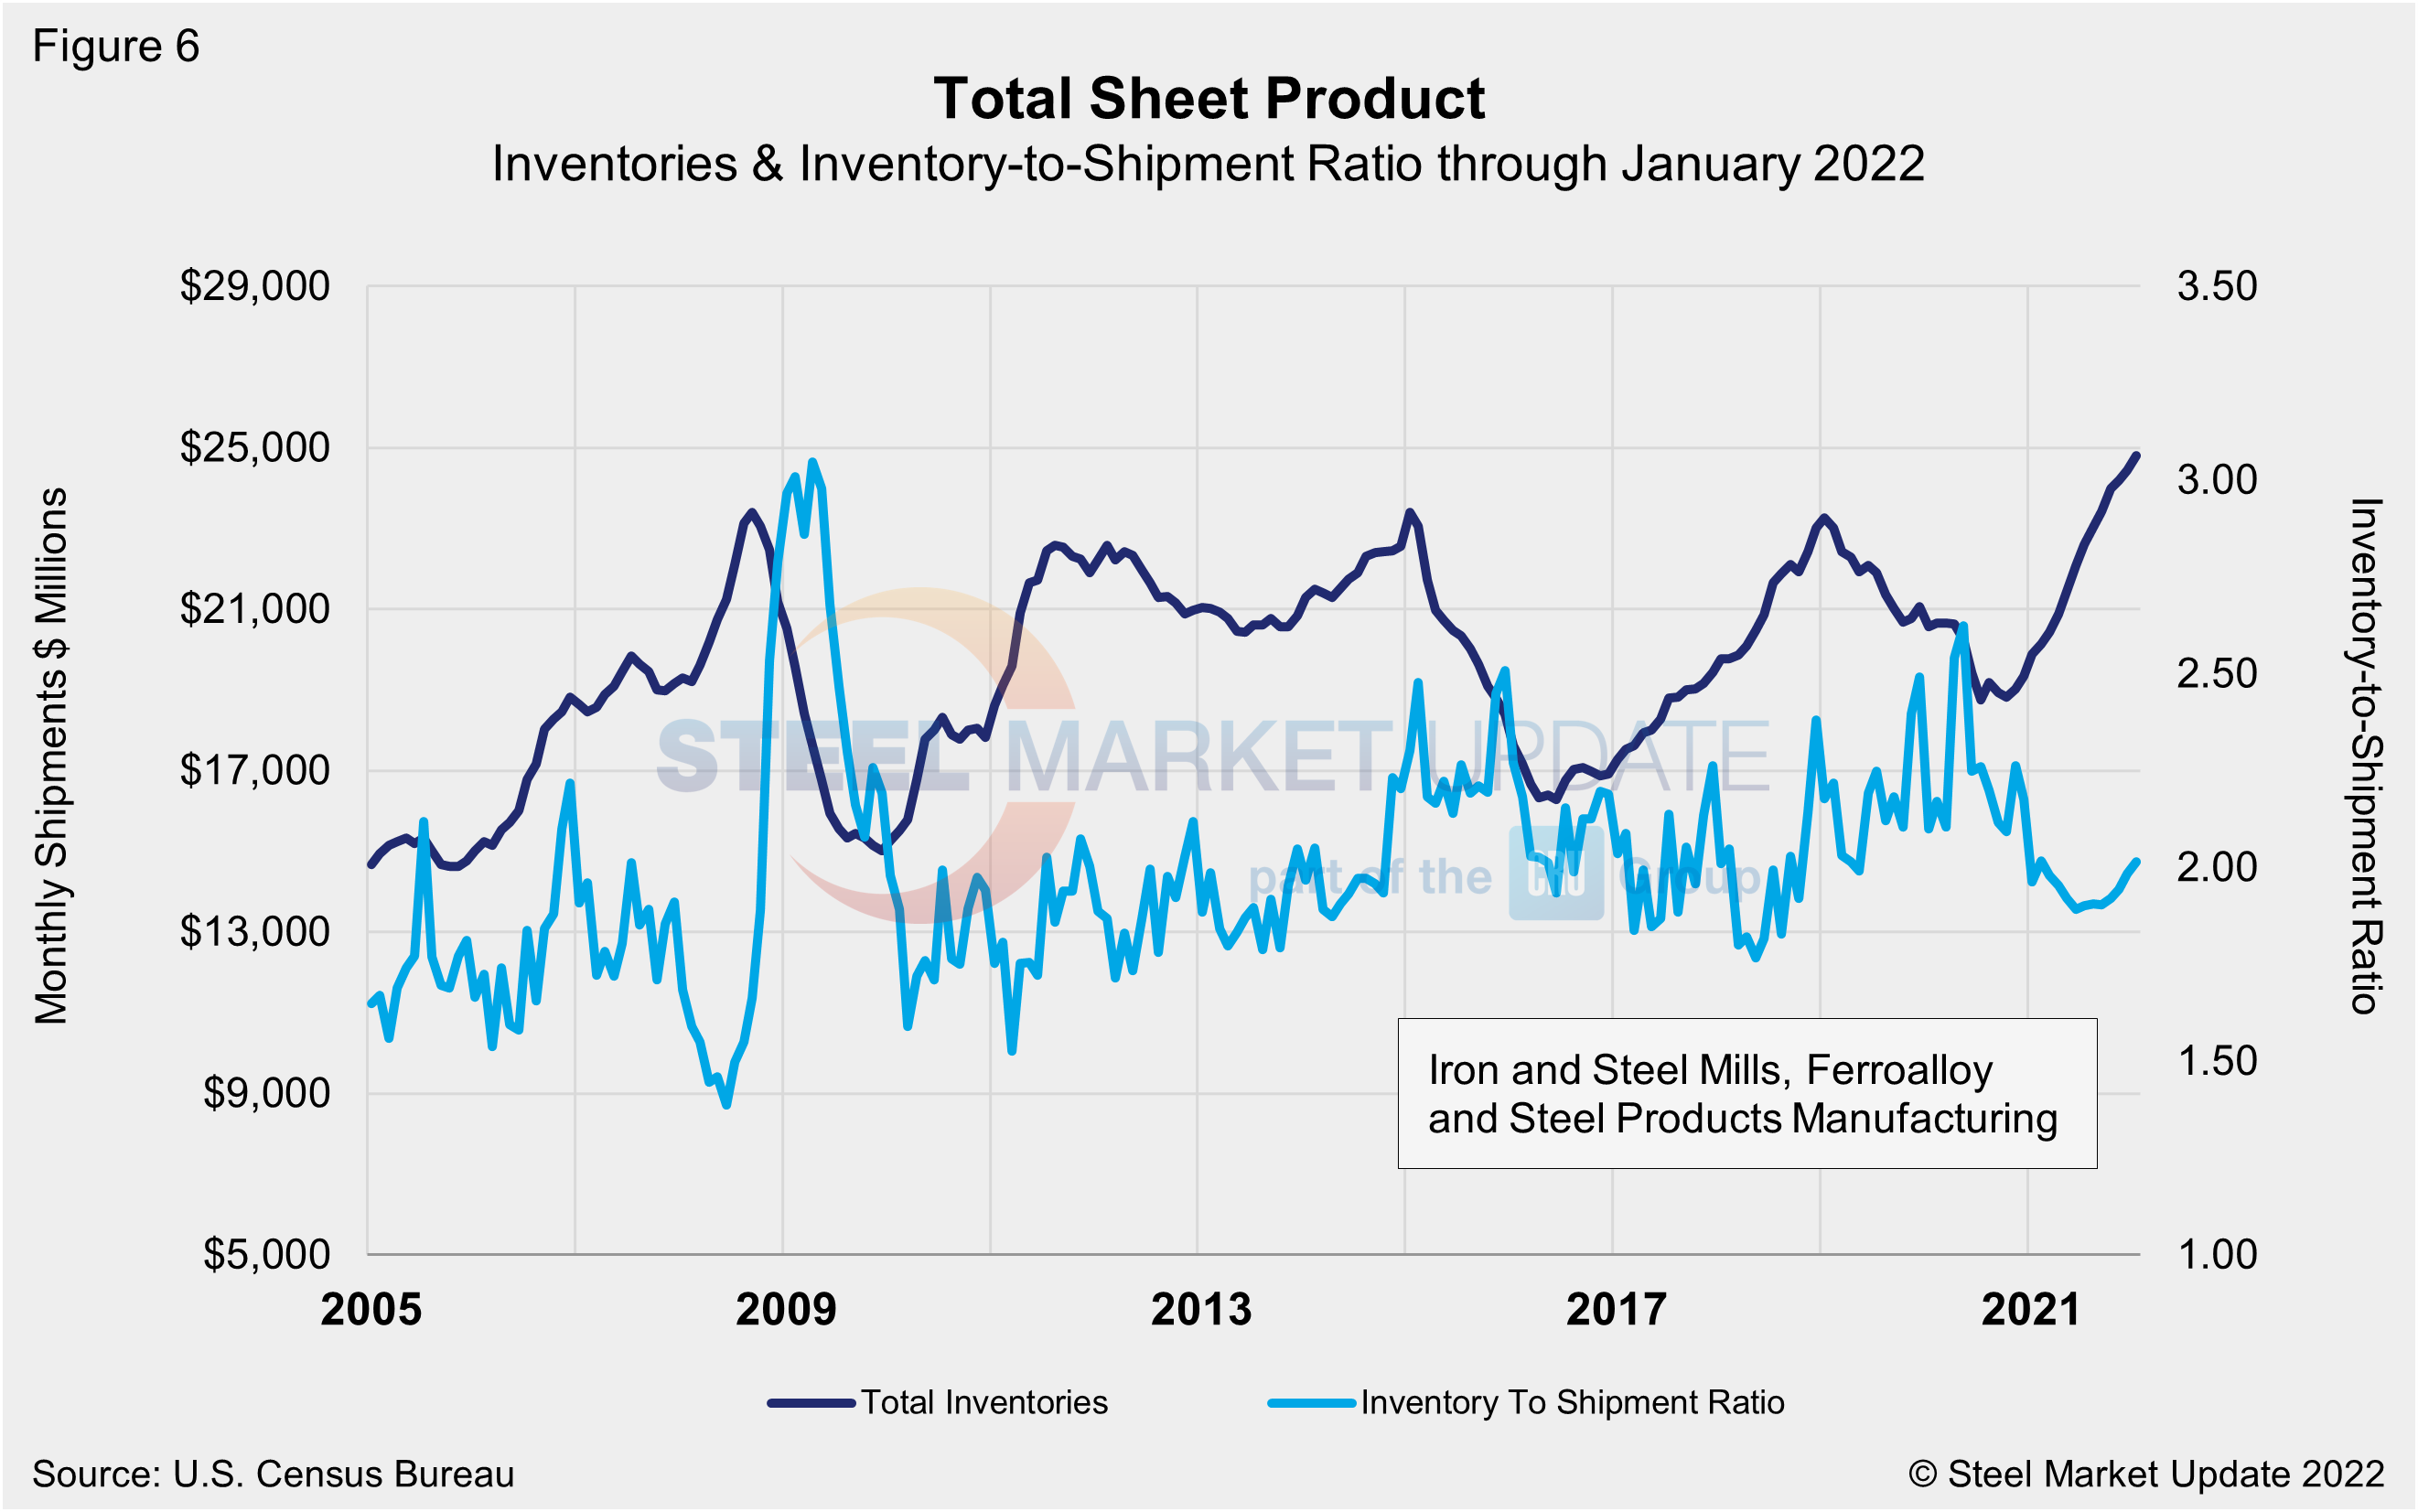
Though total new orders are up 2.2% in January versus a 1.5% gain in total inventories when compared to the same year-ago period, inventories have outpaced new orders by more than 5.0% over the past quarter, thus demand has grown at a slower rate than inventories. Overall, steel shipments have improved by 59.7% since April 2020, when the market reached bottom. Total inventory in millions of dollars is displayed in Figure 6 and echoes the inventory-to-shipment ratio shown in Figure 5.
By David Schollaert, David@SteelMarketUpdate.com


