

Market Data

December 16, 2021
SMU Key Market Indicators Wane, Lack Clarity
Written by David Schollaert
Monthly Key Market Indicators, as analyzed by Steel Market Update, continued their shift to a neutral position over the past month with positive indicators eroding further, slipping for the sixth successive month.
What began as a typical summer slowdown, worsened by a surge in Delta cases and a less-than-ideal job market, has been compounded by supply-chain bottlenecks, rising producer prices and concerns over inflation. The dynamics have pushed market indicators lower, leading to a more neutral or watchful market.
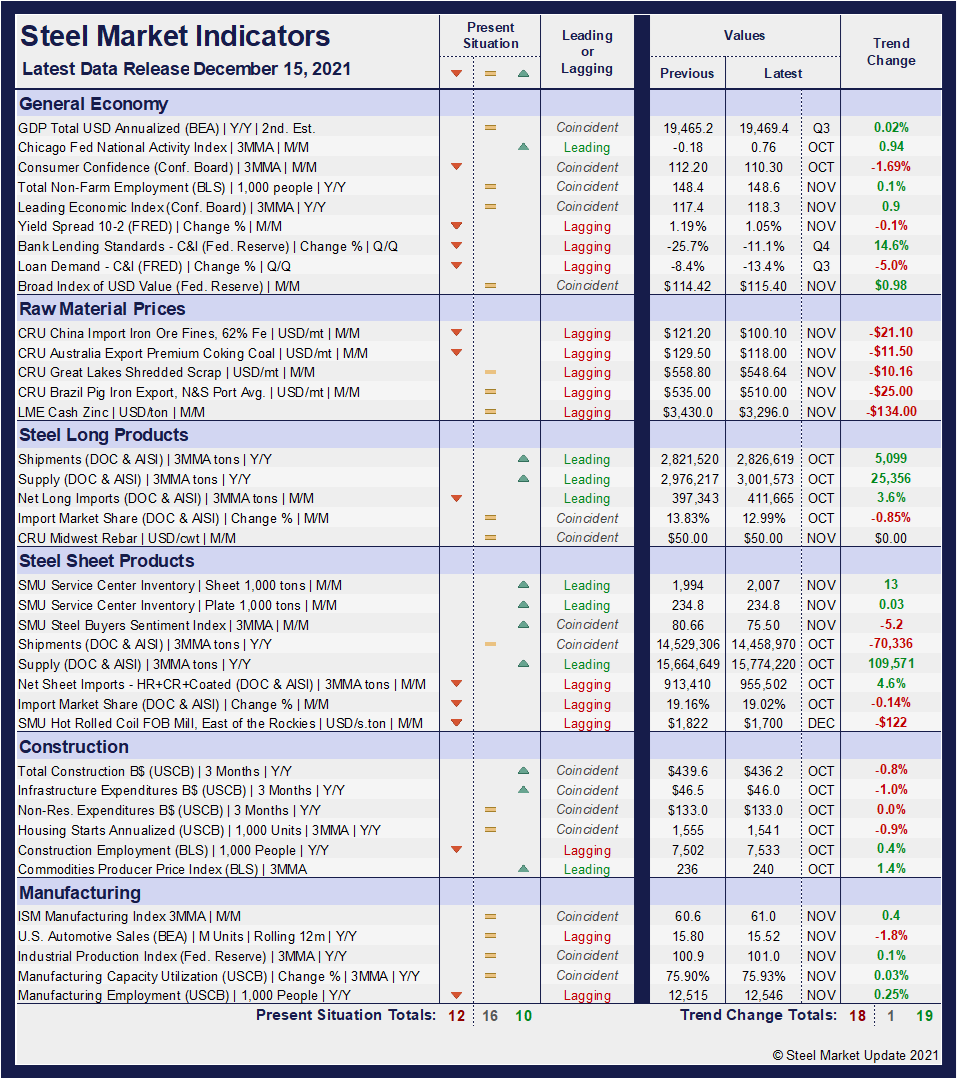
SMU’s Key Market Indicators include a host of data on the economy, raw materials, manufacturing, construction, and steel sheet and long products, offering a snapshot of current sentiment and the near-term expected trajectory of the economy. Markers for the Present Situation have contracted successively since June, finally dragging the Trends markers down as a result.
In the latest data, 10 of the 38 Present Situation indicators are positive, down two points month on month, while the neutral position expanded by the same total to a reading of 16 in November from 14 the month prior. The negative indicators were sideways in November versus October’s reading, holding at 12.
Negative indicators trended down consecutively from February through May reaching as low as three. However, November’s indicator holding at 12 is the highest measurement year-to-date and inching towards some of the higher markers seen last year when the marketplace was slowly recovering from the initial COVID effects. At its worst, 18 of the 38 indicators shifted negative last year as the economy was decimated by the pandemic-driven closures. Although present results have improved during the pandemic-era, gains have decelerated in the final quarter of the year.
SMU’s Present Situation and Trends analyses in the table below are based on the latest available data as of Dec. 15, 2021. Readers should regard the color codes in the “Present Situation” column as a visual summary of the current market condition. The “Trend” columns are also color coded to give a quick visual appreciation of the market’s direction. All data included in this table was released within the past month. The month or specific date to which the data refers is shown in the second column from the far right. Click to expand the table below.
Present Situation
SMU’s Present Situation indicators below highlight the upward trajectory of the domestic market. Although not smooth, the recovery has been notable. Since June, however, momentum has faded, and growth has stumbled as the economy seems to lack traction. The direction was up and gaining ground until June, but has since eroded repeatedly, leading to a more uncertain and watchful trend. Positive indicators rose from 11 to 20 through June, but are now at 10, their lowest mark since September 2020 when the reading was 9. Negative indicators had grown four out of the past five months through October but were unchanged in November. The more telling trend may be the growth in the neutral indicators, presently up at 16 after holding at 14 for three straight months following a four-point expansion in August. The trend suggests the market’s direction is unclear but maybe not as stable as expected.
Supply shortages continue, particularly in the consumer goods, auto and construction sectors. The effects of rising producer prices and an underperforming employment sector are compounded by rising interest rates, expanding inflation, and concerns of a new COVID variant.
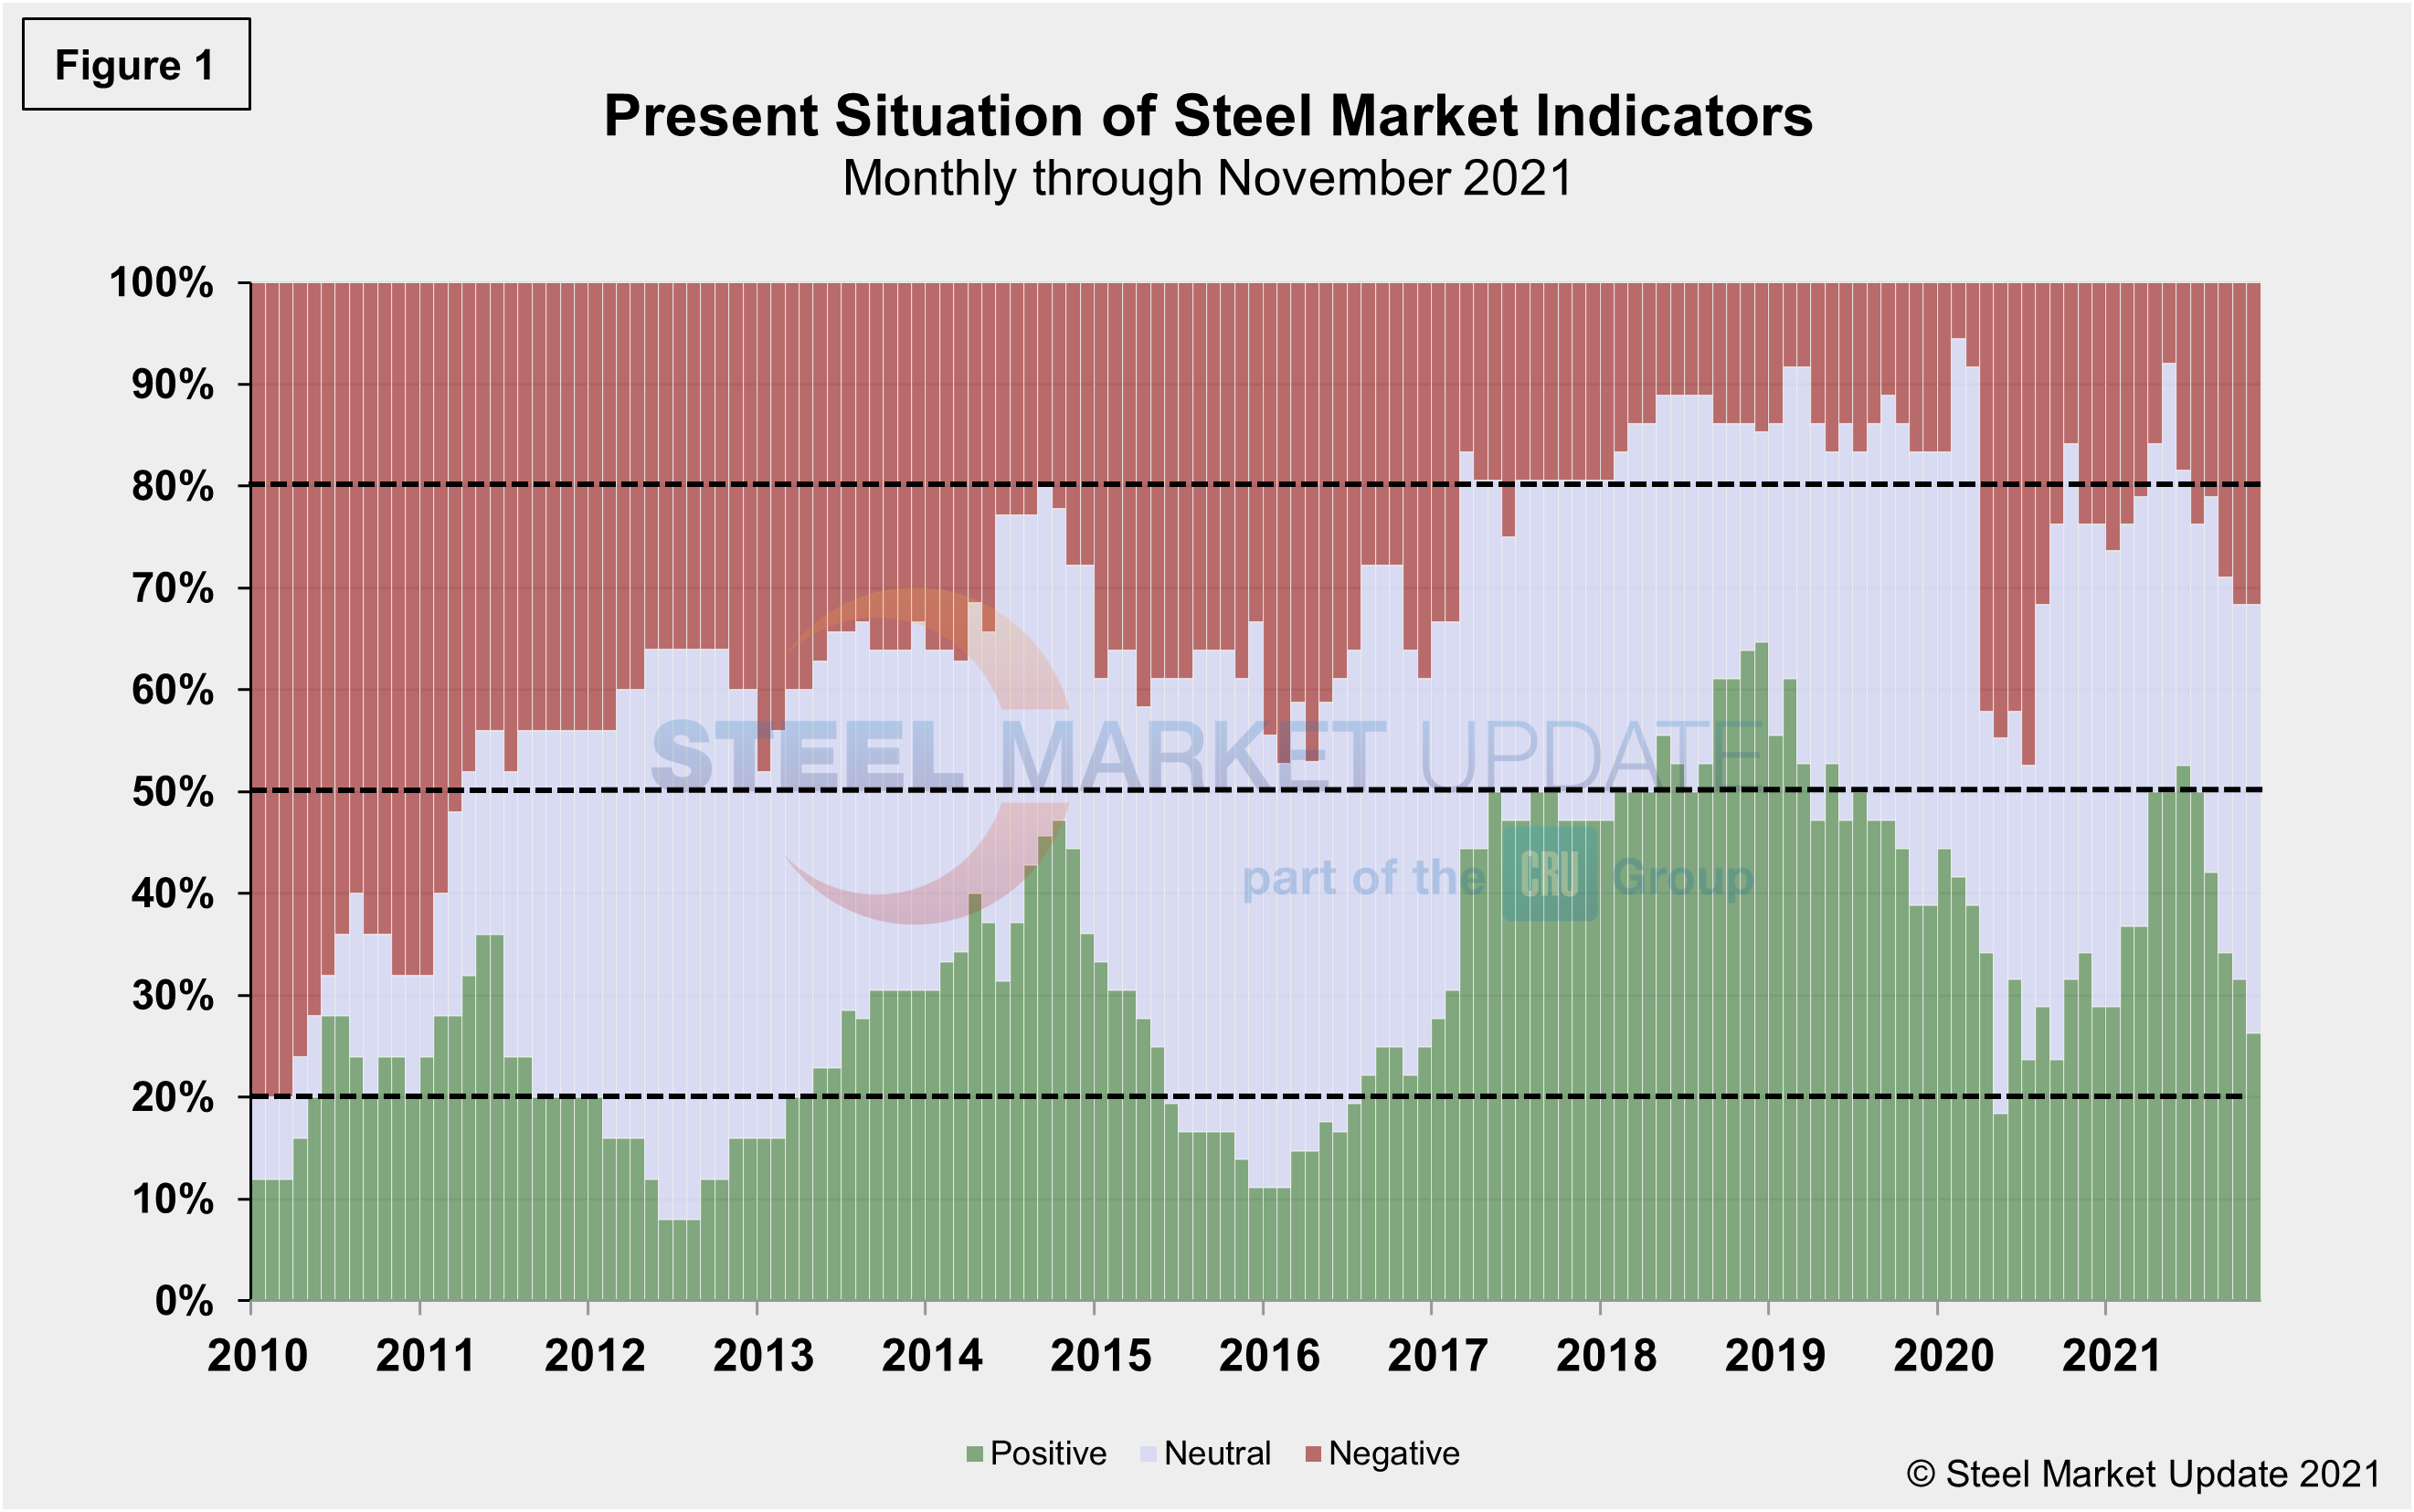
Present results have continued to reveal a more apprehensive marketplace compared to last month’s data due to the ongoing decline in the positive totals and the continued expansion of the neutral figures. Presently, 42.1% of the marketplace is neutral or unclear, a 5.3 percentage point increase and matching its second highest total all year. Through November, 26.3% of the marketplace is positive, down from 31.6% the month prior, and from a high of 52.6% in June. Presently, 31.6% of the market is negative but 68.4% of the population still sees the marketplace as neutral-to-positive, according to SMU’s assessment of key market indicators, unchanged from one month ago.
Our monthly assessment of the Present Situation since January 2010 on a percentage basis is shown in Figure 1.
Trends
SMU’s Trends indicators plummeted, a move more reflective of the market’s Present Situation and potentially bringing down the market outlook as it transitions into 2022. It is important to note that most values in the Trends columns are three-month moving averages (3MMA) to smooth erratic monthly data. Note that in many cases this is not November or December data, but data that was released in November and/or December for previous months. Compared to month-ago data, the negative trend jumped to 47.4% in November. The neutral trend inched up to 2.6% from zero the month prior, but was still down from a high of 5.3% in August. The positive trend fell from 68.4% down to 50.0%, a decline of more than 18 percentage points month on month and matching its second lowest total all year. Figure 2 shows the recent movement of the trends and historical data for comparison.

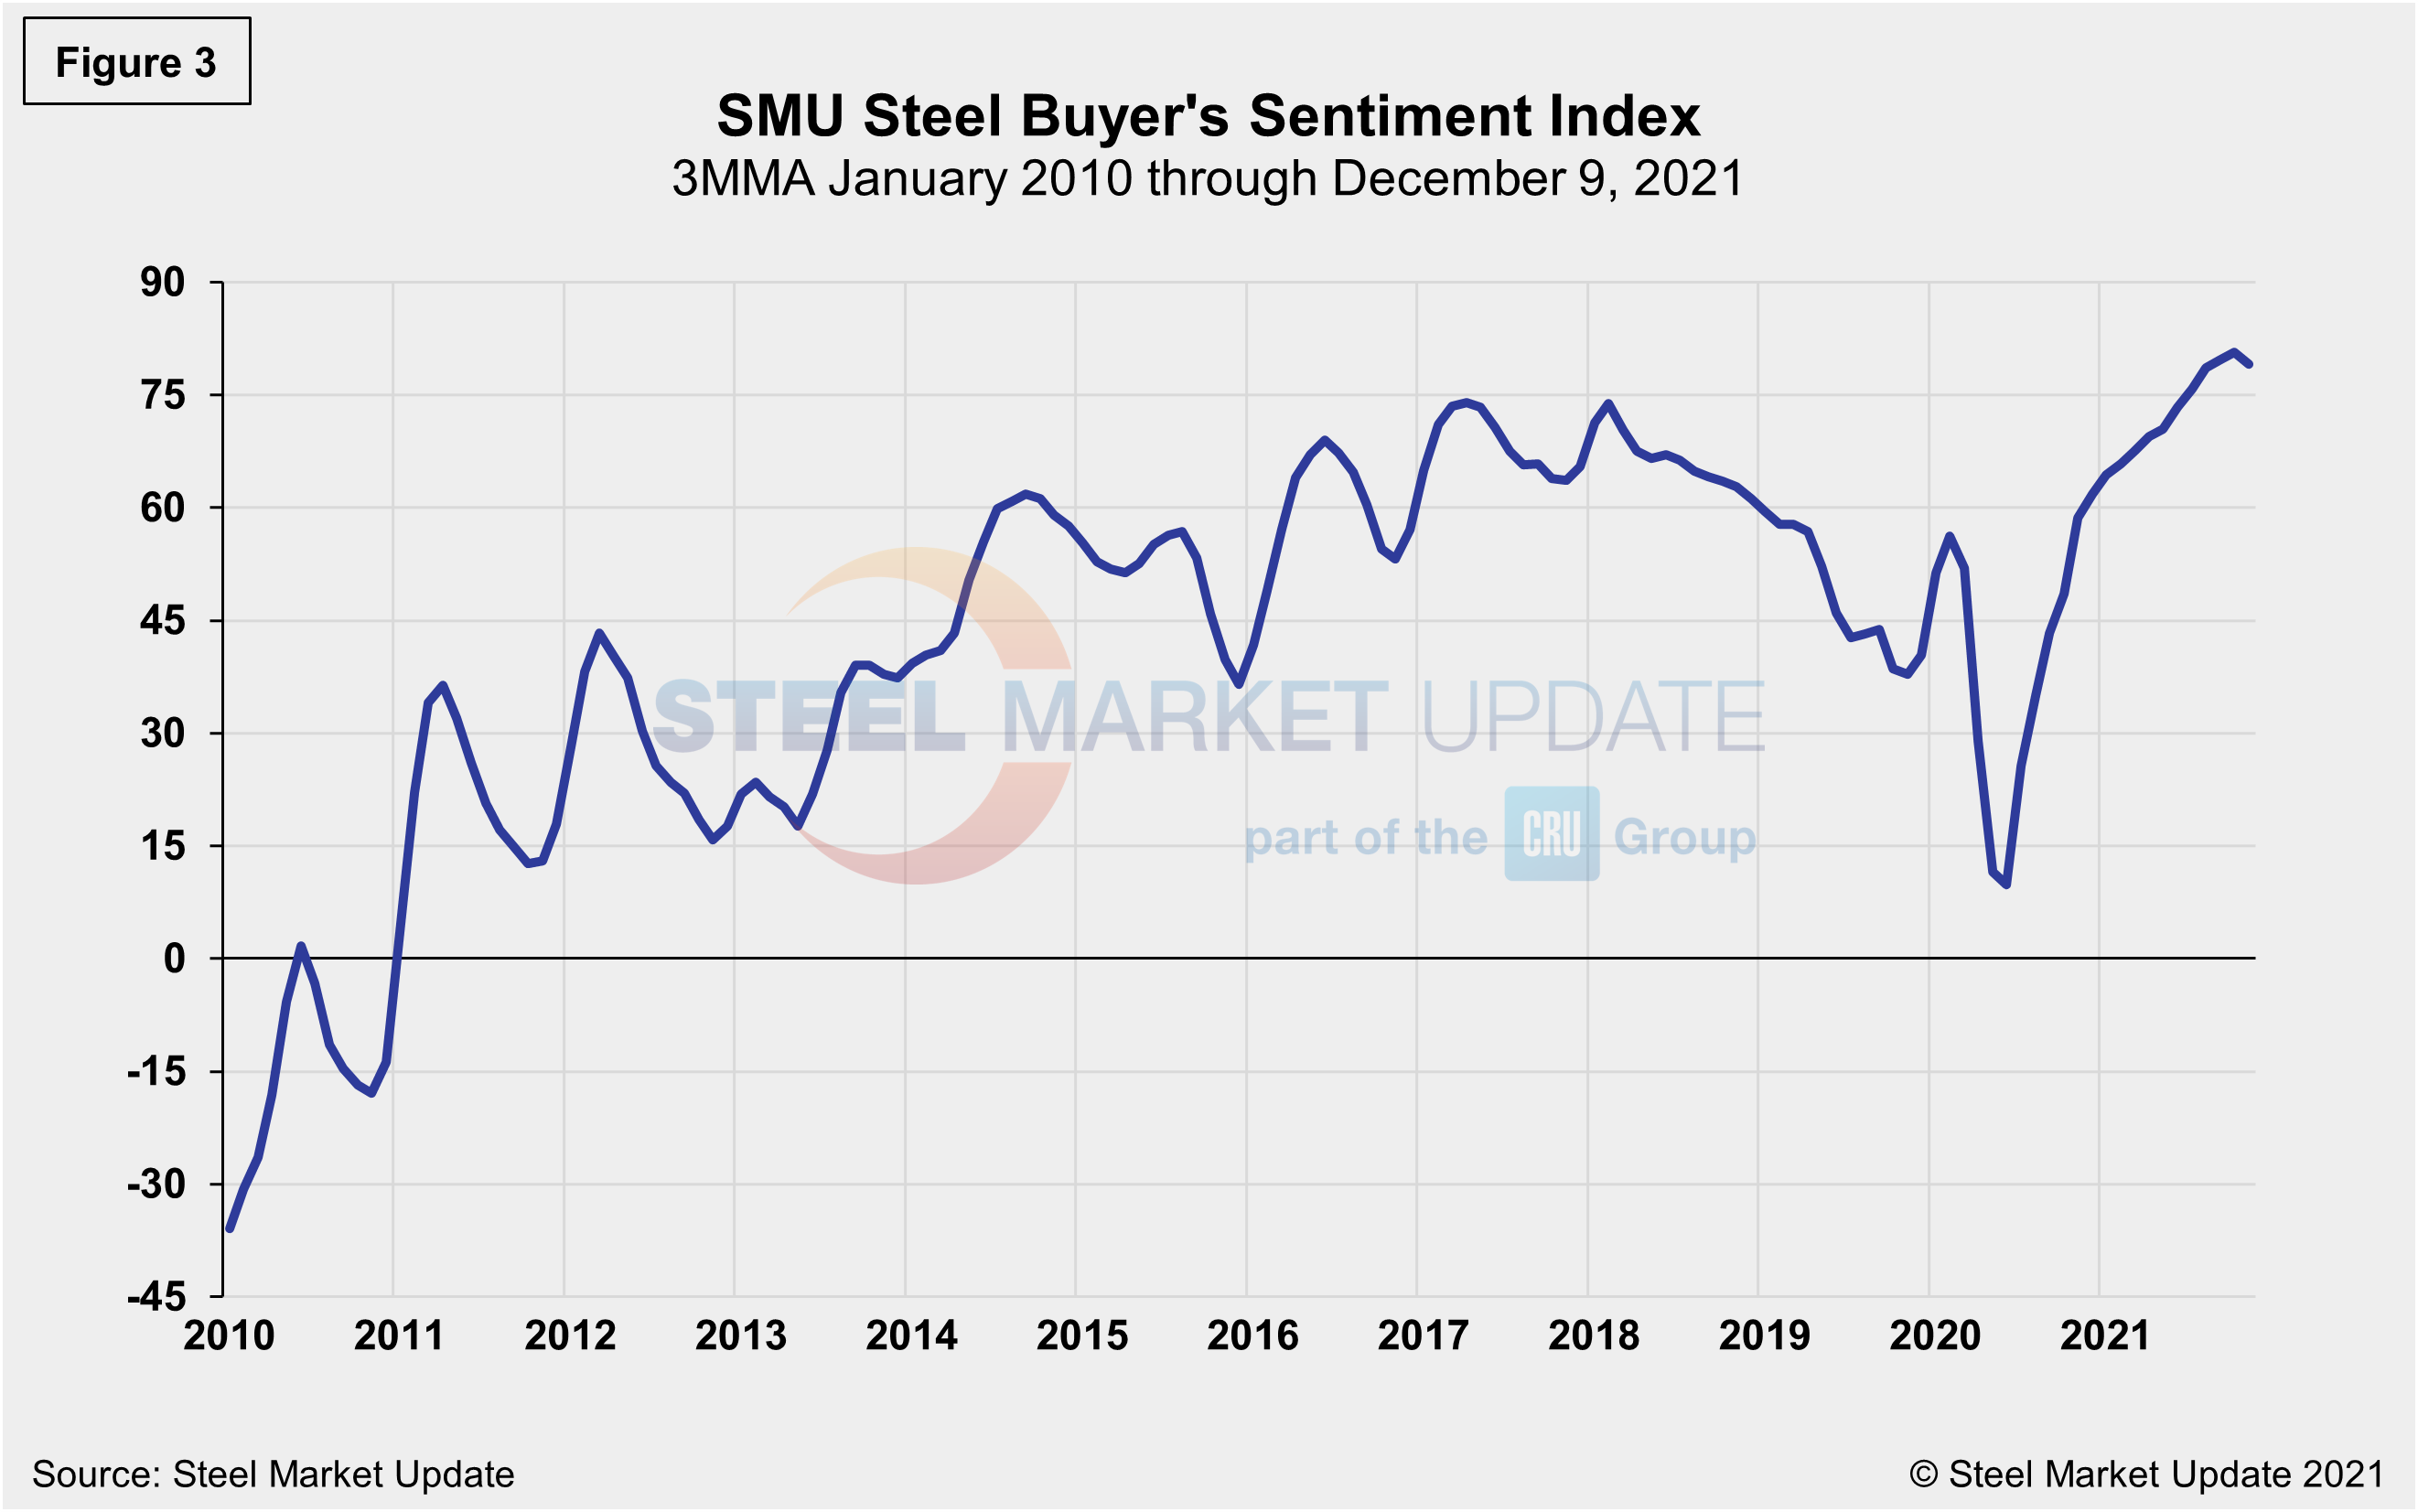
The SMU Steel Buyers Sentiment Index is a measure of the current attitude of North American steel buyers regarding their company’s chances for success in today’s market. The single value of the current sentiment index fell to -8 in early March 2020, a 66 point drop in just a month as the pandemic hit the economy. It has since rebounded to a healthy +75 as of Dec. 9, but a slight erosion from the high of +84 seen Sept. 2. Figure 3 shows the 3MMA of the index since 2010. A reading above the neutral point of zero indicates that buyers have a positive attitude about their prospects. Strong demand and relatively high steel prices should keep the Steel Buyer’s Sentiment Index at a highly optimistic level for the foreseeable future despite the current price correction.
By David Schollaert, David@SteelMarketUpdate.com


