Analysis

December 6, 2021
CPIP Data: Construction Spending Inches Up in October
Written by David Schollaert
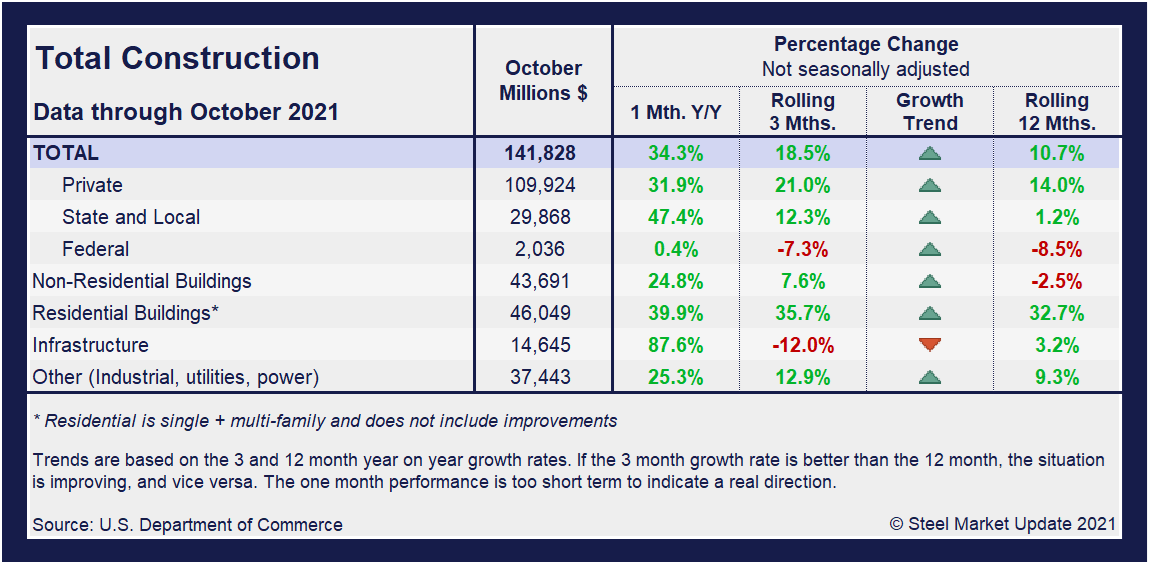
U.S. construction spending rose fractionally in October after contracting the two months prior, but actual construction outlays year-to-date are 7.5% greater than the first 10 months of 2020, the Commerce Department reported.
The Census Bureau’s report on construction spending shows residential slipped 0.5% during October, the once meteoric market now in its fourth month of easing. Despite strong buyer demand and dwindling inventories of existing homes, persistent shortage of materials and labor in a substantially higher-cost environment have forced builders to tap the breaks on new development. Nonresidential outlays rose 0.9% in October, the fourth straight month spending has either been flat or improved.
A major theme of the past year and a half has been the divergence in residential and nonresidential activity owed largely to the lingering pandemic. Now, the late-pandemic economic picture is coming into sharper focus and residential and nonresidential construction spending appear to be moving back toward their respective, normal trend lines.
For the year-to-date, construction has consumed $1.323 trillion, 7.5% more than the $1.231 trillion spent during the first 10 months of last year. The results continue to disappoint, however, as the domestic marketplace is now more than a year removed from the worst of the pandemic and struggling to expand as many had anticipated.
Construction put in place in the private sector was at a seasonally adjusted $1.245 trillion in October, down from $1.248 trillion the prior month, a 0.2% decline. Single-family homebuilding spending declined 0.8% and outlays on multifamily housing projects fell 0.1%. Shortages and more expensive building materials are holding back homebuilding. Residential investment contracted for a second straight quarter in Q3, weighed down by decreases in home improvements and single-family home construction.
Publicly funded construction spending in October rose 1.8% to an annual rate of $353 billion after dipping 0.1% in September. Outlays on state and local government construction projects jumped 0.9%, while federal government spending accelerated 14.6%.
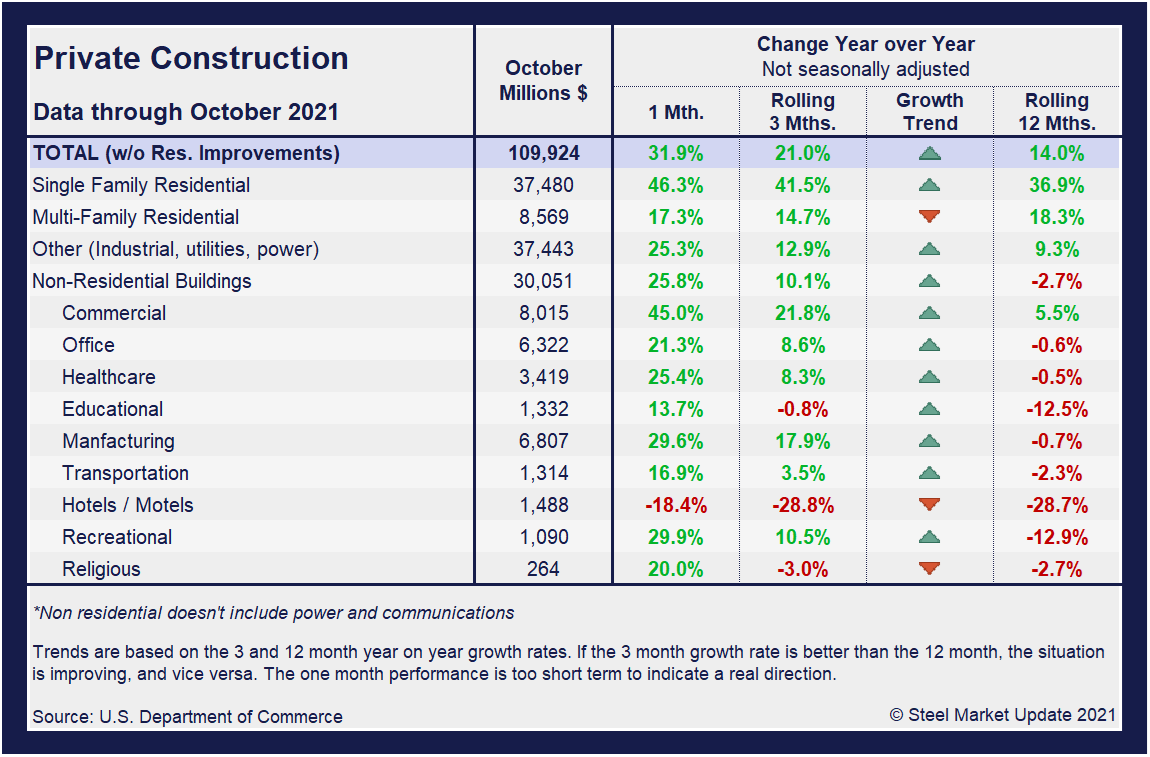
Total construction expenditures and its major categories are shown in the table and chart (Figure 1) below.
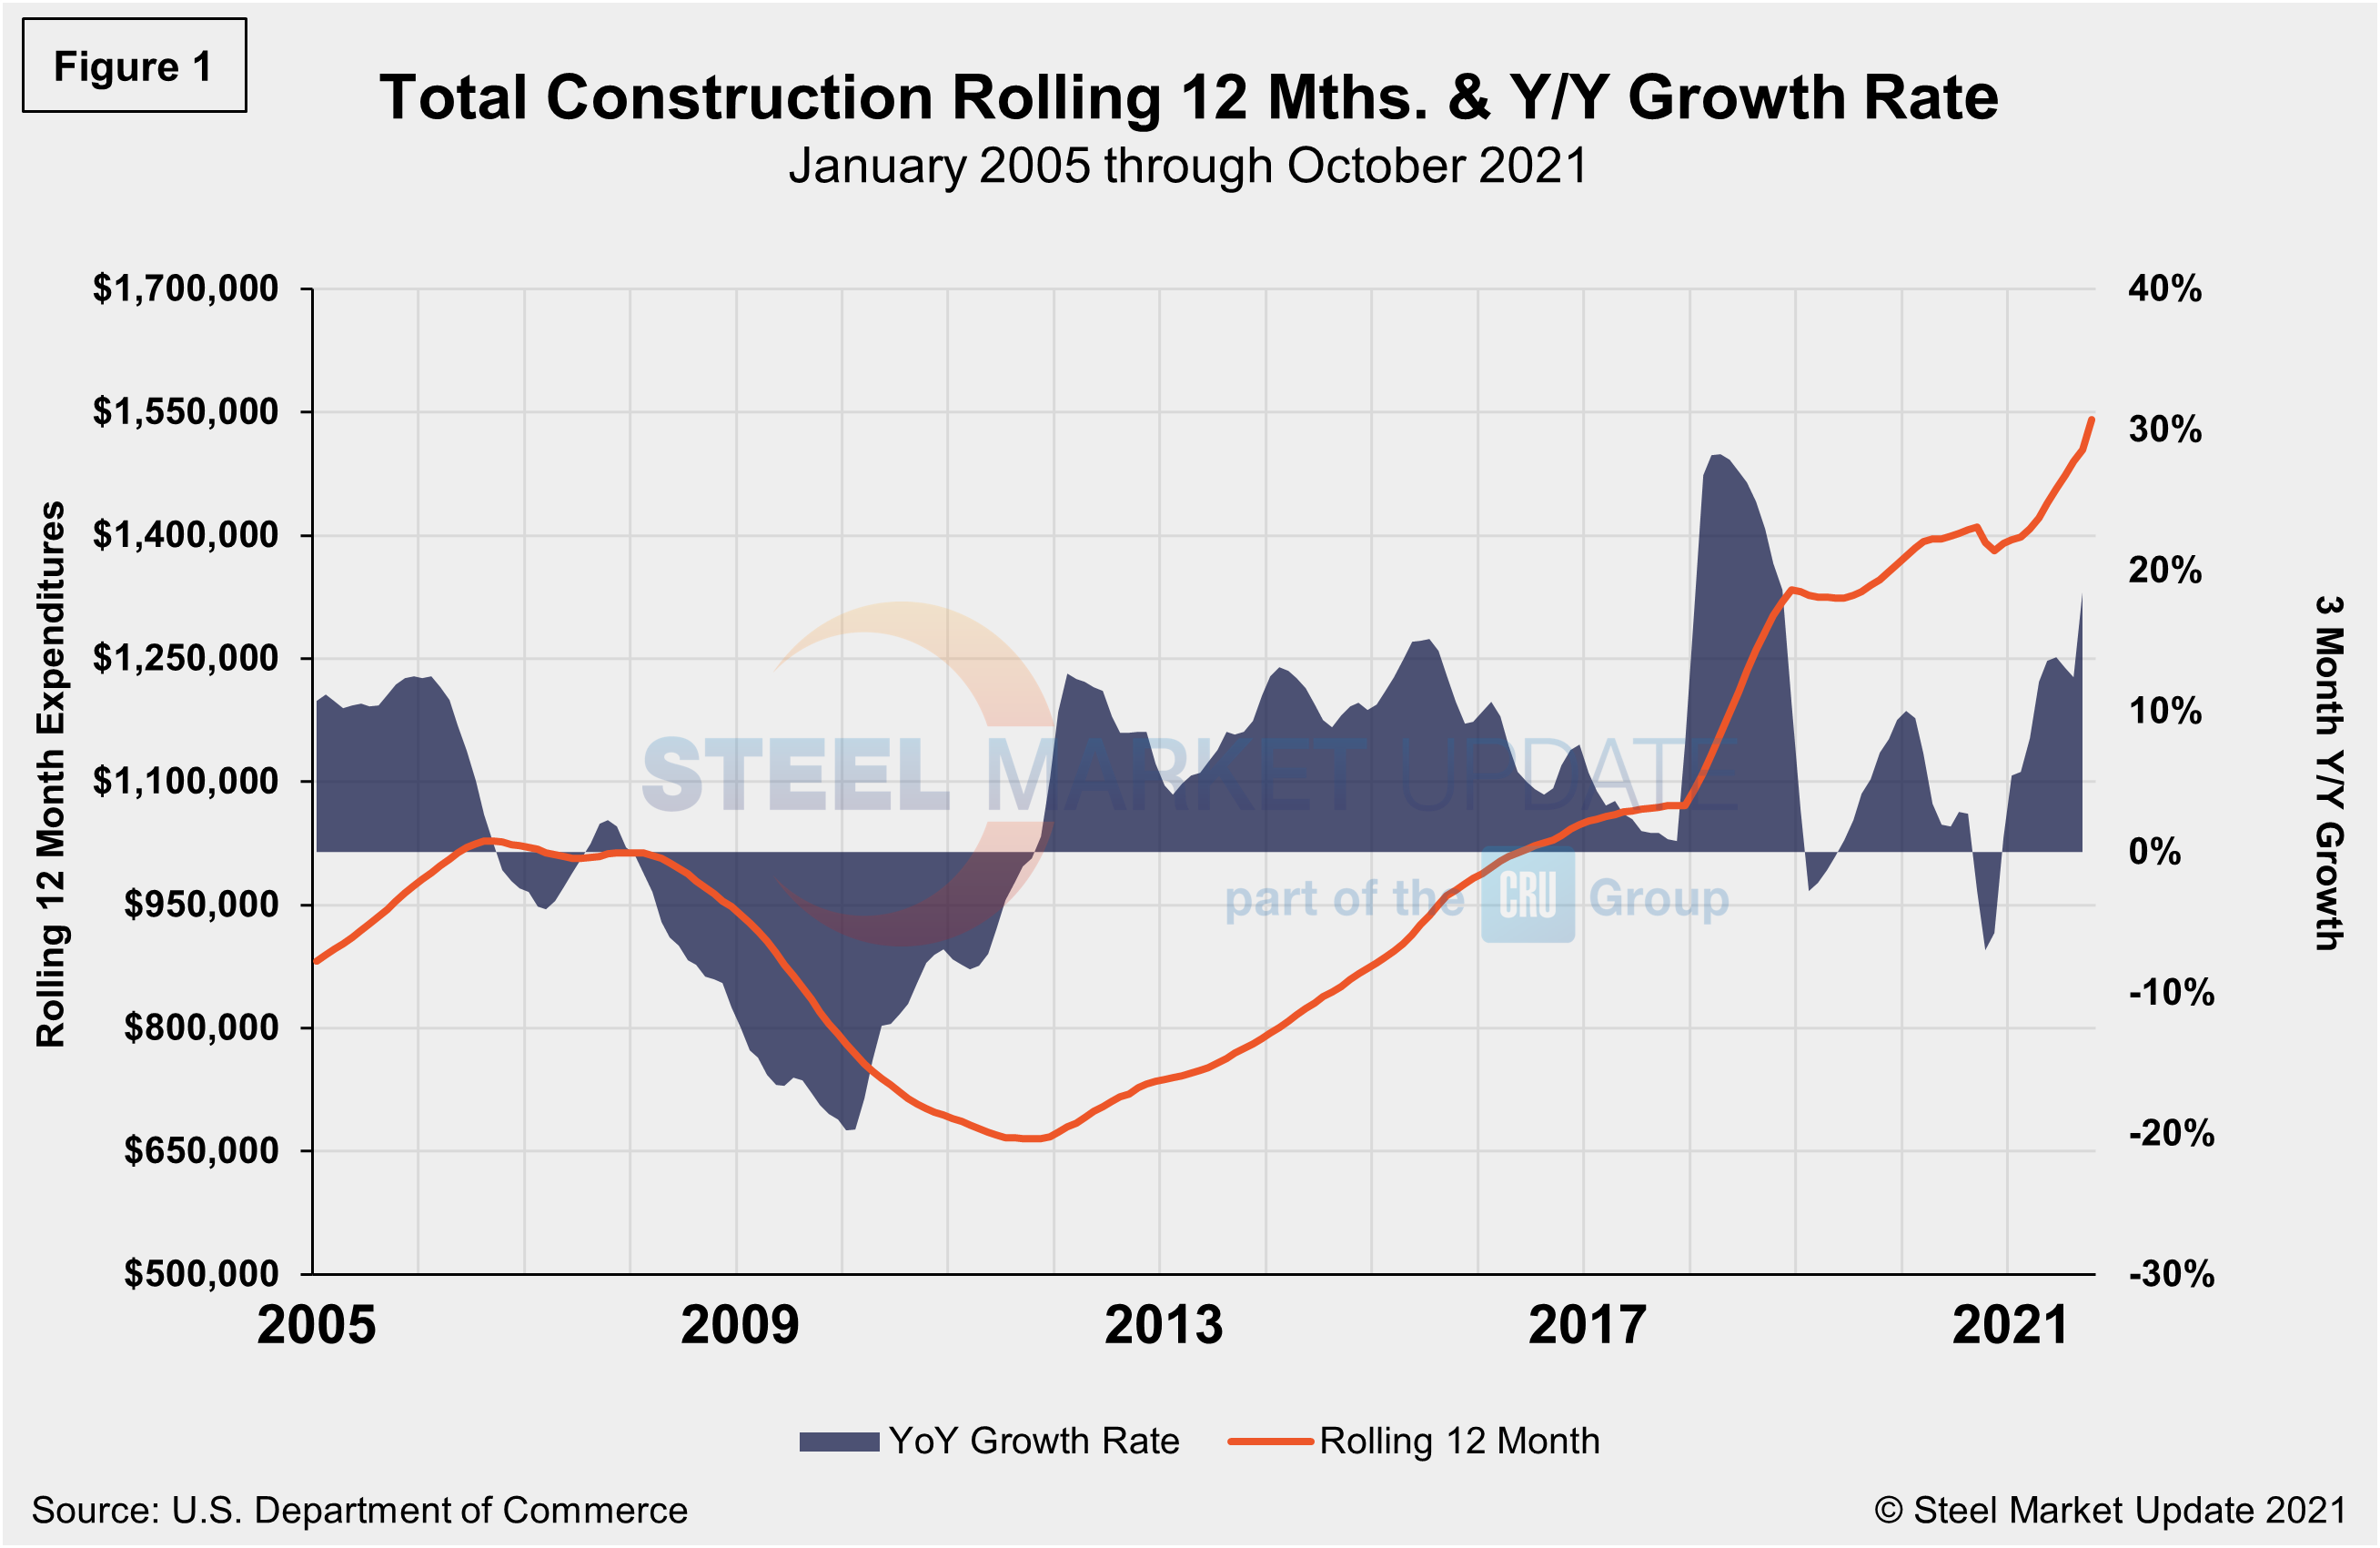
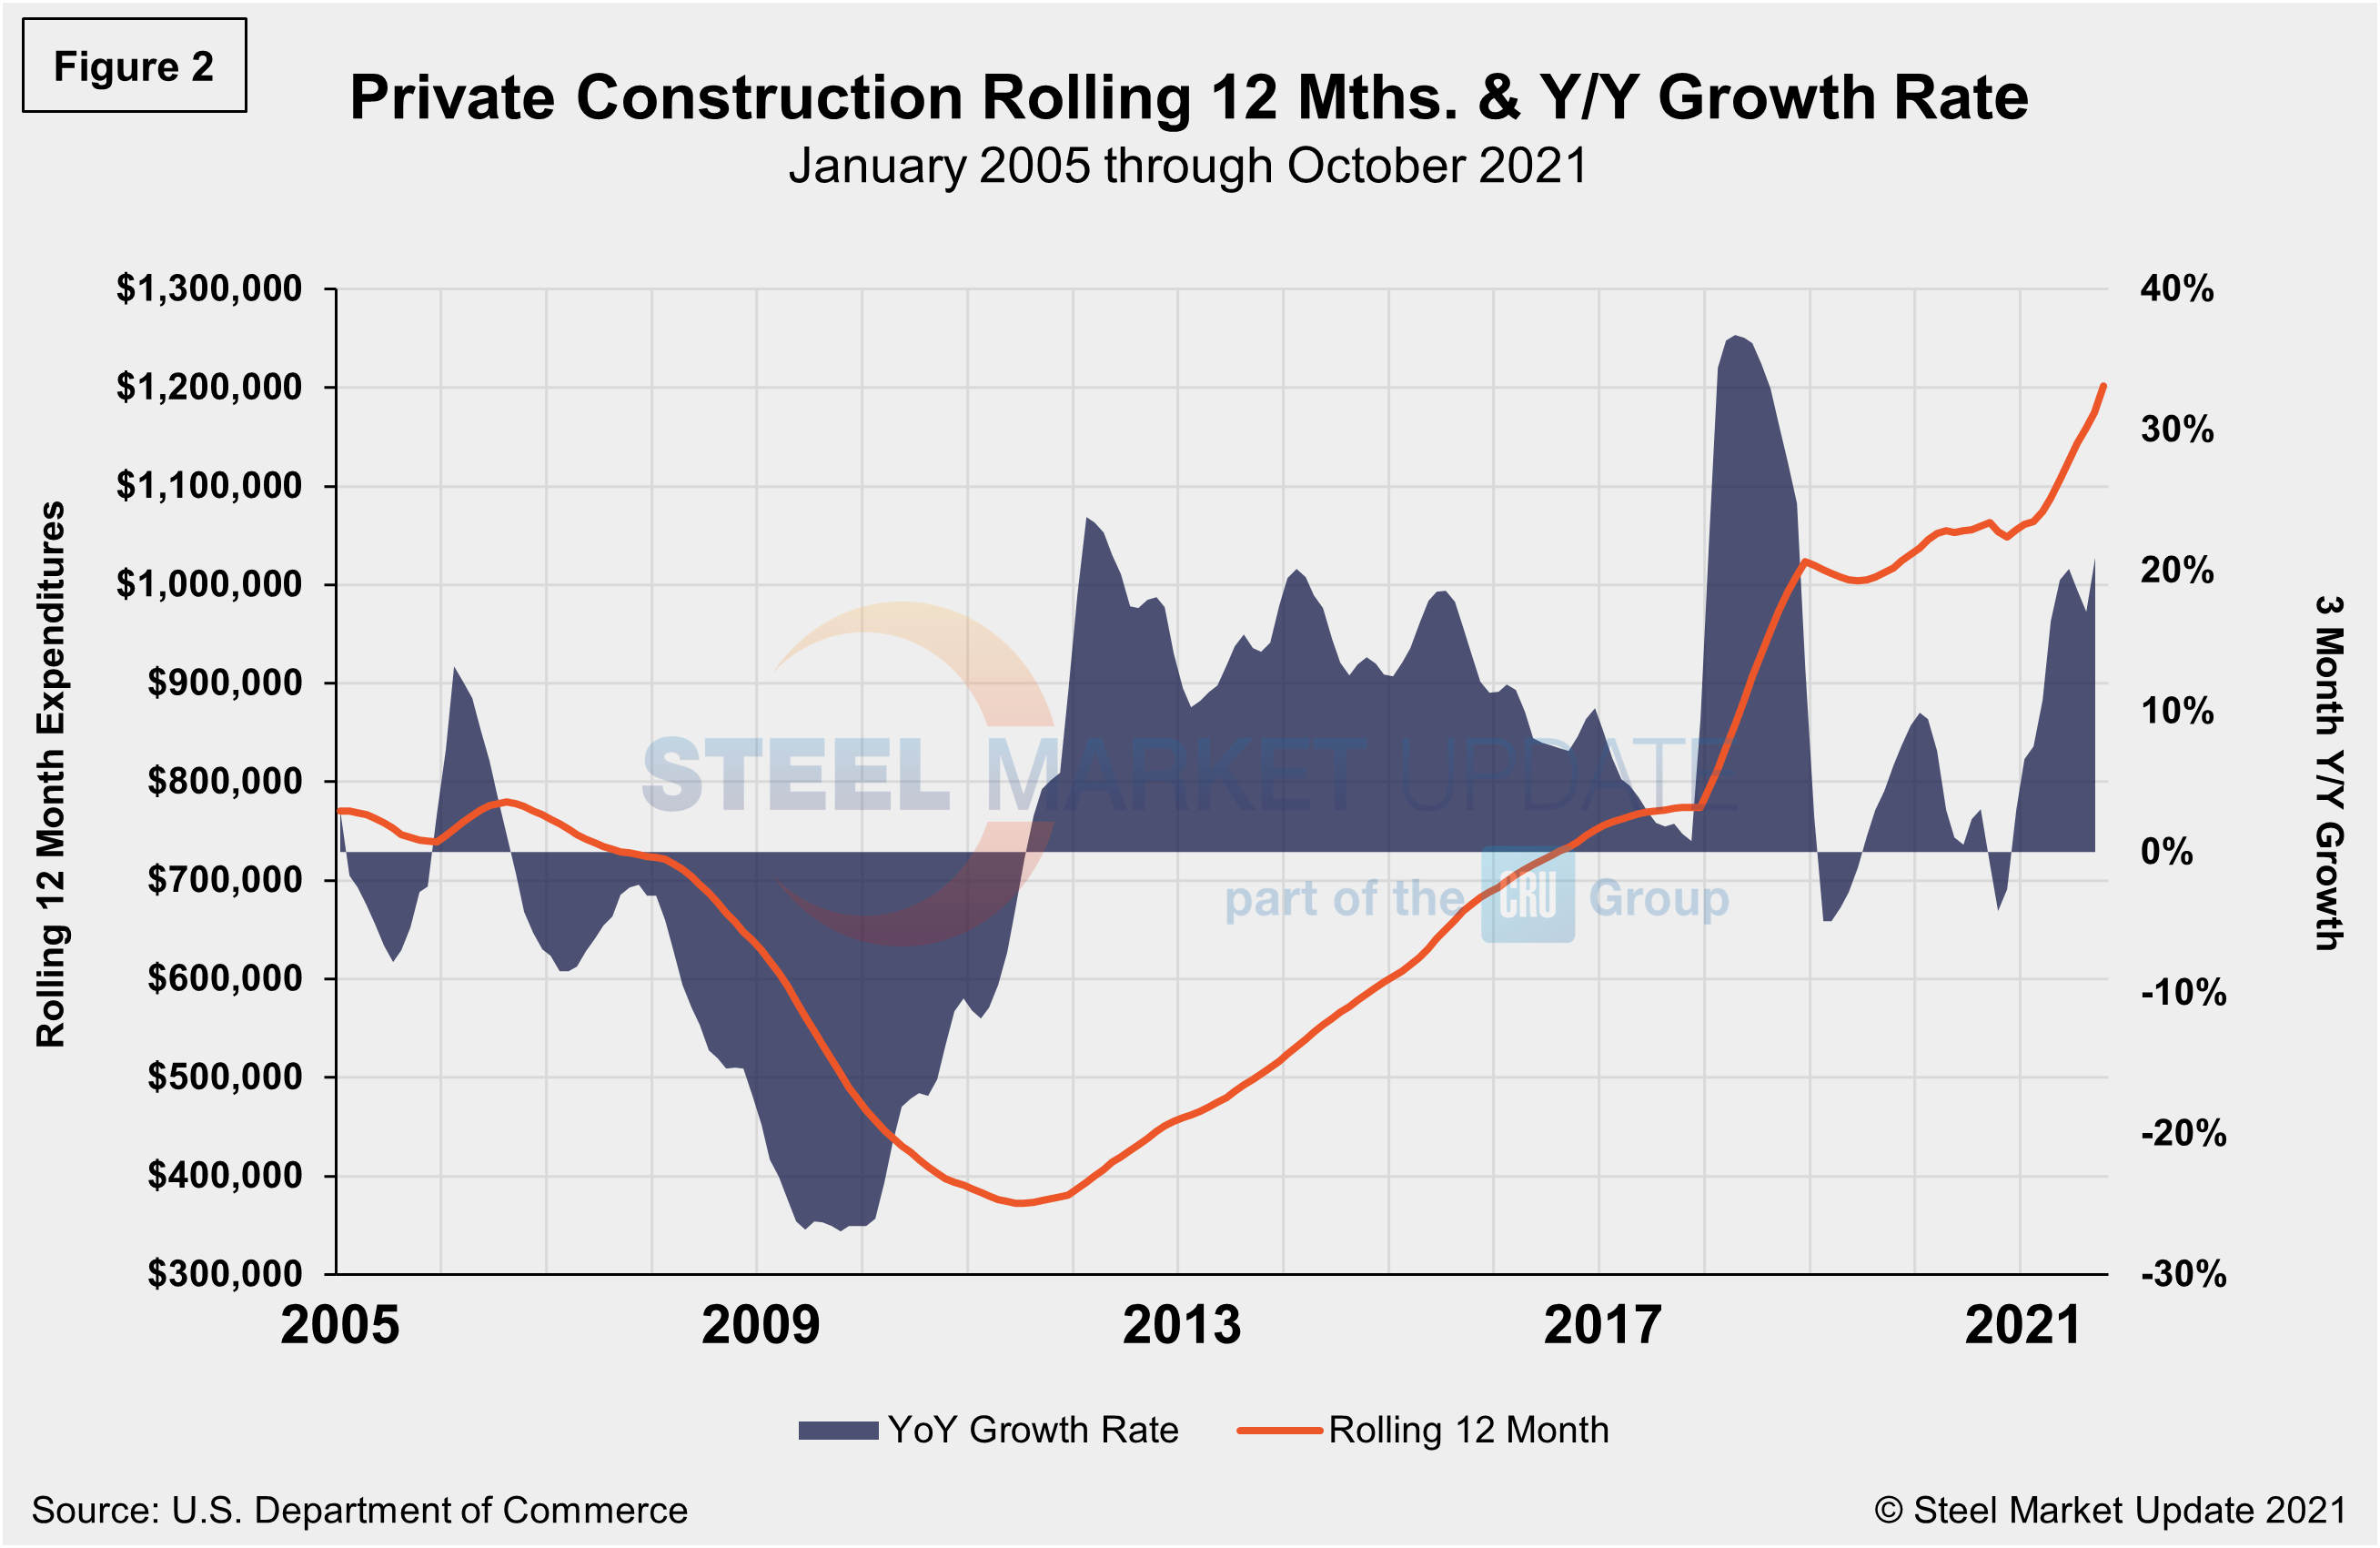
Private Construction
The breakdown of private expenditures into residential and nonresidential and their subsectors are highlighted in the table below. Private construction spending increased 14.0% year over year to an annual rate of $1.245 trillion. Within that category, private residential construction spending rose 36.9% annually while private nonresidential was down 2.7% compared the same period.
Residential construction spending declined for the second month in a row, slipping 0.5% from the rate in September. Nevertheless, the year-to-date total for residential spending was 24.2% higher than in the same months of 2020. Spending on new single-family houses decreased 0.8% for the month, but outpaced the 2020 year-to-date total by 25.9%. Multifamily construction spending dipped 0.1% in October, but topped the 2020 year-to-date total by 16.6%.
Weighed down by declines in home improvements and single-family homebuilding, residential investment contracted for two consecutive quarters in Q2 and Q3, with many speculating further contraction in the fourth quarter.
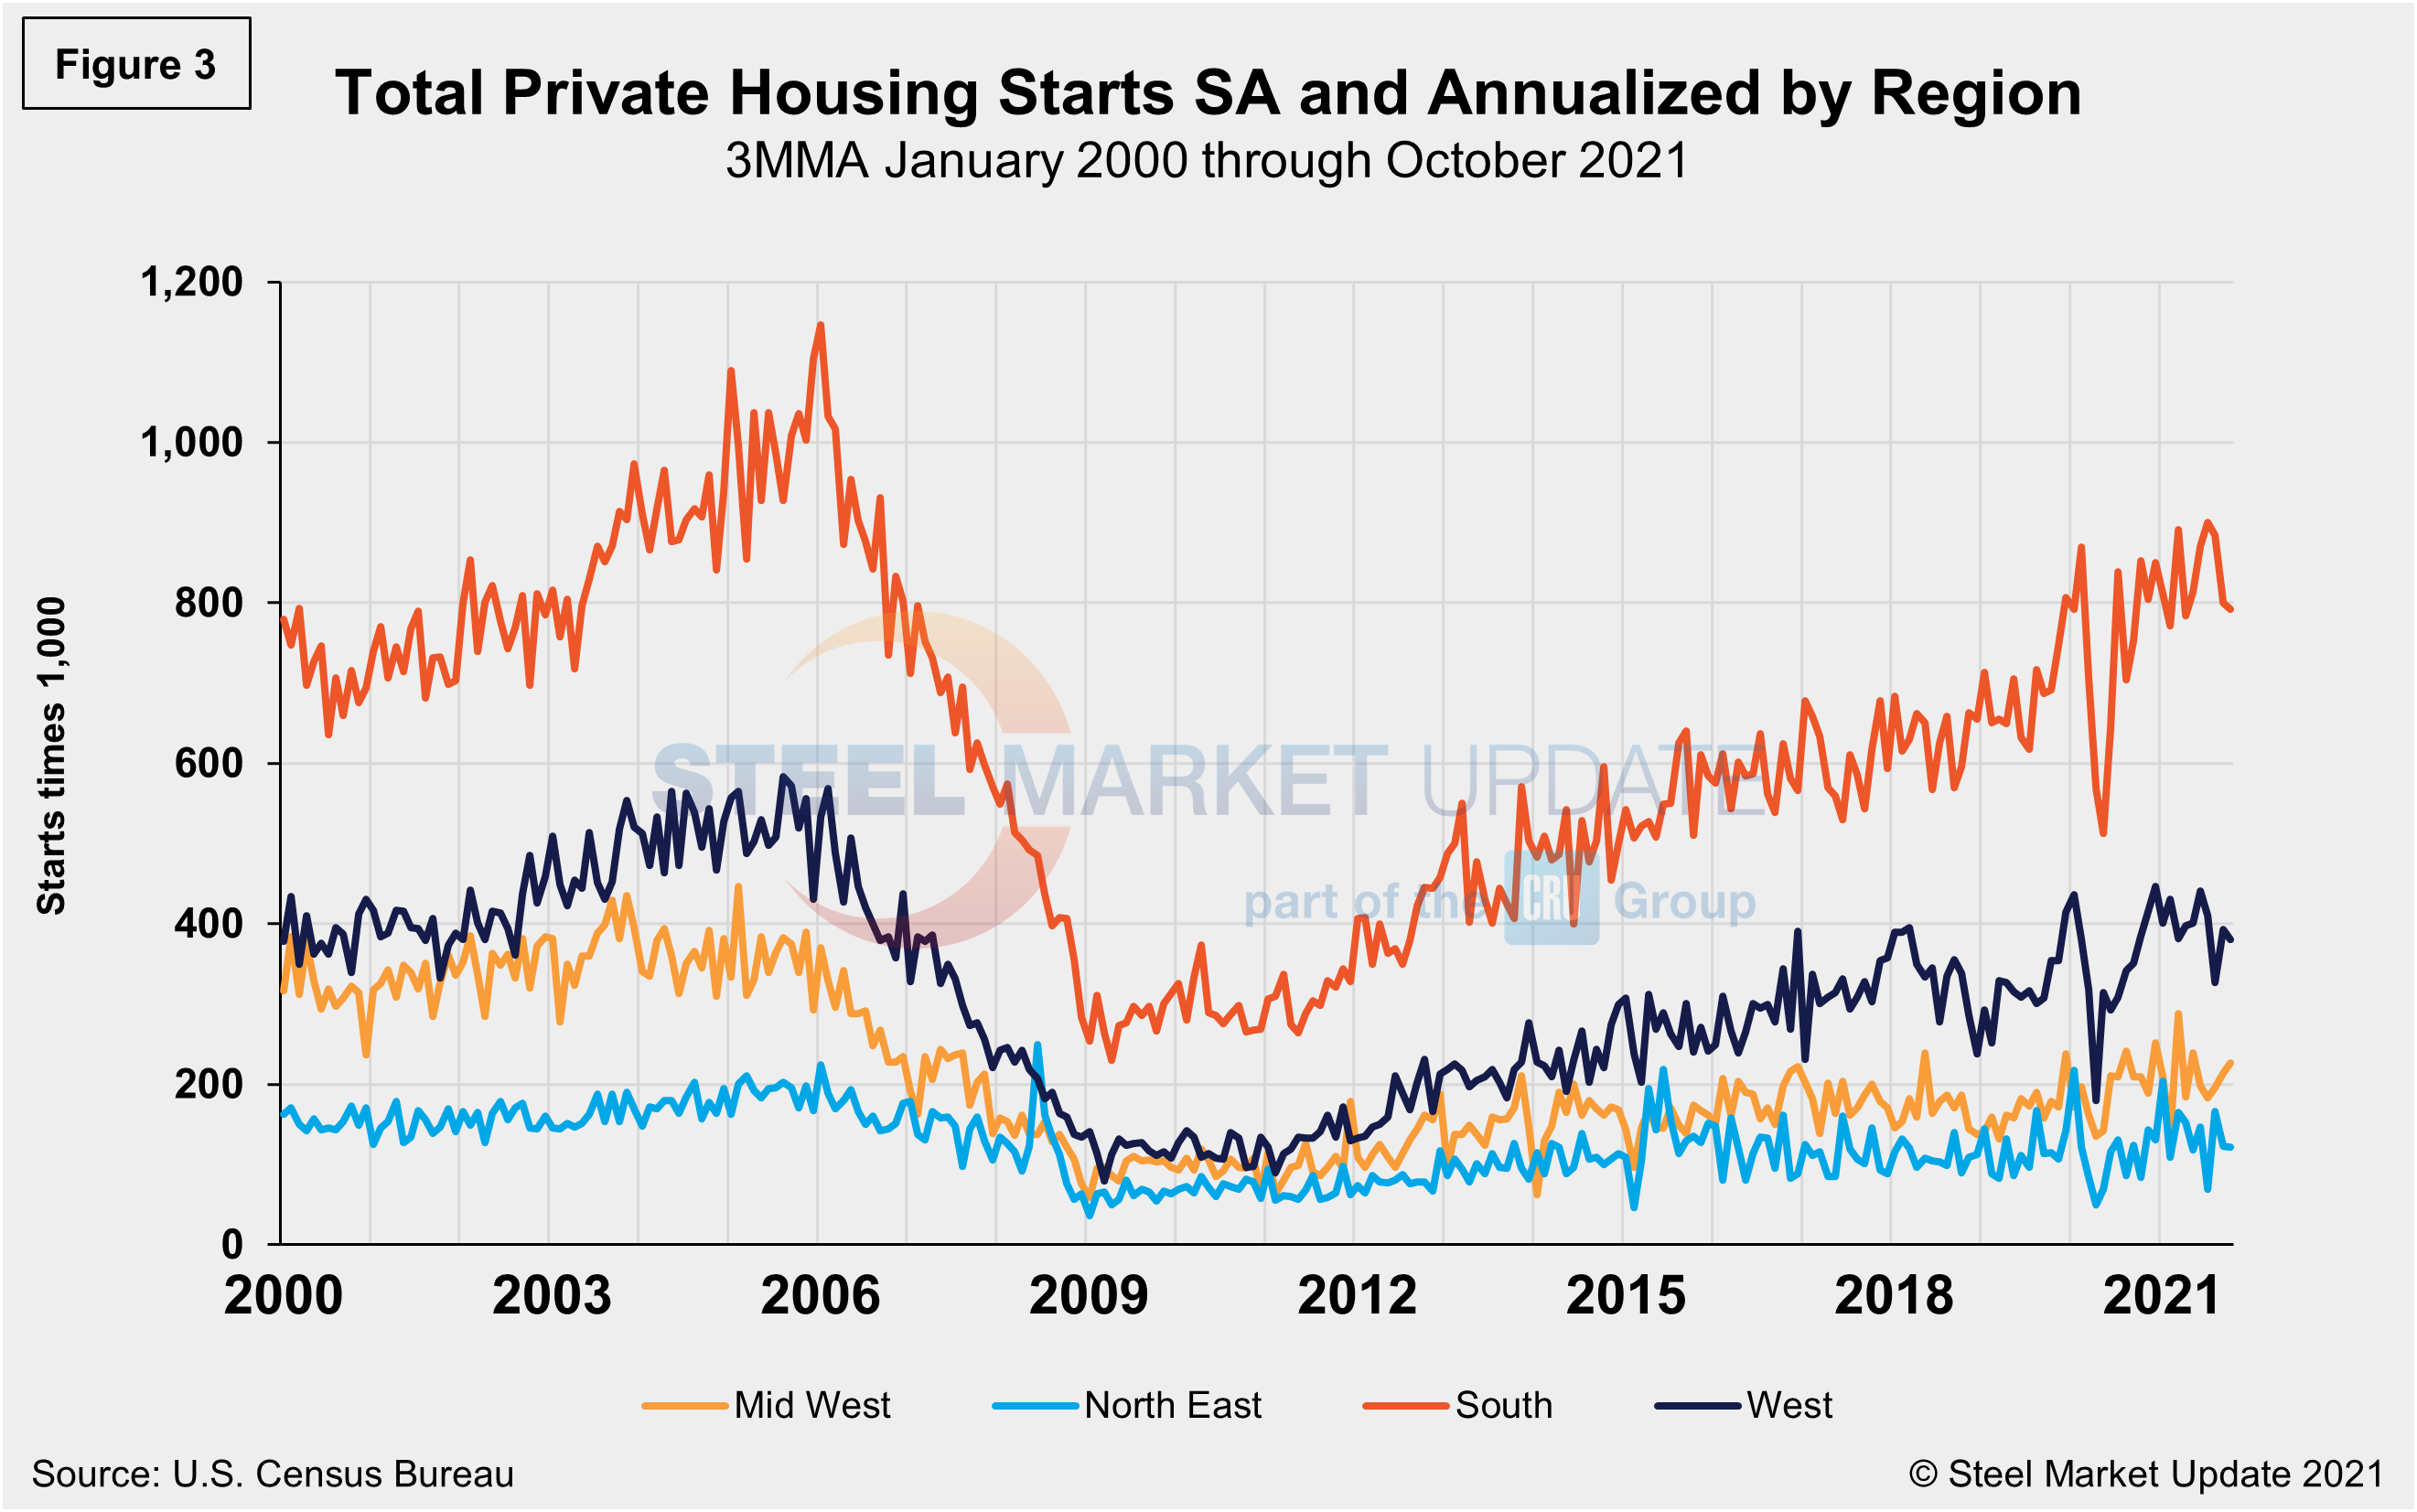
Total housing starts in the four regions are displayed below (Figure 3). Privately‐owned housing starts in October were at a seasonally adjusted annual rate of 1.520 million, down 0.7% from the revised September estimate of 1.530 million. The decrease was driven by a single-family slowdown, at a rate of 1.039 million, down 3.9% from September’s revised figure of 1.081 million. Both single-family and multifamily properties have struggled with similar labor and material shortages.
The South region continues to be the strongest for housing starts at 792,000 in October, besting the West—the second-place region—by more than double. The Northeast continued to trail the other three regions with just 122,000 starts in October. All four regions were directly impacted by the widespread COVID-19 shutdowns last year, causing housing starts to fall sharply. Since then, they have recovered to pre-pandemic levels, but have been widely inconsistent due to supply-side limitations and rising material costs.
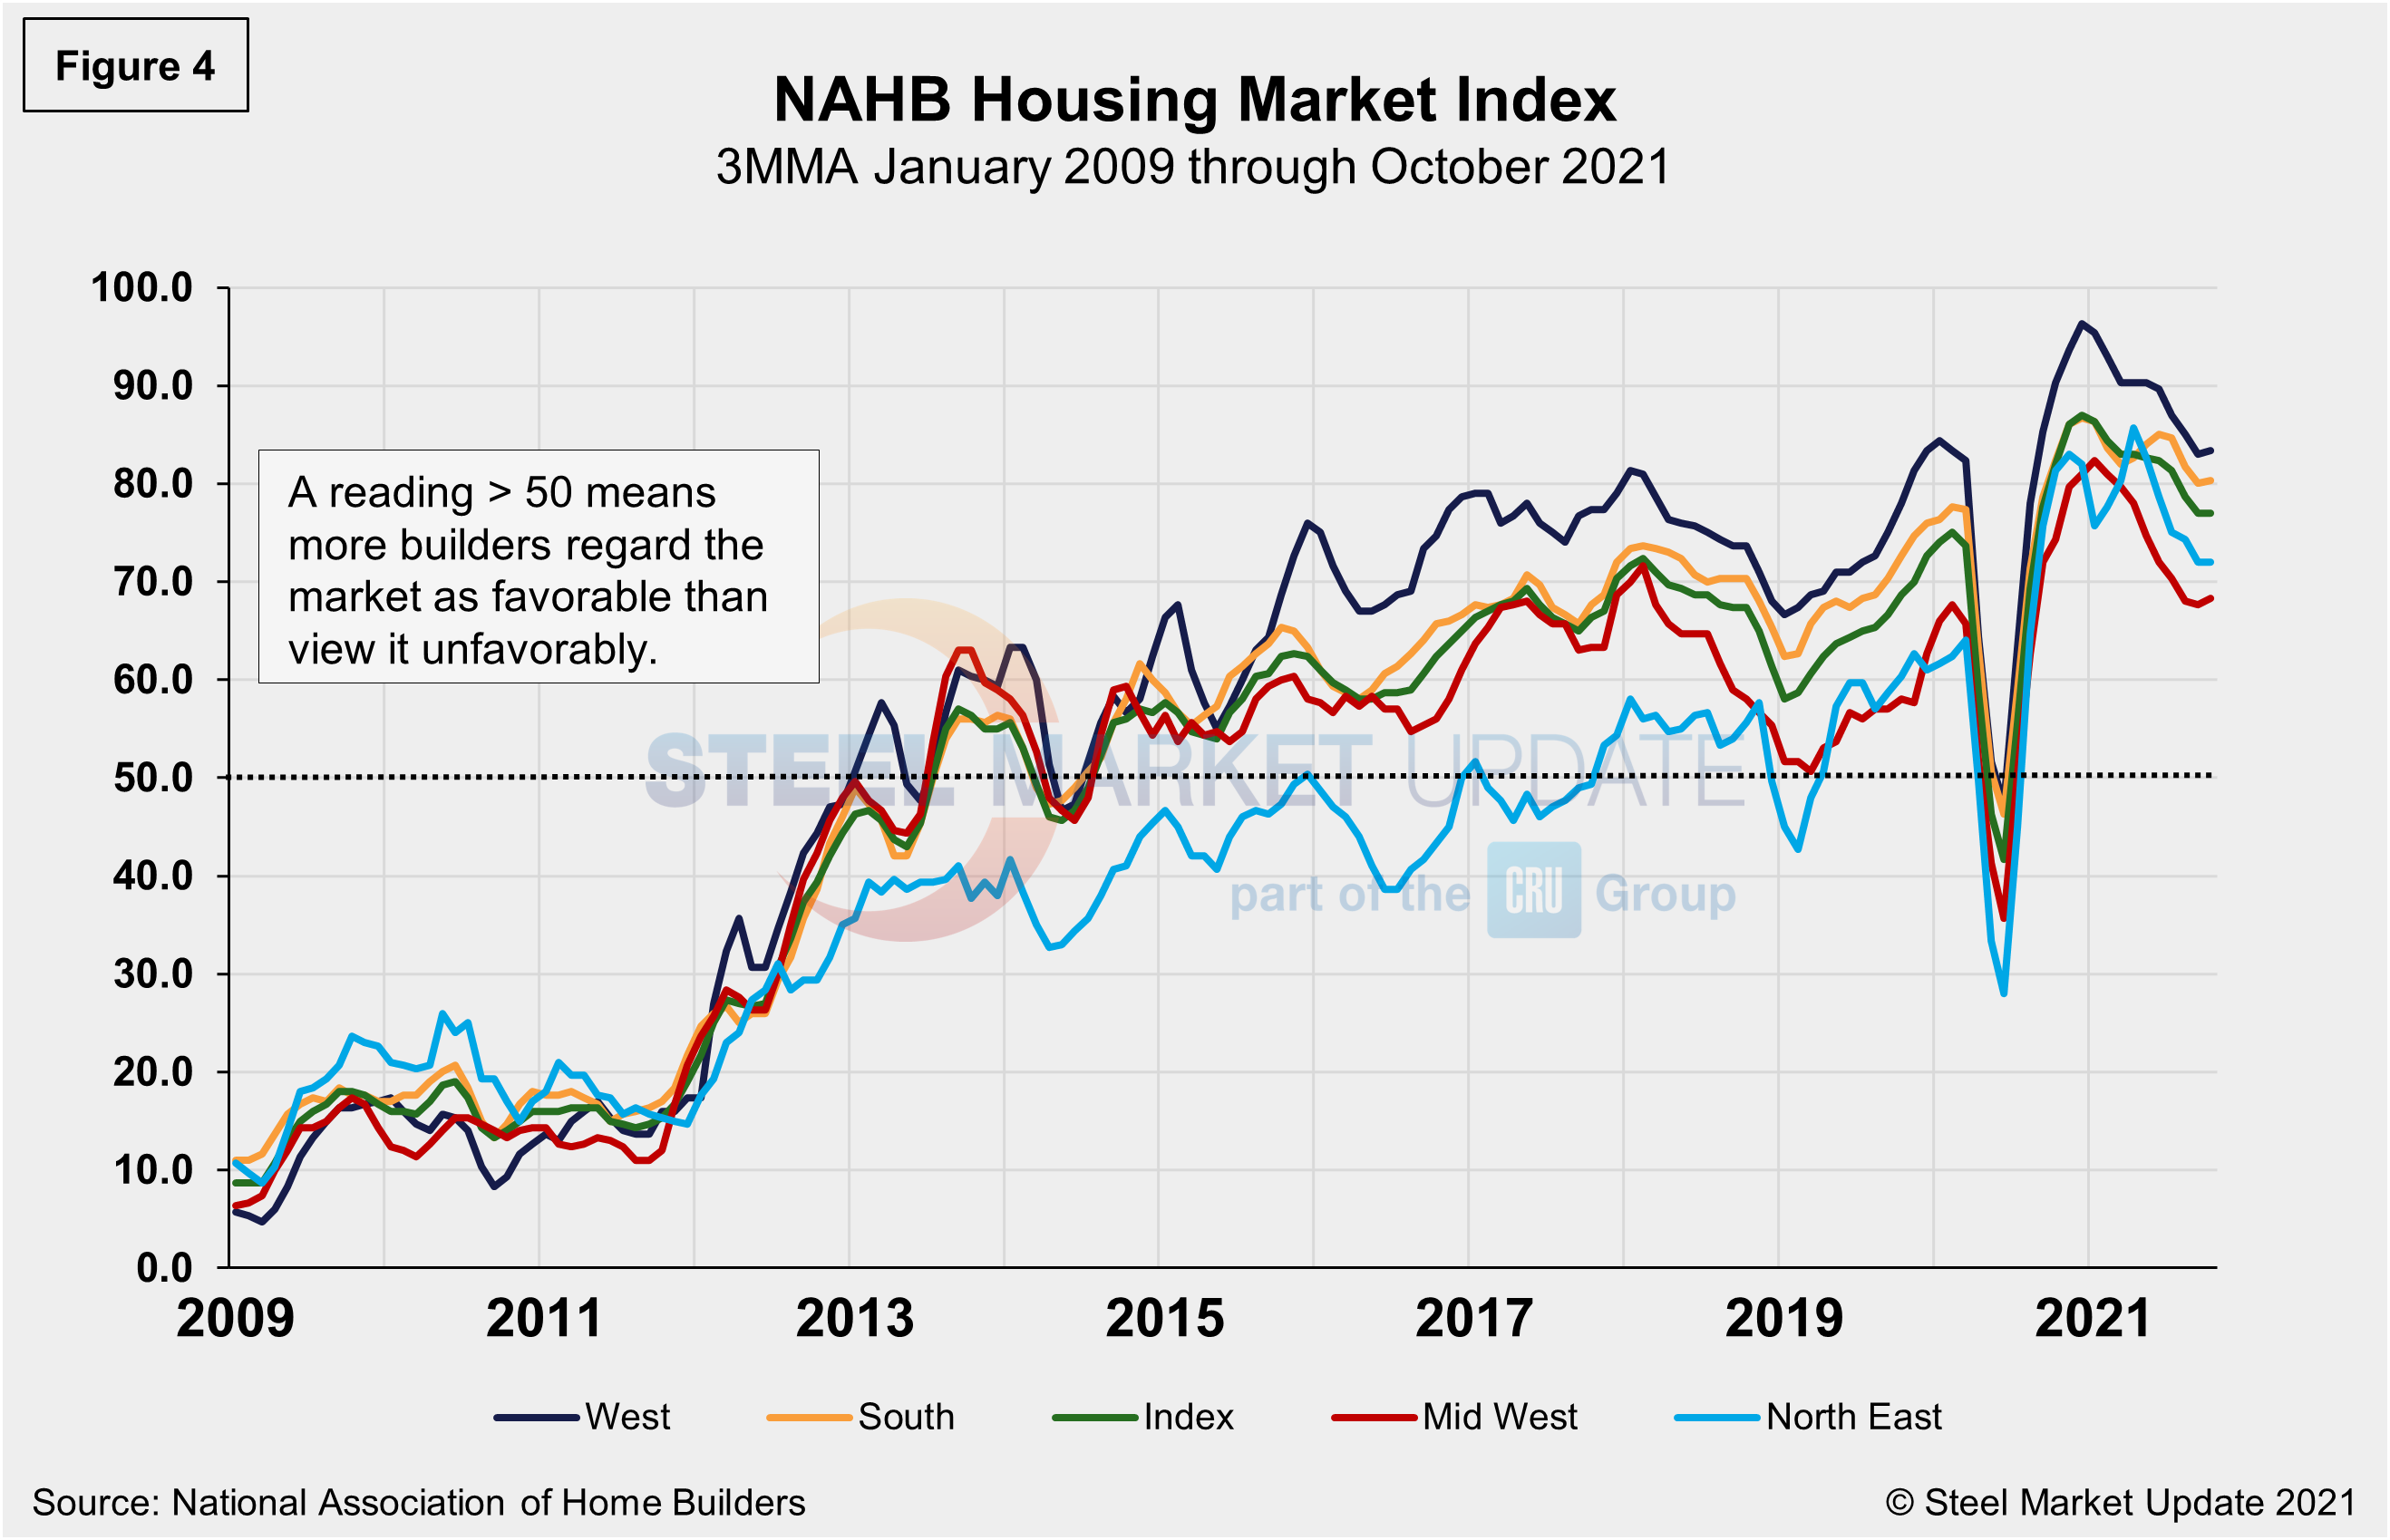
The National Association of Home Builders Optimism Index nearly crashed in April 2020 at the onset of COVID-19, but recovered well through December last year. Since the beginning of 2021, optimism among home builders has been tempered by the high costs of lumber and other building materials and the shortage of skilled labor. The index registered 80 in October, a positive move from 76 the month prior, and rising for the first time in four months. Advance reports indicate that the index may rise further in November (Figure 4).
State and Local Construction
Spending on public construction projects rose 1.8% in October to $353 billion after slipping 0.7% in September. Outlays in private nonresidential spending inched up 0.2%. However, for the first 10 months of 2021 combined, nonresidential spending trailed the January-October 2020 total by 4.7%, with mixed results by type.
Combined private and public spending on electric power and oil and gas projects – the largest nonresidential segment – declined 0.6% for the month and lagged 2020 year-to-date by 1.7%. But the other large categories all rose in October. Highway and street construction spending increased 2.4% for the month, and education construction rose 0.2% in October.
Commercial construction – comprising warehouse, retail, and farm structures – was nearly unchanged from September to October, but was 1.9% higher for the first 10 months combined than in January-October 2020.
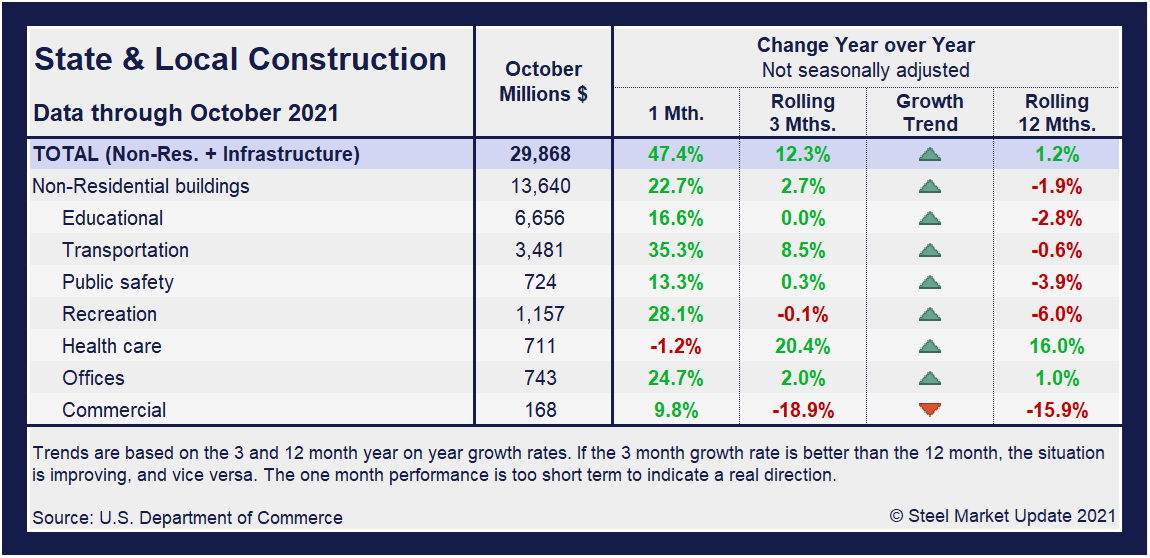
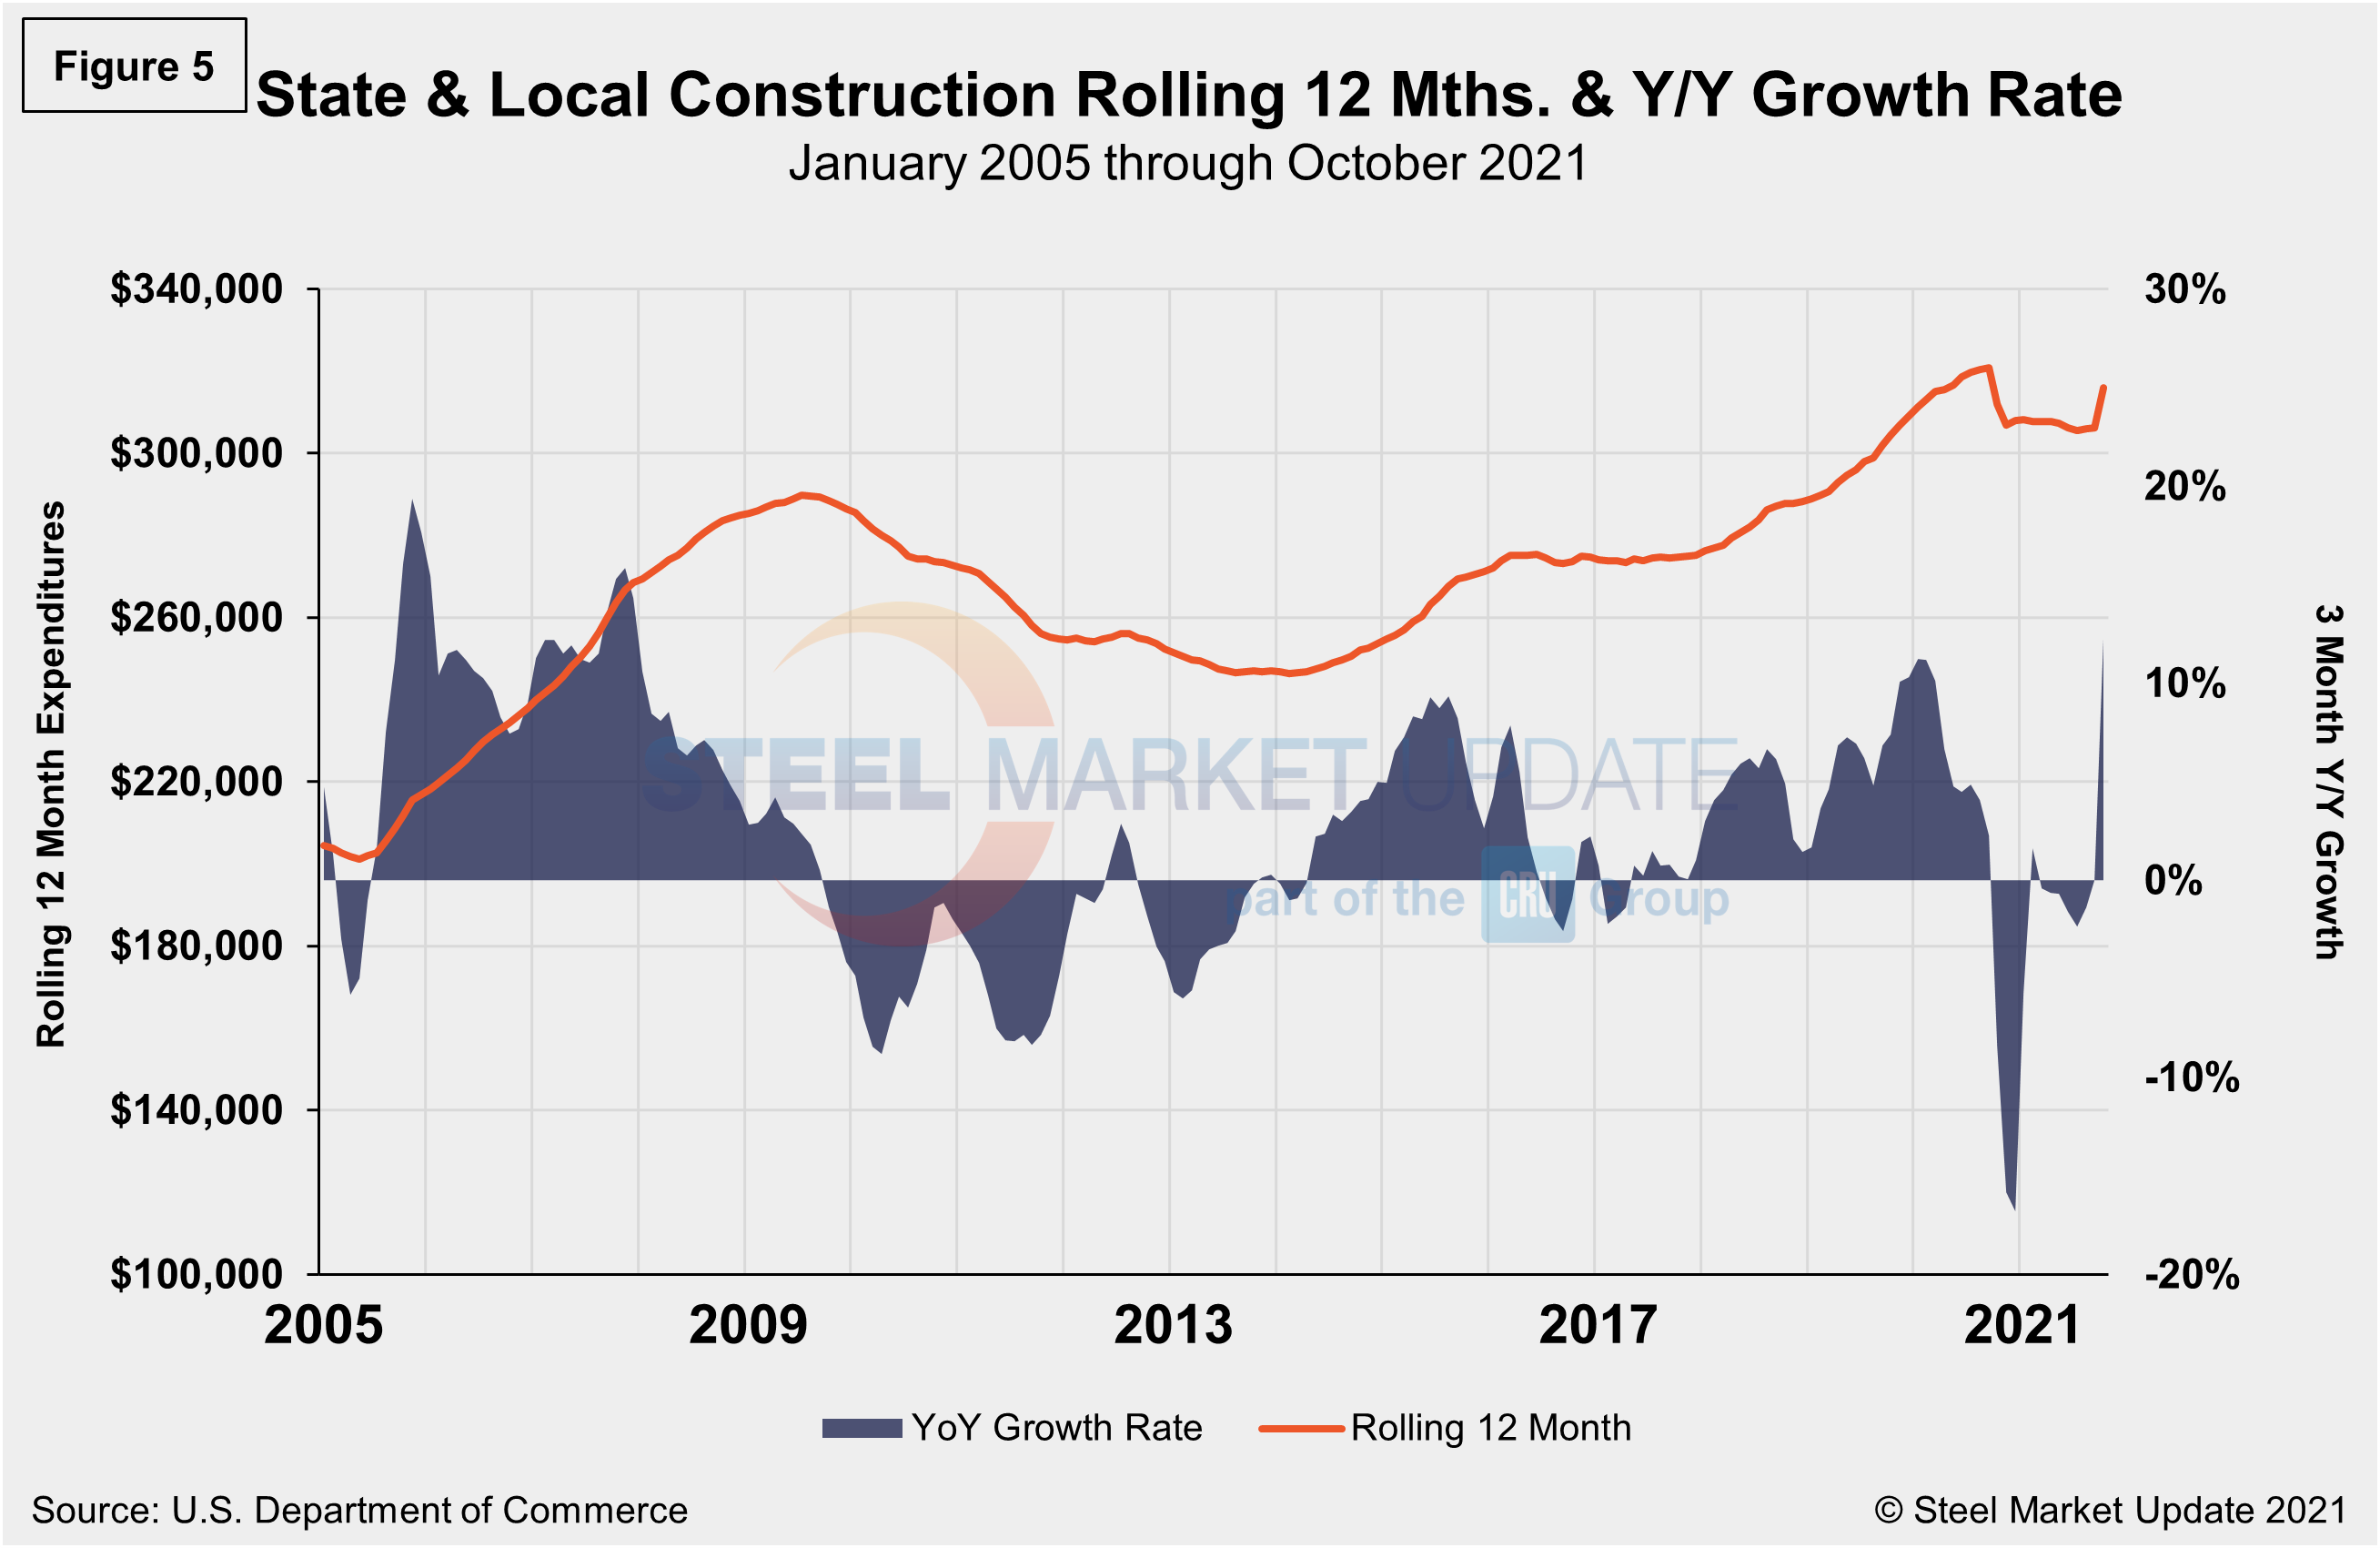
In three months through October, overall state and local construction was up 12.3%, a vast improvement from the month prior when the sector was even. Education, transportation and public safety, though still lagging pre-pandemic levels, are the subcategories currently trending up. Figure 5 shows the history of total S&L expenditures.
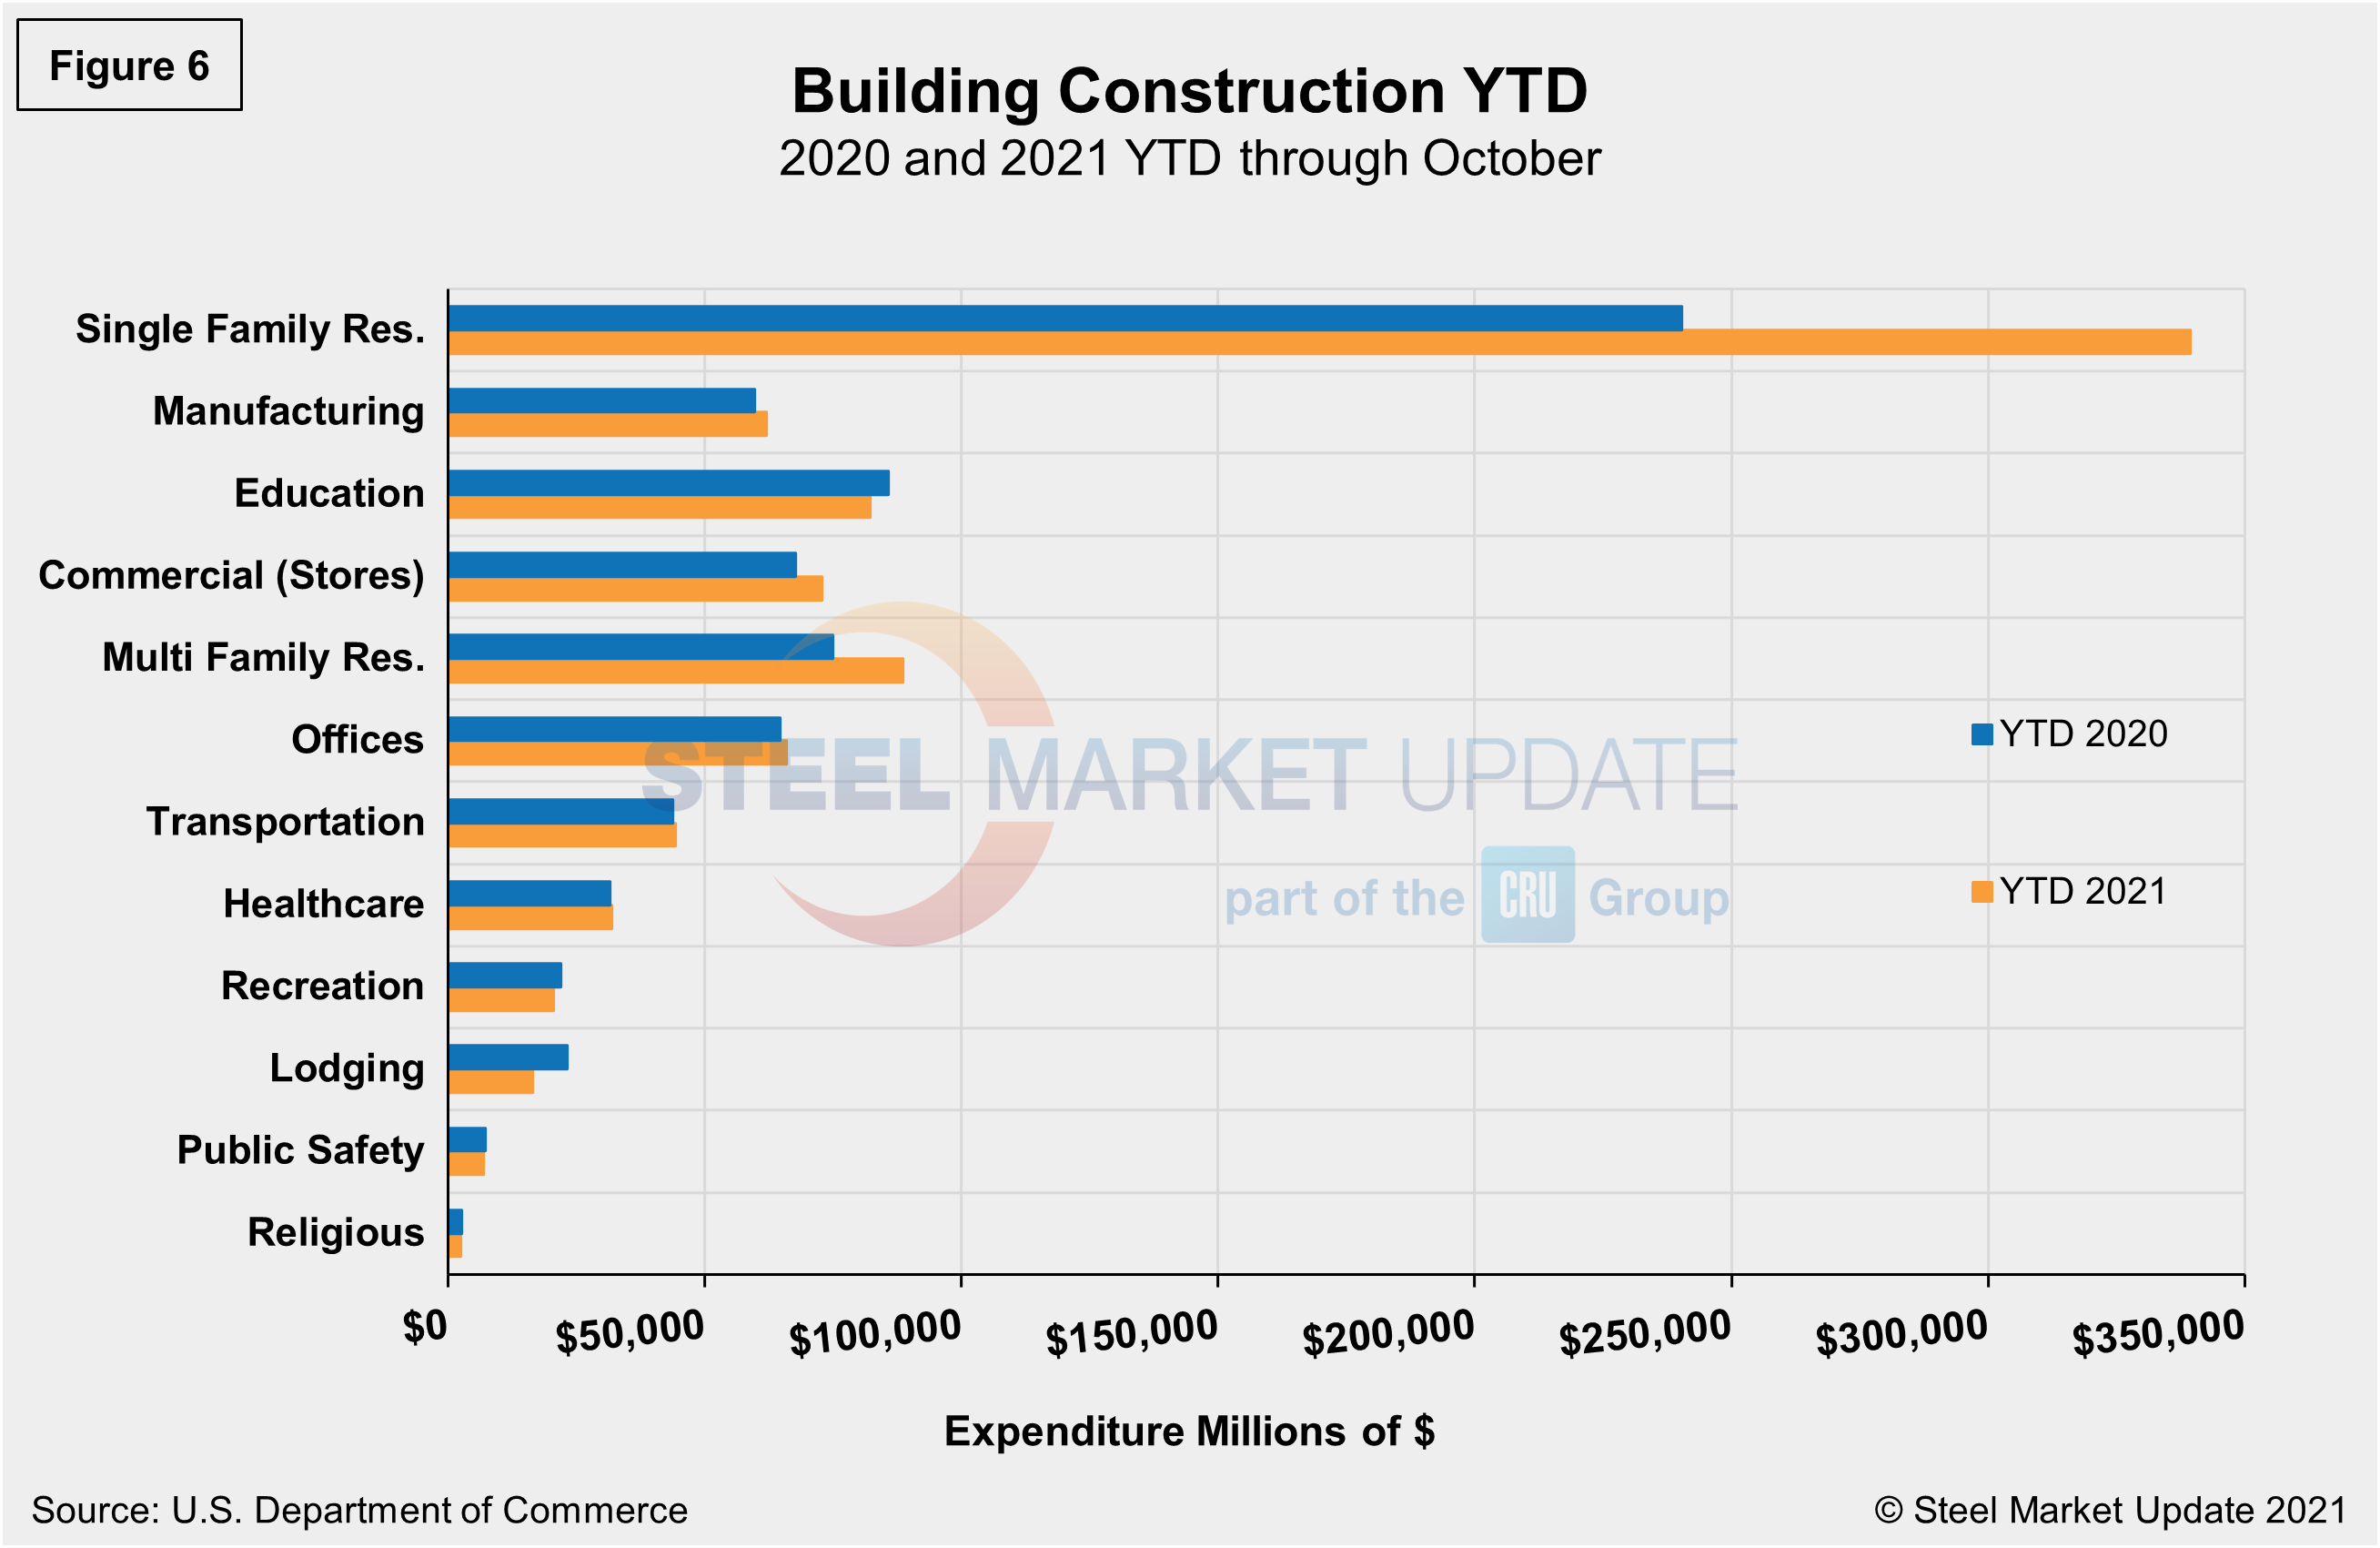
Year-to-date expenditures for construction of the various building sectors for 2020 and 2021 are compared in Figure 6. Single-family residential construction was dominant in 2020 with expenditures totaling an annualized $301.9 billion. To date, 2021 has been the same. Through October, expenditures for single-family construction were $339.4 billion, exceeding 2020’s total and 41.2% above year-ago levels when expenditures were $240.4 billion. Multifamily residential at 18.3%, commercial at 7.6%, and manufacturing at 3.9% are the only other subsectors experiencing year-to-date expansion compared to the same year-ago period. Lodging is behind by double digits at 29.2% year on year, followed by recreation and education, down 6.5% and 4.1%, respectively.
Explanation: Each month, the Commerce Department issues its Construction Put in Place (CPIP) data, usually on the first working day covering activity one month and one day earlier. There are three major categories based on funding source: private, state and local, and federal. Within these three groups are about 120 subcategories of construction projects. SMU analyzes the expenditures from the three funding categories to provide a concise summary of the steel-consuming sectors.
By David Schollaert, David@SteelMarketUpdate.com