

Market Data

July 15, 2021
SMU Key Market Indicators: Small But Positive Moves
Written by David Schollaert
Steel Market Update’s latest analysis of monthly Key Market Indicators highlights that the road to recovery from the COVID-19 doldrums is far from over. Markers for the Present Situation have contracted a bit while Trends show small but positive moves from a month ago. The markers are not necessarily an evaluation of the economy’s journey from affliction to health because of the pandemic, but rather a holistic assessment of the current state of affairs.
SMU’s Key Market Indicators include a host of data on the economy, raw materials, manufacturing, construction, and steel sheet and long products, offering a snapshot of current sentiment and the near-term expected trajectory of the economy.
In the latest data, 7 of the 38 Present Situation indicators are negative, compared to the month prior when only 3 of the 38 Present Situation indicators were negative, a first since February 2020. At its worst, 18 of the 38 indicators shifted negative last year as the economy struggled with COVID-related disruptions. Even though current measures are far from the downturn seen roughly 18 months ago, the improvements have decelerated.
SMU’s Present Situation and Trends analyses in the table below are based on the latest available data as of July 16, 2021. Readers should regard the color codes in the “Present Situation” column as a visual summary of the current market condition. The “Trend” columns are also color coded to give a quick visual appreciation of the market’s direction. All data included in this table was released within the past month. The month or specific date to which the data refers is shown in the second column from the far right. Click to expand the table below.

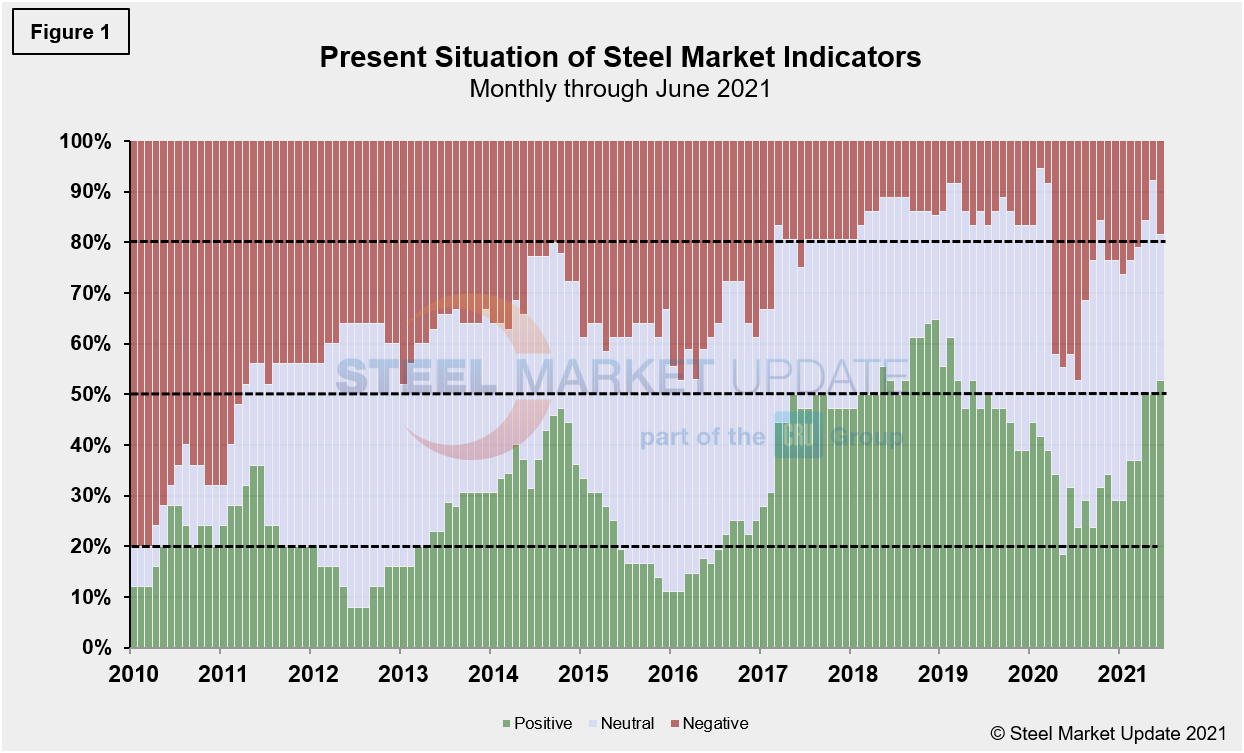
Present Situation
SMU’s Present Situation indicators below show that the road to recovery has been anything but smooth. The month-on-month shift was telling. Positive indicators rose from 19 to 20, negative indicators turned from 3 to 7, but what may be more telling is that the 16 neutral indicators last month mostly shifted negative and are presently at 11.
Although the recent rise of a new variant in COVID-19 cases in some pockets of the U.S. has added some uncertainty, other factors such as the marginally increased unemployment rate and an accelerated inflation rate in June may be playing a role in the marketplace’s hesitations. The Labor Department said last month’s consumer price index increased 5.4% from a year ago, the highest 12-month rate since August 2008.
Present results show a negative shift when compared to last month’s data due to the rise in negative totals. Nevertheless, 81.6% of the population still sees the marketplace as favorable.
Our most recent assessment indicates that 18.4% see the market’s present situation as negative, a notable deterioration from just 7.9% the month prior. Neutral fell from 42.1% to 28.9% during the same period, while positive was largely unchanged at 52.6% from 50.0%. Our monthly assessment of the Present Situation since January 2010 on a percentage basis is shown in Figure 1.
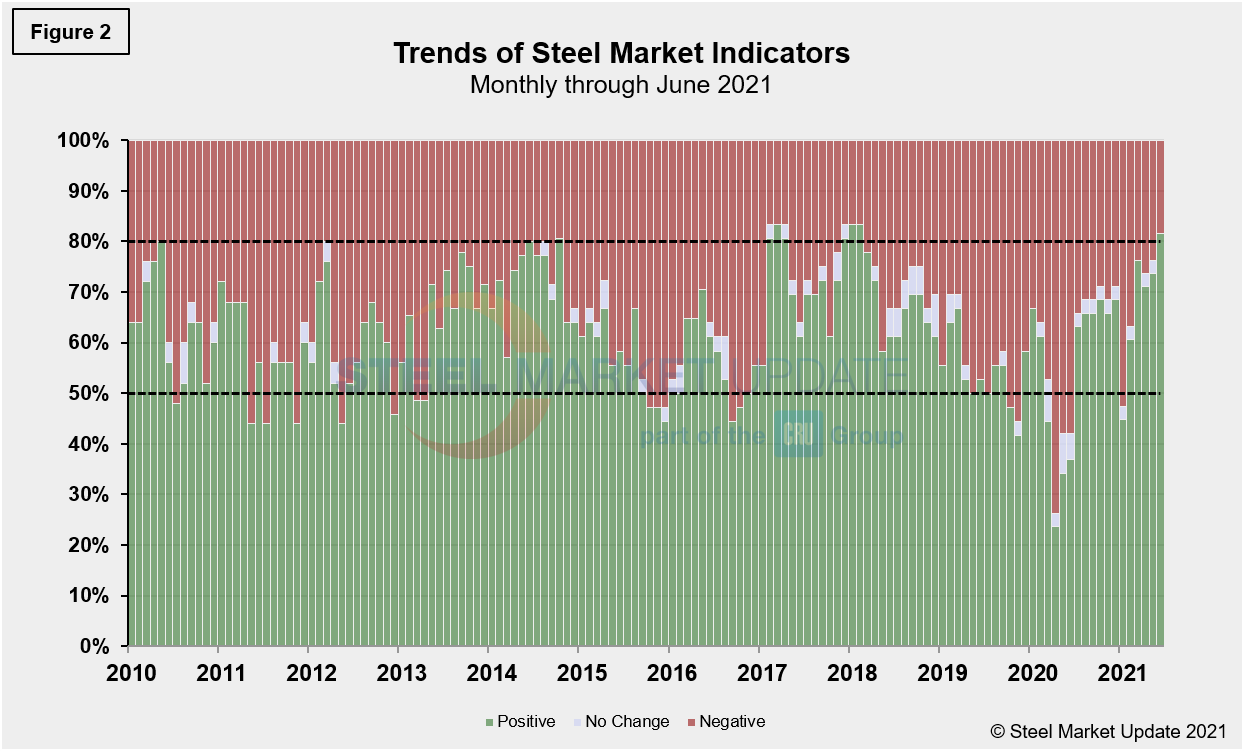
Trends
Unlike the Present Situation, SMU’s Trends indicators saw a slight positive move. Despite the current increase in coronavirus cases in some parts of the country, most of the nation is lifting health-related restrictions and pushing towards greater pre-pandemic normalcy.
Most values in the Trends columns are three-month moving averages (3MMA) to smooth erratic monthly data. Note that in many cases this is not June or July data, but data that was released in June and/or July for previous months. Compared to month-ago data, the negative trend has decreased to 18.4%, compared to 23.7% last month. Additionally, the neutral trend reached the zero mark, down from 2.6% during the same period. The positive trend gained ground from 73.7% to 81.6%. These results are positive and continue to point toward general market improvement, yet suggest there’s still more work to be done. Figure 2 shows the recent movement of the trends and historical movement for comparison.
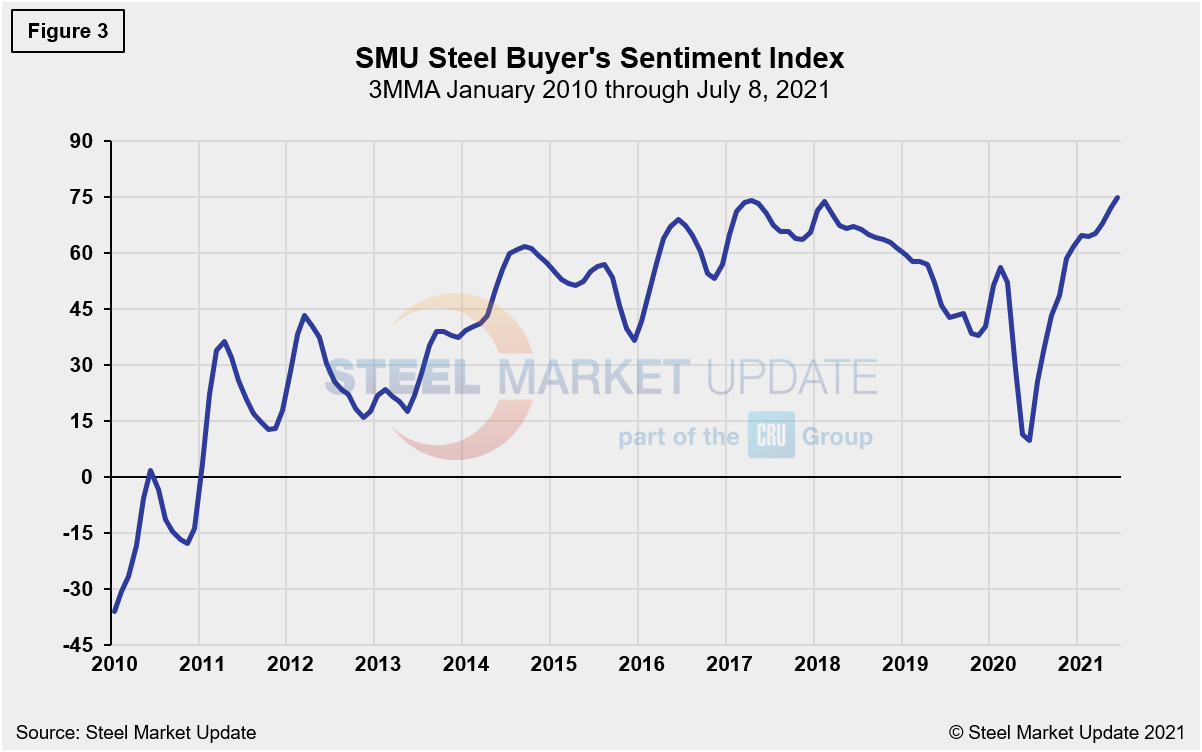
The SMU Steel Buyers Sentiment Index is a measure of the current attitude of North American steel buyers regarding their company’s chances for success in today’s market. The single value of the current sentiment index fell from +58 in early March 2020 to -8 less than a month later. It has since rebounded to a healthy +75 as of July 8. Figure 3 shows the 3MMA of the index since 2010. A reading above the neutral point of zero indicates that buyers have a positive attitude about their prospects. Rising demand and historically high steel prices should keep the Steel Buyer’s Sentiment Index at a highly optimistic level for the foreseeable future.
By David Schollaert, David@SteelMarketUpdate.com


