

Market Data

June 11, 2021
Steel Product Shipments and Inventories Through April
Written by David Schollaert
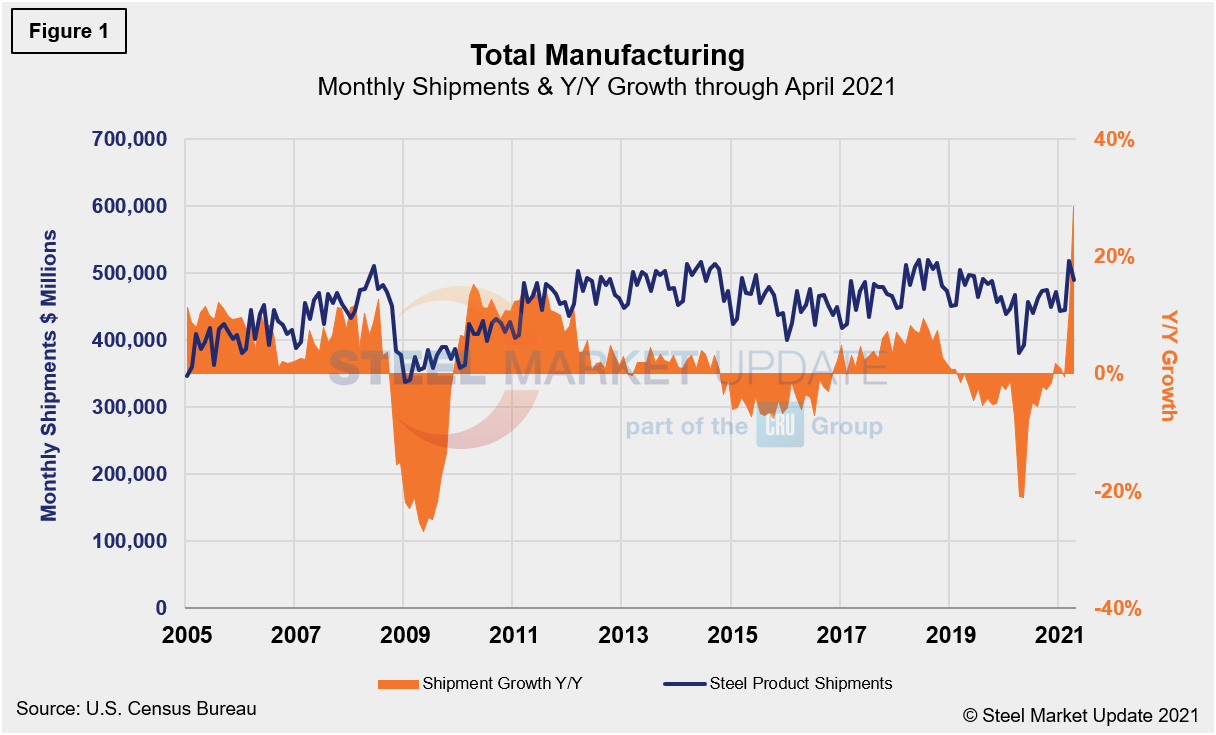
U.S. steel product shipments fell by 2.4% in April following an increase of 15.6% in the month prior. The decline, although disappointing, is not surprising because steel product shipments have been irregular from month to month since bottoming out in May 2020. The lack of consistency has been attributed to seasonal factors at times but points primarily to a recovering marketplace still finding its footing after the COVID-19 pandemic. Shipments of manufactured durable goods saw a similar blip. April steel shipments posted a 5.6% decrease when compared to the month prior but remain above pre-pandemic levels, according to Census Bureau data on inventories, shipments and new orders for total U.S. manufacturing and steel products.
Total shipments and inventories are reported in millions of dollars, seasonally adjusted. Year over year through April, total manufactured product shipments rose by 28.3%. However, year-ago comparisons may be misleading due to the impact COVID-19 on the marketplace. When compared to the same pre-pandemic period in 2019, total manufactured product shipments were up 1.5% in April, a good indication of a recovering market.
Steel product shipments slipped by 2.4% in April when compared to the month prior, a let down from the 15.6% jump seen in March. Figure 1 and Figure 2 show the history of both since 2005. During the first wave of the global pandemic last April, total manufacturing shipments plunged by 19.4% and steel product shipments fell by 21.4% compared with the prior year. Both have steadily recovered since. Manufactured products shipments are up 1.5% while steel product shipments are up 1.6% from the same period in the more typical year of 2019.
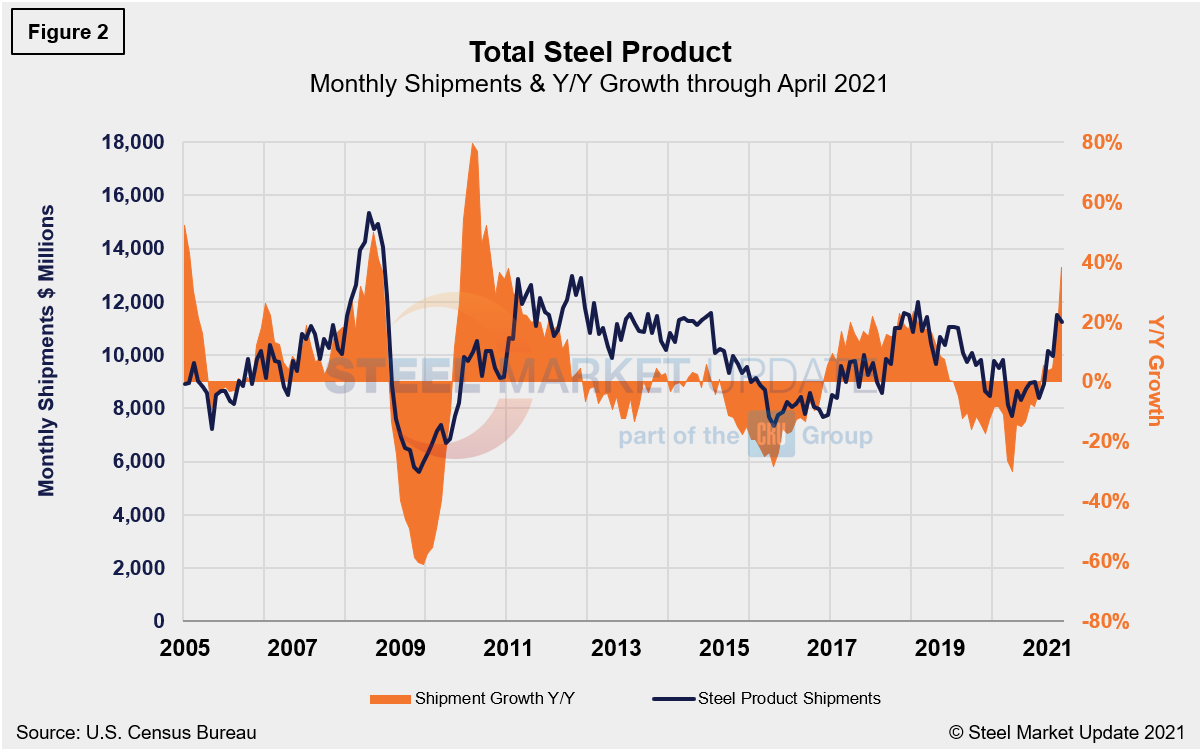
Monthly steel product shipments through April are detailed in Figure 2. Shipments of steel products totaled $11.232 billion inn April, down from $11.504 billion in March, and up from year-ago levels when shipments were $8.126 billion. Shipments of steel products most recently peaked in August 2018 at $11.980 billion, then began a 17-month decline through May 2020. Although the growth rate has declined from 23.6% in July 2018 to 3.8% through January 2021, recent gains have pushed shipments of steel products up 38.2% since reaching bottom last May.
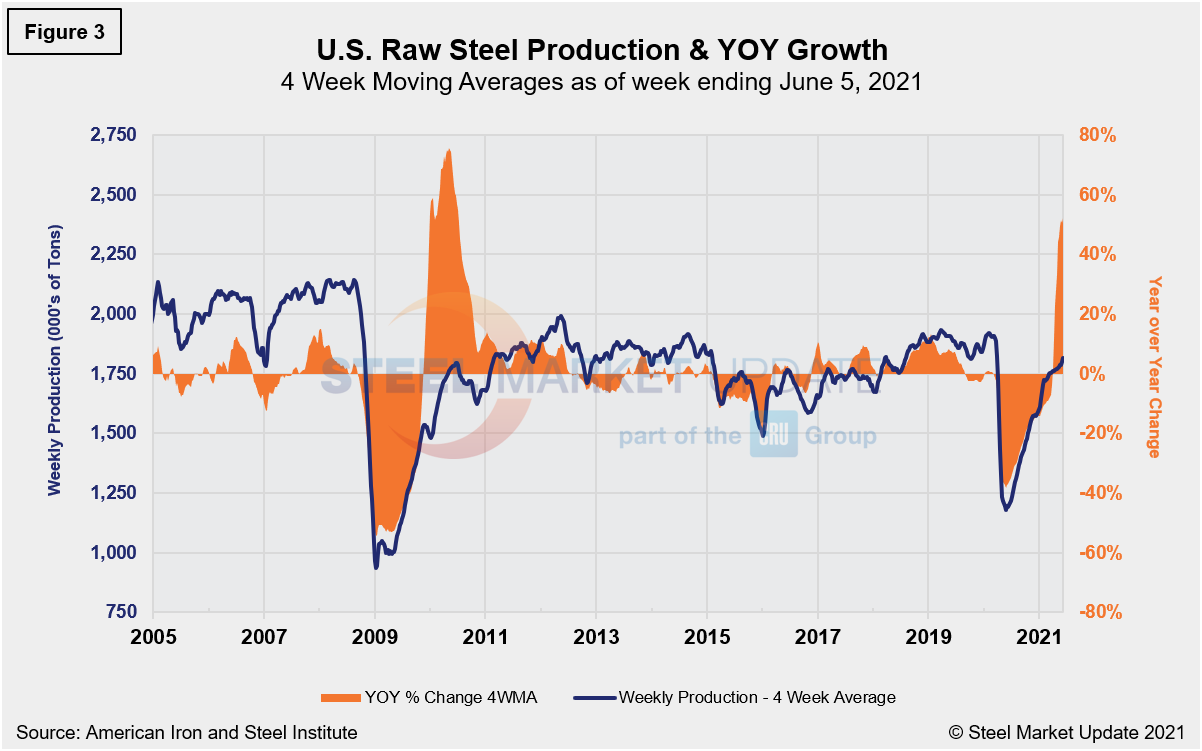
The Census data in Figure 2 compares well over the long term with the American Iron and Steel Institute (AISI) weekly crude steel production shown in Figure 3. Figure 2 is in dollars and Figure 3 is in tons, but they paint a similar picture. Since the freefall following the first wave of the pandemic, steel production has rebounded, according to AISI data shown on a four-week moving average basis. Crude steel production was up 52.3% in the week ending June 5 compared the same period a year ago.
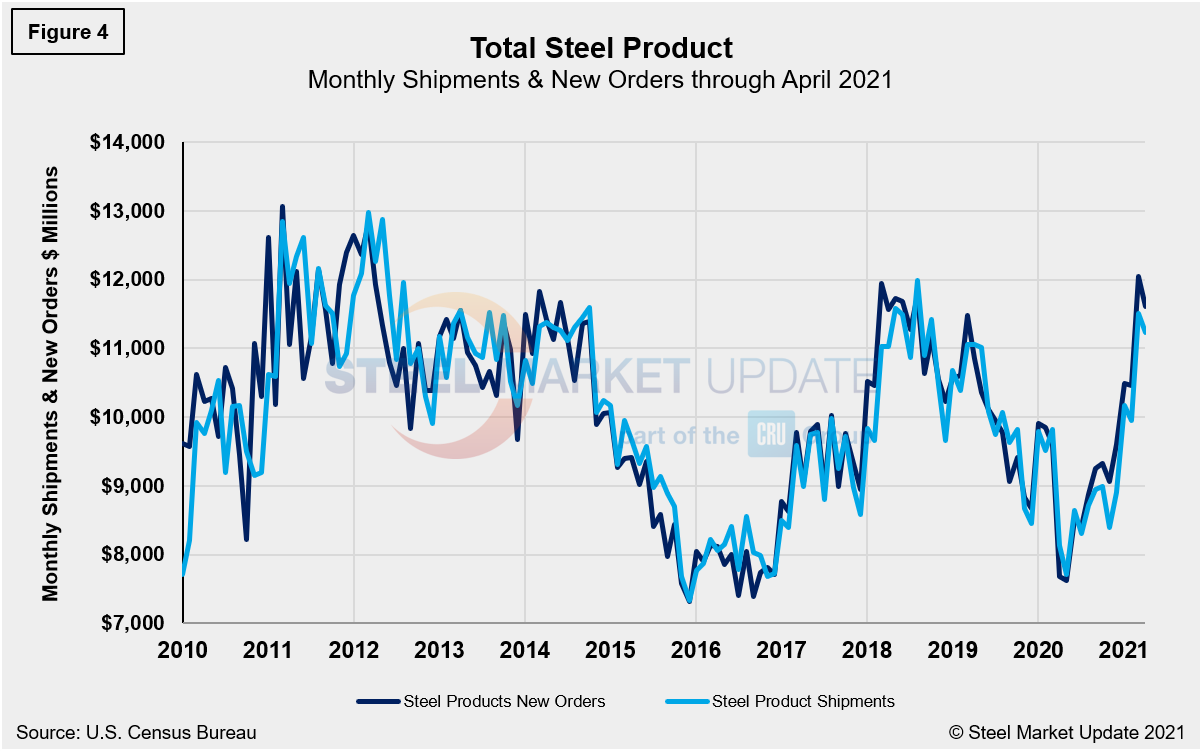
Steel product shipments and new orders on a monthly basis since 2010 are shown in Figure 4. New orders and shipments saw similar declines last April but were back in balance by June. Since, however, new orders have exceeded shipments despite a decrease month on month in April. The curtailment in shipments continues as inventories tighten further and as lead times continue to extend. Despite the recent slip in shipments, the uptrend and tighter gap between new orders and shipments reflects the continued growth in steel demand.
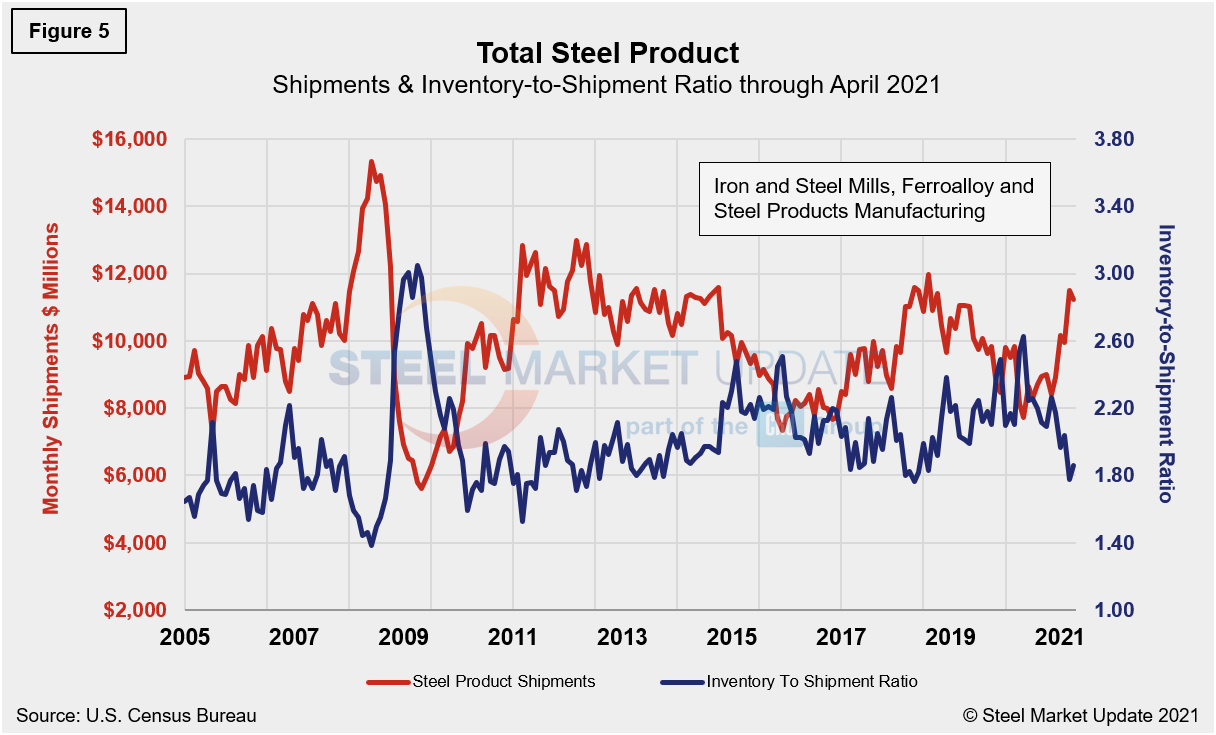
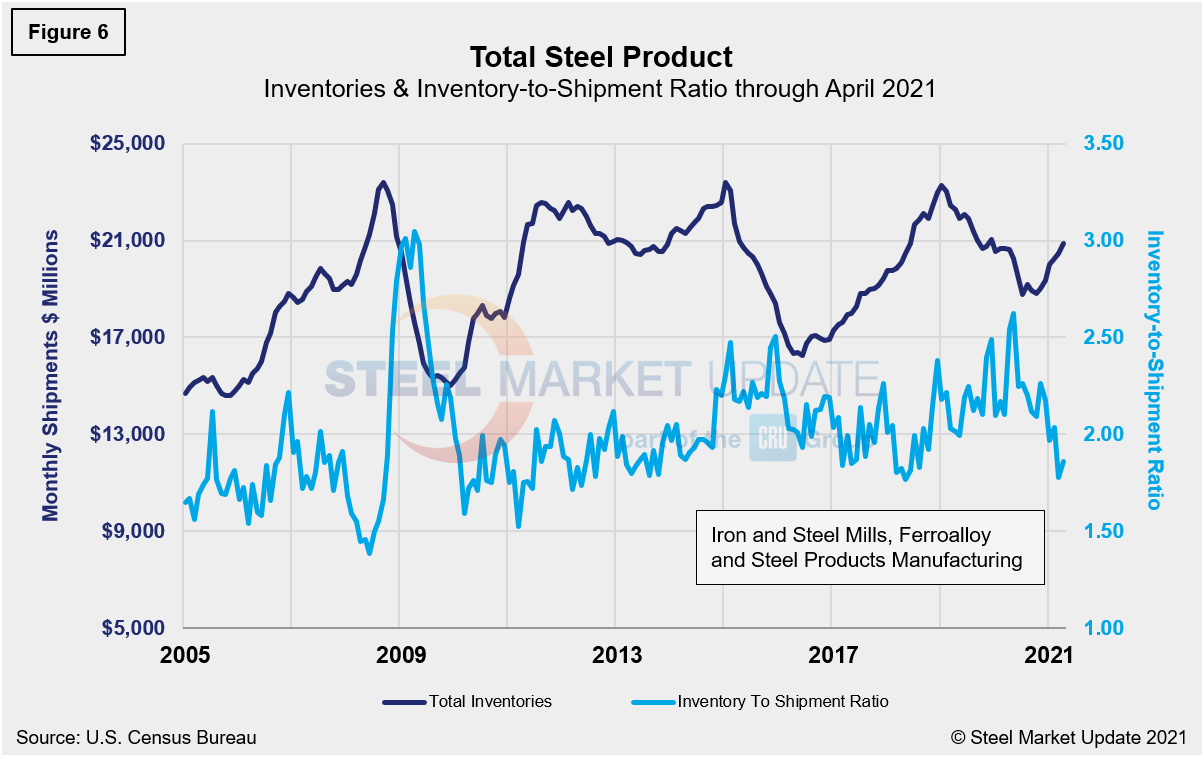
The same total shipment line as in Figure 2 is shown below in Figure 5, but now includes the inventory-to-shipment (IS) ratio. The IS ratio is a measure of how much inventory is necessary to support the level of shipments. Thus the lower the IS ratio, the better. The IS ratio shot up in May 2020 to 2.62% as shipments declined due to shutdowns to stop the spread of COVID-19. Through April, the IS ratio was at 1.86%, up slightly from 1.78% the month prior. The increase, albeit marginal, indicates demand is still outpacing supply. It also reflects weather-related delays and maintenance outages. Inventories were up 2.0% in April when compared to March, while shipments were down 2.4% during the same period. These dynamics highlight a continued tight spot market for steel. Overall, steel shipments have improved by nearly 39.0% since April 2020. Total inventory in millions of dollars is displayed in Figure 6 and echoes the inventory-to-shipment ratio shown in Figure 5.
By David Schollaert, David@SteelMarketUpdate.com


