Market Data

March 26, 2021
Global Steel Production Up in February, But Down in U.S.
Written by David Schollaert
Global crude steel production totaled 150.2 million metric tons in February, up 4.1% from the same month last year, reported the World Steel Association. Despite the positive year-over-year result, February’s total was down 7.8% from January and was the lowest output since July 2020 when monthly production was 155.5 million metric tons. February’s data is notable as it’s the last month that year-over-year figures can be compared without being dramatically skewed by COVID, which hit in March last year.
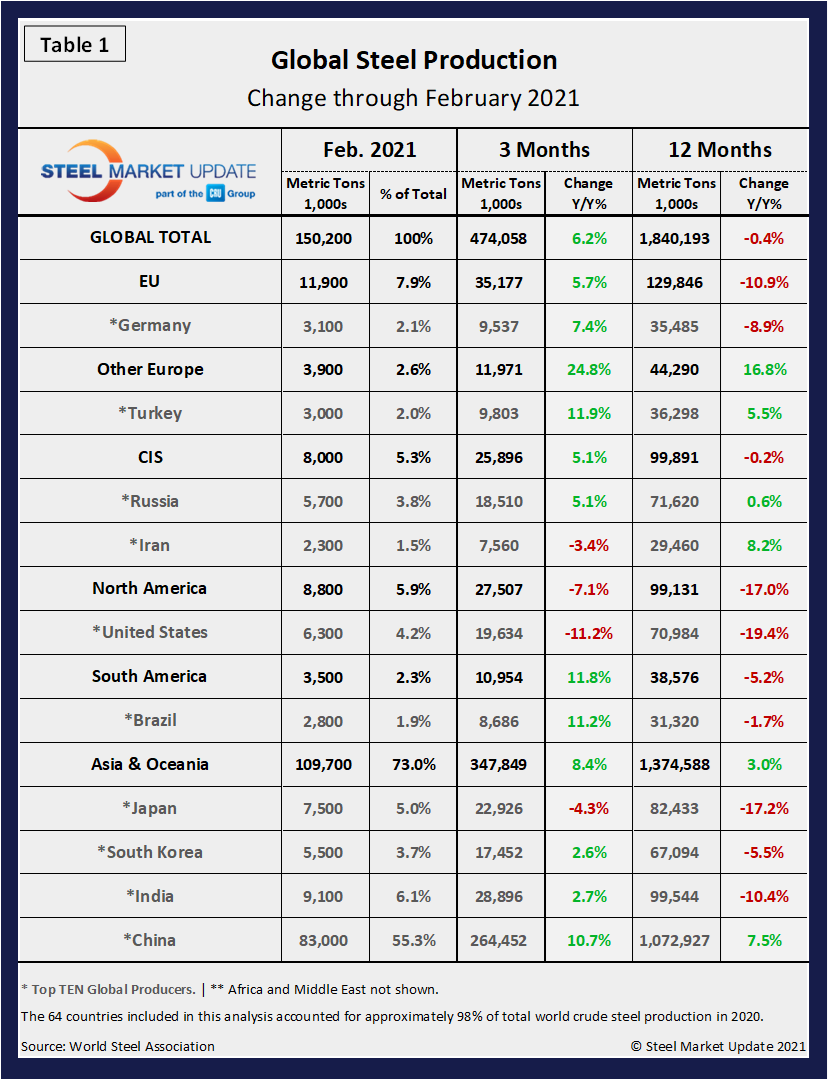
The U.S. was the fourth largest crude steel producer in the world in February, accounting for 6.3 million metric tons or 4.2% of the global total. February’s U.S. production was down by 8.7% when compared to January, and down by nearly 11.0% year on year. China continues to produce more than half of the world’s steel at 55.3% or an estimated 83.0 million tons in February. China’ steel production was down by 8.0% from the prior month but up by 10.9% compared with February 2020.
Although the rebound in world crude steel production has been remarkable considering the global marketplace almost came to a halt in early 2020 due to COVID-19, production seemed to decelerate in February. China, Korea, Turkey, Brazil, and Iran all reported production increases last month compared to year-ago levels. But the U.S., India, Japan, Germany and Russia all saw decreased crude steel output during the same period. Compared to January, all the top 10 global steel-producing countries saw their outputs fall in February, in some cases by nearly 15%.
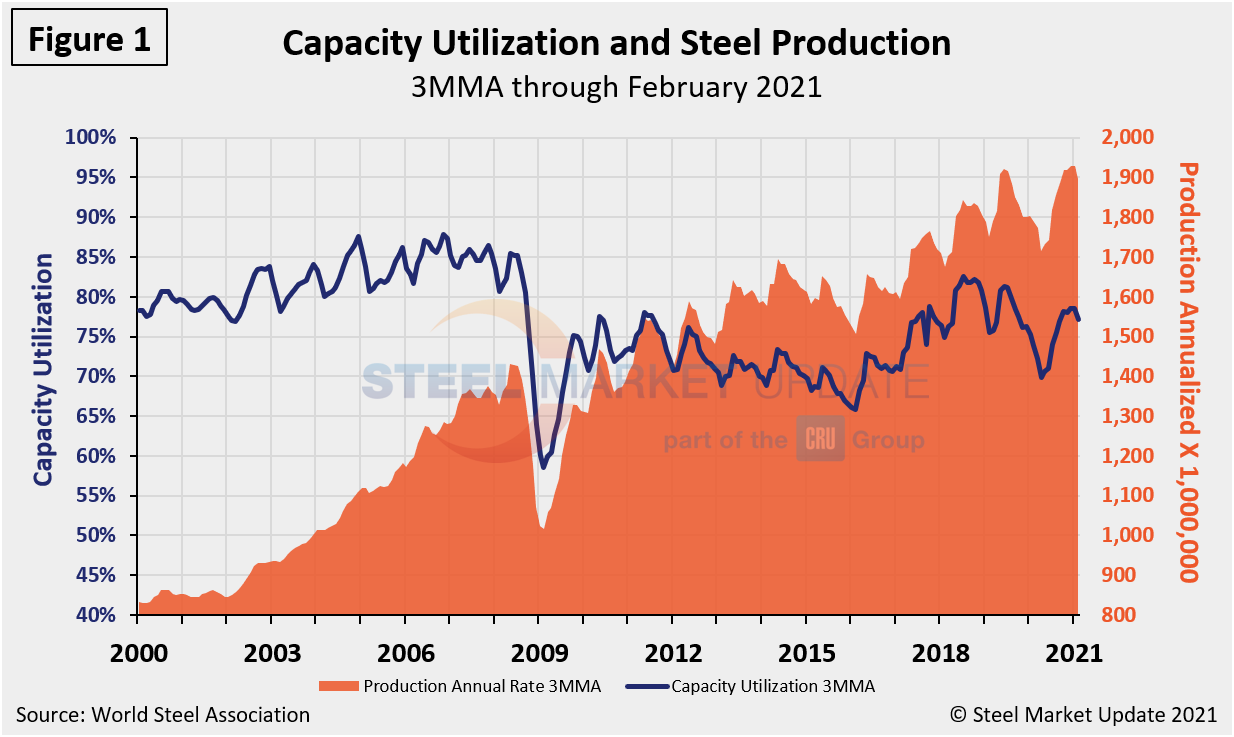
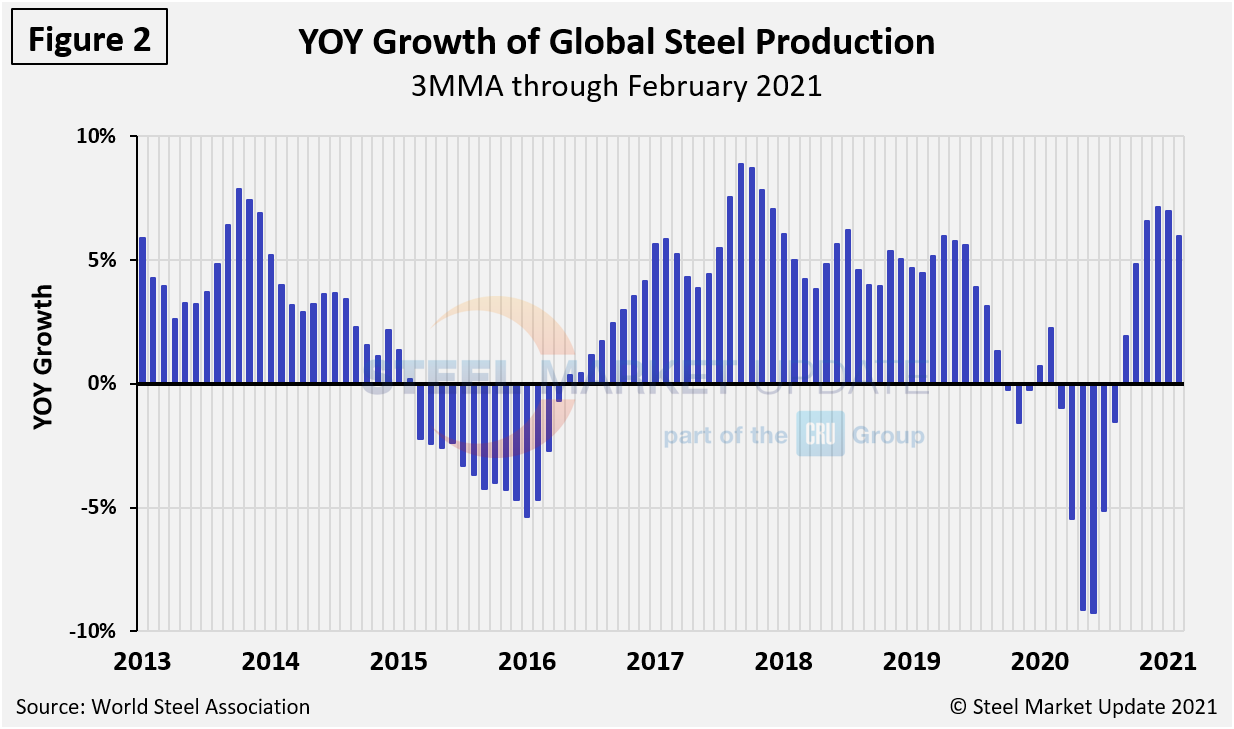
Shown below in Figure 1 is the annualized monthly global steel production on a three-month moving average (3MMA) basis and capacity utilization since January 2000 based on data from the WSA, while Figure 2 shows the year-over-year growth rate of global production on the same 3MMA basis since January 2013. Capacity utilization in January on a 3MMA basis was 77.2%, down from 78.5% the month prior. Three fewer operating days in February contributed to the decreased output. On a tons-per-day basis, production in February was 5.364 million metric tons, up from 5.255 million metric tons the month prior. This pace exceeds the previous record set in June 2019 of 5.318 million metric tons. Growth in three months through February on a year-over-year basis was positive 6.0%, down 1.0% from the month prior.
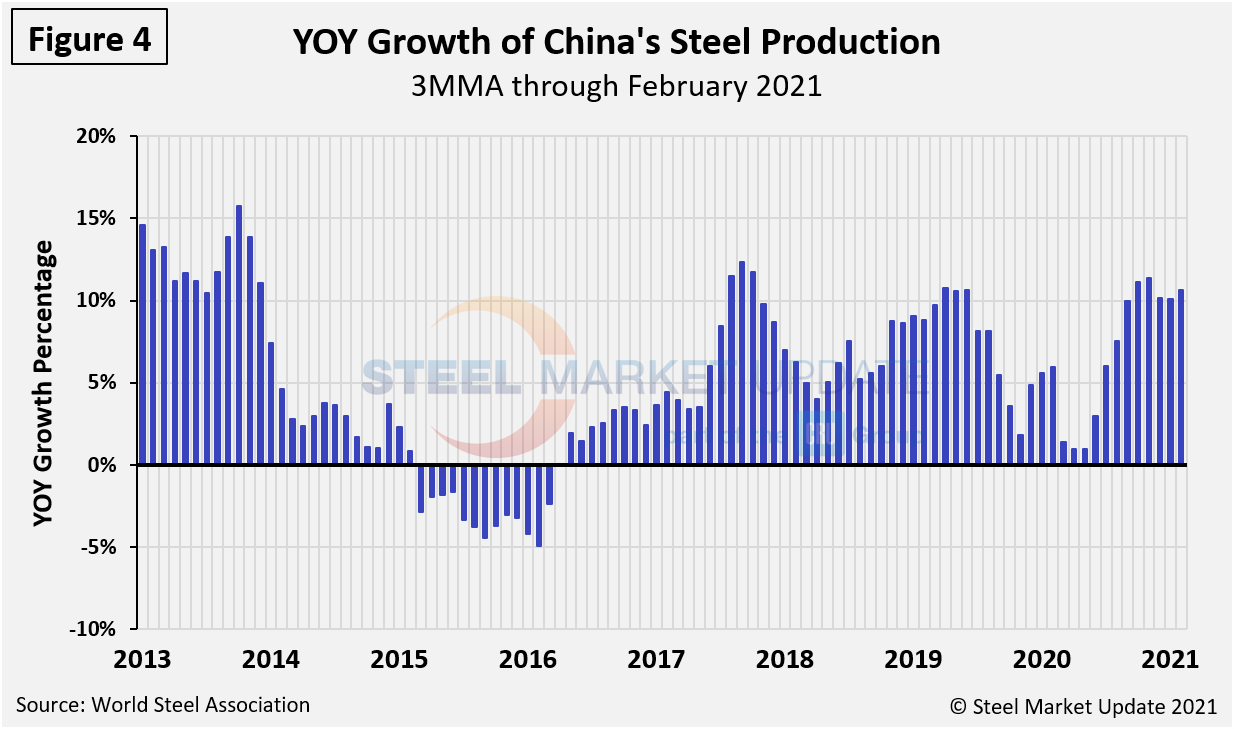
Displayed below in Table 1 is global production broken down into regions, the production of the top 10 nations in the single month of February, and their share of the global total. It also shows the latest three months and 12 months of production through February with year-over-year growth rates for each period. Regions are shown in black font and individual nations in gray. The world overall had positive growth of 6.2% in three months and negative growth of 0.4% in 12 months through February. The market has maintained positive momentum, as the three-month growth rate is higher than the 12-month growth rate. On the same basis in February, China grew by 10.7% and 7.5%, also showing positive momentum. Table 1 shows that North American production was down by 7.1% in the three months through February.
China’s Crude Steel Production
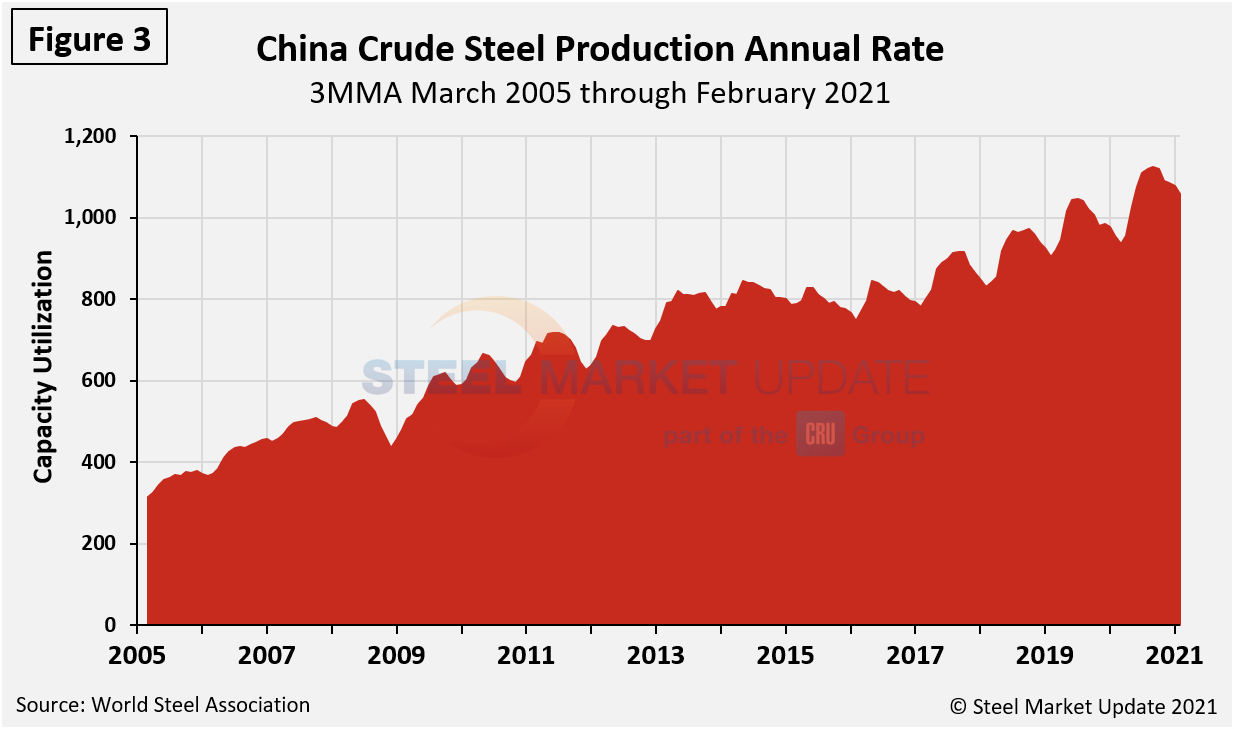
China’s monthly steel production hit an all-time high of 94.8 million tons in August 2020. It has generally declined since, registering 83.0 million tons in February. On a 3MMA basis (Figure 3), the annual rate of China’s crude steel production maxed out at 1.123 billion metric tons in September 2020, but has since dipped to 1.057 billion metric tons through February. China’s capacity is now 1.128 billion metric tons, a reduction from 1.164 billion tons in December 2017. China’s February capacity utilization was 95.1%.
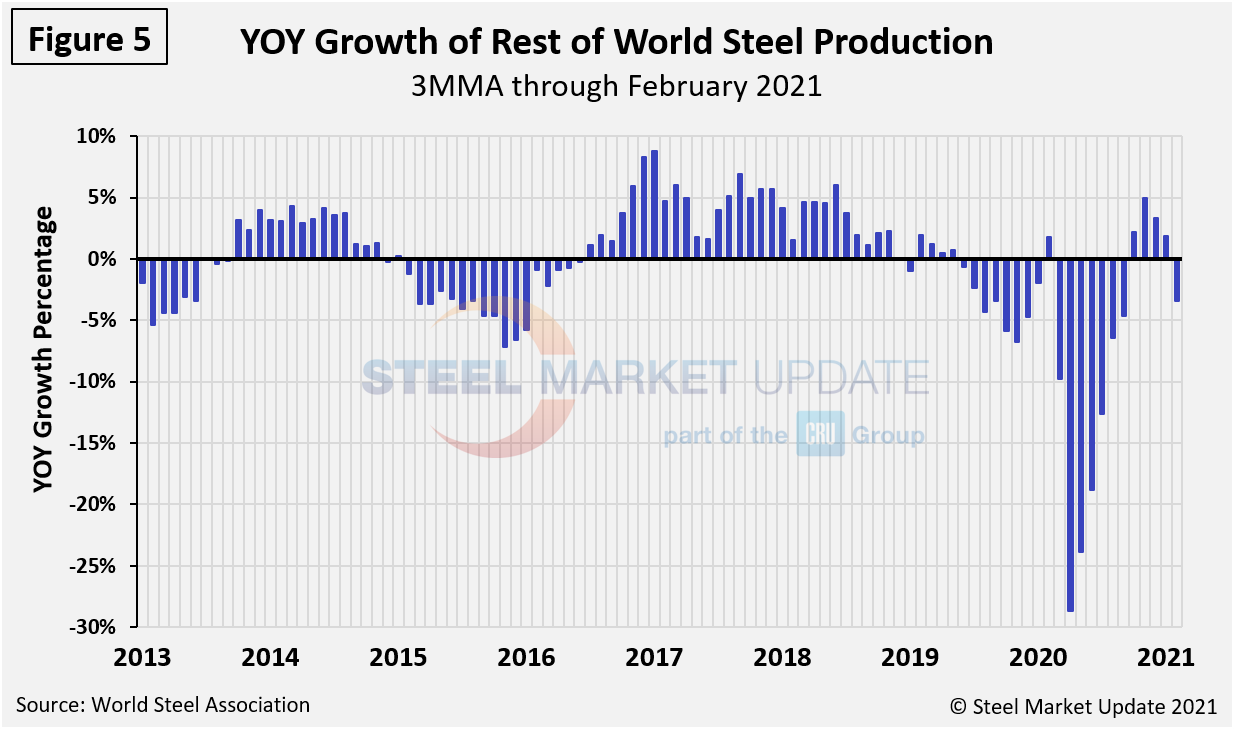
The growth of China’s steel production since March 2013 is shown in Figure 4, while Figure 5 shows the growth of global steel excluding China, both on a 3MMA basis. From November through February, the rest of the world’s production fell by 3.4%, while China grew by 10.7%, both year over year. This was the first negative move by the rest of the world since it contracted by 4.6% in three months through September.
By David Schollaert, David@SteelMarketUpdate.com


