

Market Data

March 9, 2021
U.S. Job Creation Rebounds in February
Written by David Schollaert
The U.S. economy added 379,000 jobs in February, making the first positive move in three months, reported the Bureau of Labor Statistics (BLS). The unexpected increases were driven by large job gains in the nation’s service and entertainment industries as the economy continues to recover. The jobs data was the strongest since October, resulting from a ramp-up in vaccination efforts and the easing of restrictions on businesses as COVID cases moderate. The 379,000 gain follows on a loss of 140,000 jobs in December and a loss of 447,000 jobs in January.
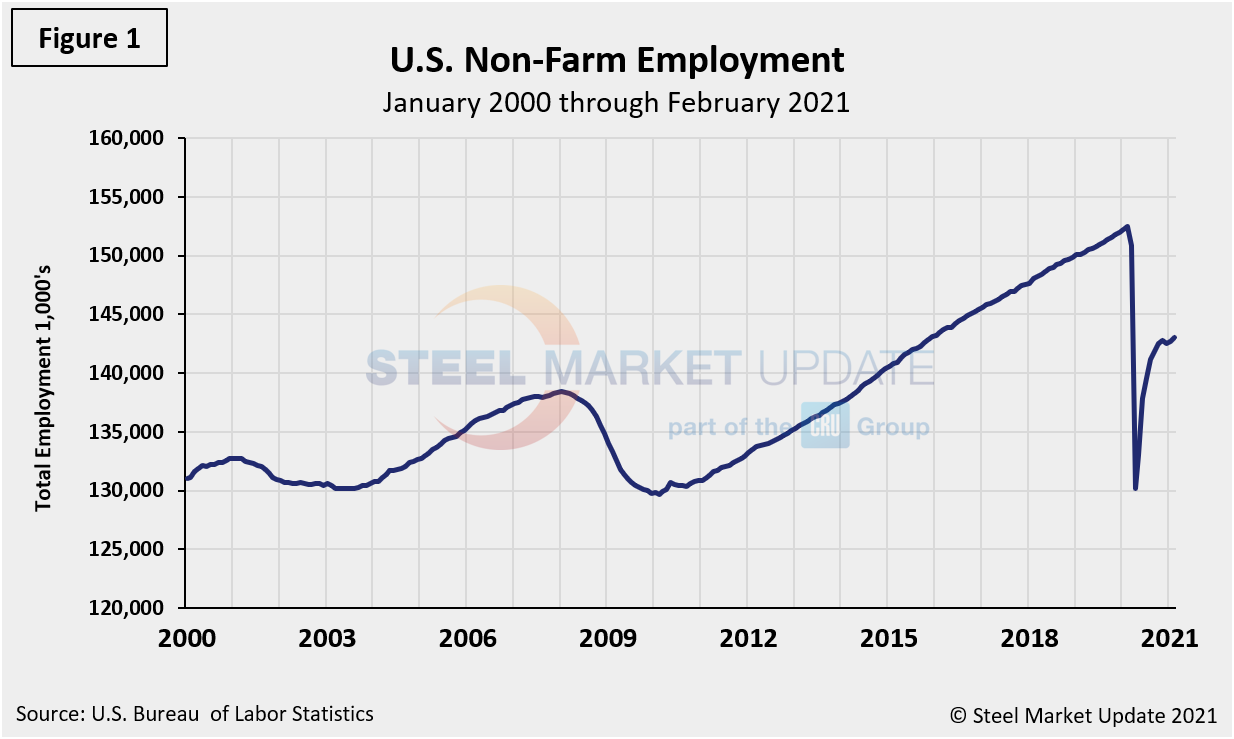
In January, nonfarm employment was still below its pre-pandemic February 2020 level by 9.5 million jobs or 6.2%. Figure 1 shows the total number of nonfarm employed people in the U.S. since 2000.
“The labor market continued to reflect the impact of the coronavirus pandemic,” the BLS stated. “In February, most of the job gains occurred in leisure and hospitality, with smaller gains in temporary help services, health care and social assistance, retail trade and manufacturing. Employment declined in state and local government education, construction and mining.
“In February, employment in leisure and hospitality increased by 355,000, as pandemic-related restrictions eased in some parts of the country. About four-fifths or 286,000 of the new jobs were in food services and drinking places. Employment also rose in accommodations by 36,000 and in amusements, gambling, and recreation by 33,000. Employment in leisure and hospitality is down over the year by 3.5 million or 20.4%, however,” BLS said.
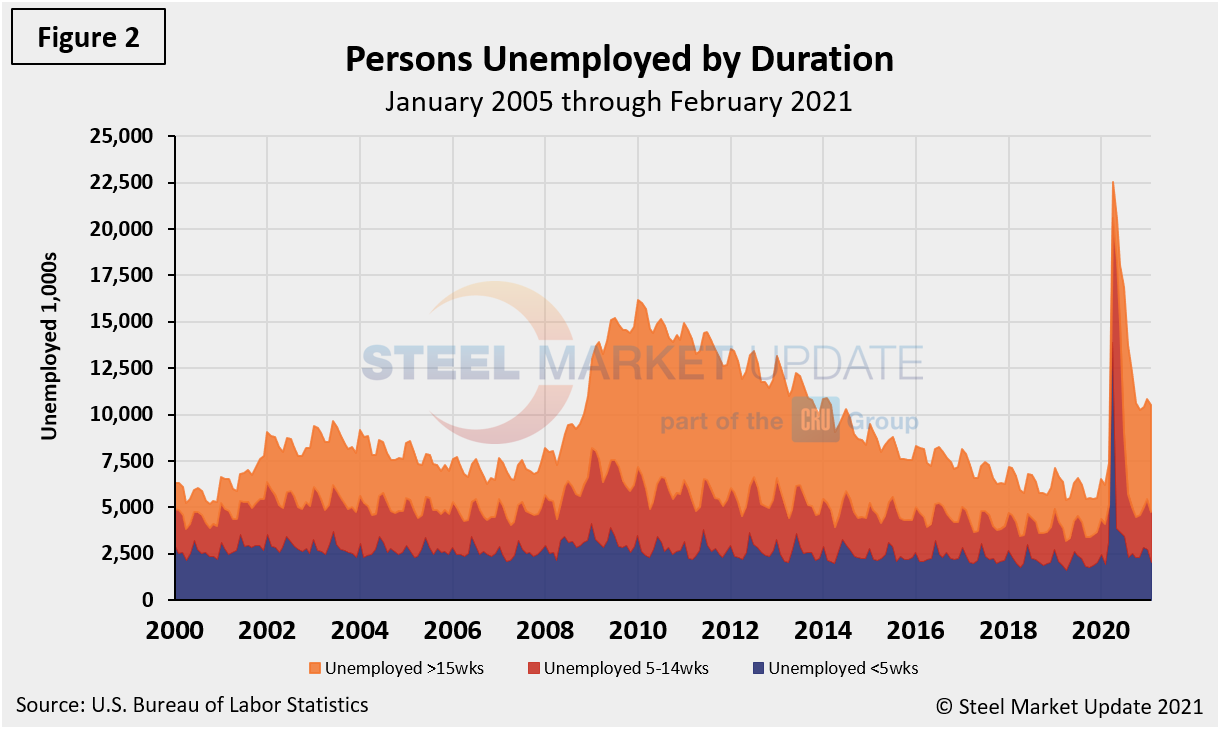
The historical picture for the duration of unemployment since January 2005 is broken down into < 5 weeks, 5 to 14 weeks, and > 15 weeks, noted below in Figure 2. The total number unemployed was 10,486,000 at the end of February, a decrease of 365,000 compared to January, and still 12,018,000 less than May 2020’s historical high. As of March 5, 54.7% had been unemployed for more than 15 weeks, 25.7% for 5 to 14 weeks and 19.6% for less than 5 weeks.
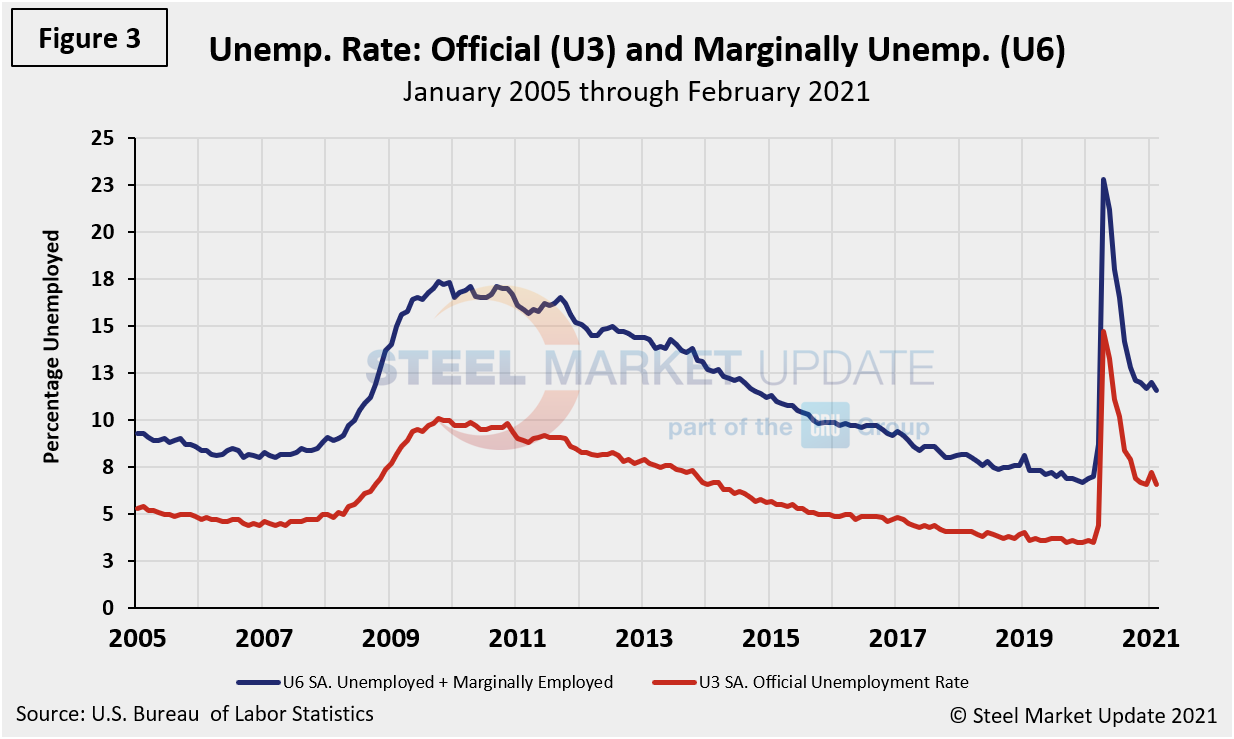
The official unemployment rate, U3, reported in the BLS Household survey (see explanation below) increased from 3.5% last February to 14.7% in April and then declined to 6.6% in January. The more comprehensive U6 unemployment rate, at 11.6% in January, improved from 22.8% last April (Figure 3). U6 includes individuals working part time who desire full-time work and those who want to work but are so discouraged they have stopped looking.
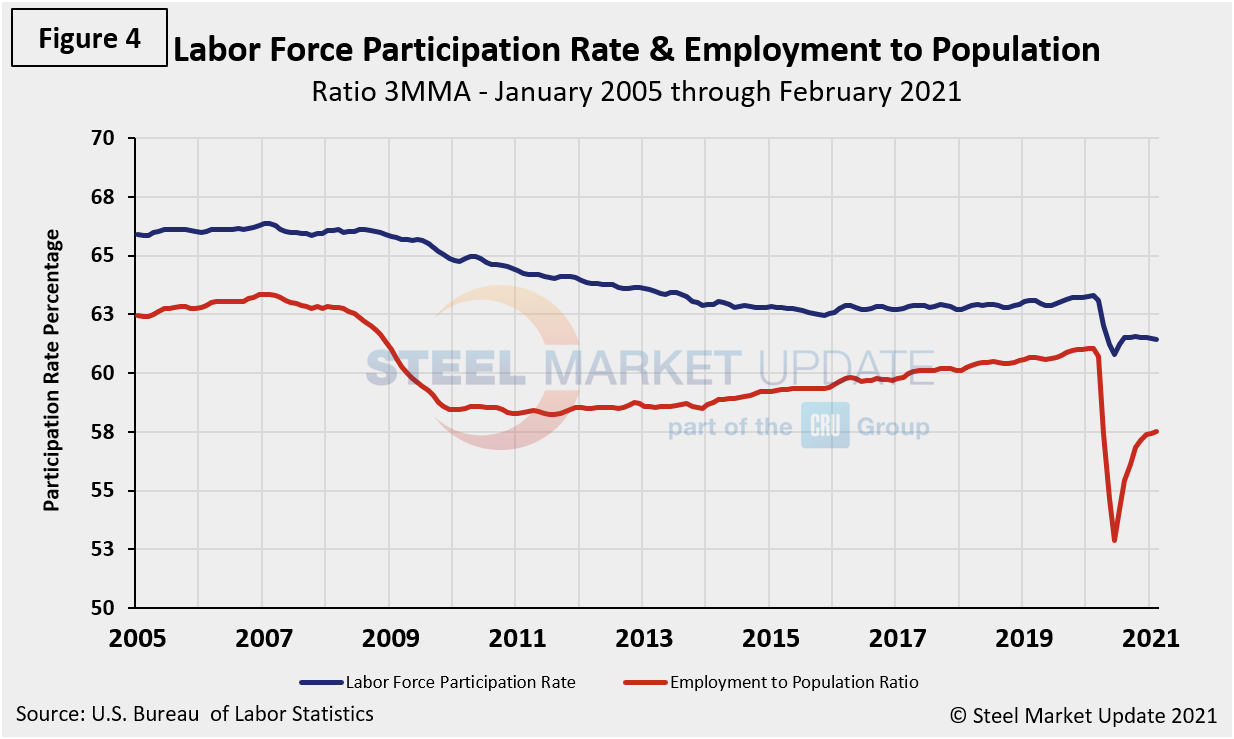
The labor force participation rate is calculated by dividing the number of people actively participating in the labor force by the total number of people eligible to participate. This measure was 61.4% in February, unchanged month on month, but up from 60.2% last April shortly after the pandemic shocked the economy. Another gauge and more definitive view are the number employed as a percentage of the population. Last month, the employment-to-population ratio was 57.6%, a marginal change of 0.1% higher month on month, but up from the low point of 51.3% last April . Figure 4 shows both measures on one graph.
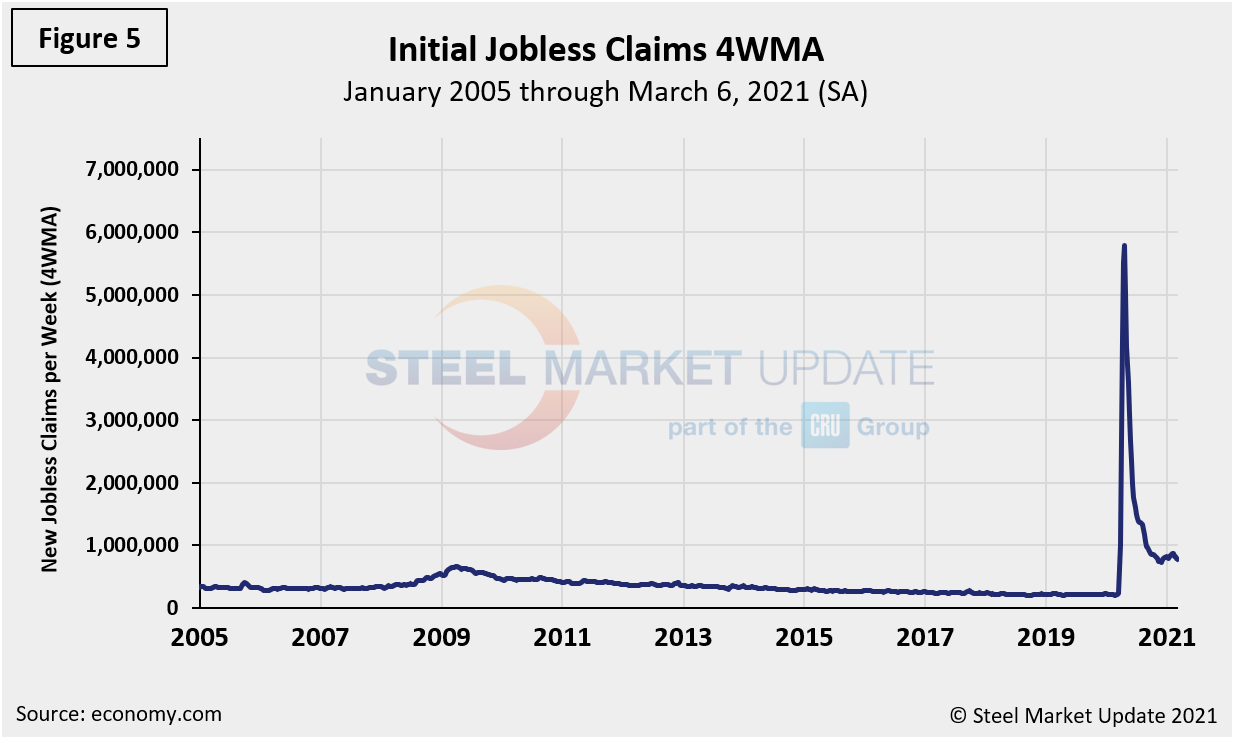
Initial claims for unemployment insurance are reported weekly by the Department of Labor. The pandemic effect began in the week ending March 21, 2020, when new claims shot up from 282,000 in the previous week to 3.3 million. The peak for claims was 6.9 million in the week ending March 28, 2020. Despite some recent fluctuation, claims were at 745,000 in the week ending Feb. 6. Even though new fillings are lower, they remain higher than they were at the peak of the Great Recession. Figure 5 shows the four-week moving average of new claims since January 2007.
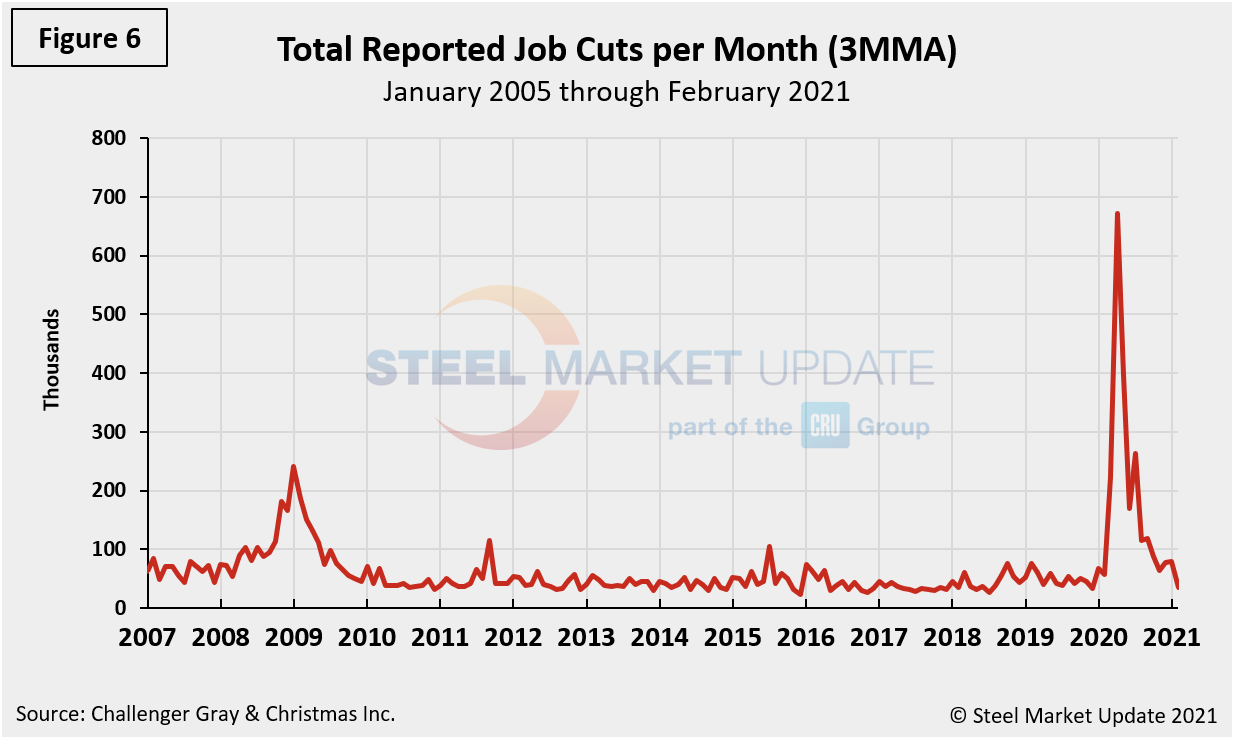
Human resources consulting firm Challenger, Gray and Christmas Inc. produces a monthly employment update for the U.S. It reported that job cuts in February were 34,513, down 57% from the 79,552 reported in January. It was the lowest monthly total since December 2019, when 32,843 job cuts were announced, and a far cry from the 671,100 seen at the peak of the pandemic in April 2020. Additionally, February’s total is 39% lower than the 56,660 cuts announced year over year. Through February, employers have announced 114,083 job cuts, 8% lower than the 124,395 announced through the first two months of 2020. The three-month moving average (3MMA) has declined in each of the last nine months.
“The churn has come to a halt. If healthy job creation follows, this could mean a full recovery is on the horizon, especially as companies see an end to the pandemic in sight,” Challenger reported. “If we do not see jobs begin to return, we could be entering a stagnation cycle, potentially keeping the currently unemployed out of work longer. The good news is we are seeing a high number of hiring plans, particularly in Retail, Entertainment, and Health Care, which were hit hard due to the pandemic. Companies announced 146,403 hiring plans in February, primarily led by Retail, which announced 66,486.”
Figure 6 shows the monthly job cuts reported by Challenger on a 3MMA basis since January 2007.
Explanation: On the first Friday of each month, the Bureau of Labor Statistics releases the employment data for the previous month. Data is available at www.bls.gov. The BLS reports on the results of two surveys. The Establishment survey reports the actual number employed by industry. The Household survey reports on the unemployment rate, participation rate, earnings, average workweek, the breakout into full-time and part-time workers and lots more details describing the age breakdown of the unemployed, reasons for and duration of unemployment.
By David Schollaert, David@SteelMarketUpdate.com


