Prices

February 25, 2021
HRC Futures: What Goes Up…???
Written by Tim Stevenson
SMU contributor Tim Stevenson is a partner at Metal Edge Partners, a firm engaged in Risk Management and Strategic Advisory. In this role, he and his firm design and execute risk management strategies for clients along with providing process and analytical support. In Tim’s previous role, he was a Director at Cargill Risk Management, and prior to that led the derivative trading efforts within the North American Cargill Metals business. You can learn more about Metal Edge at www.metaledgepartners.com. Tim can be reached at Tim@metaledgepartners.com for queries/comments/questions.
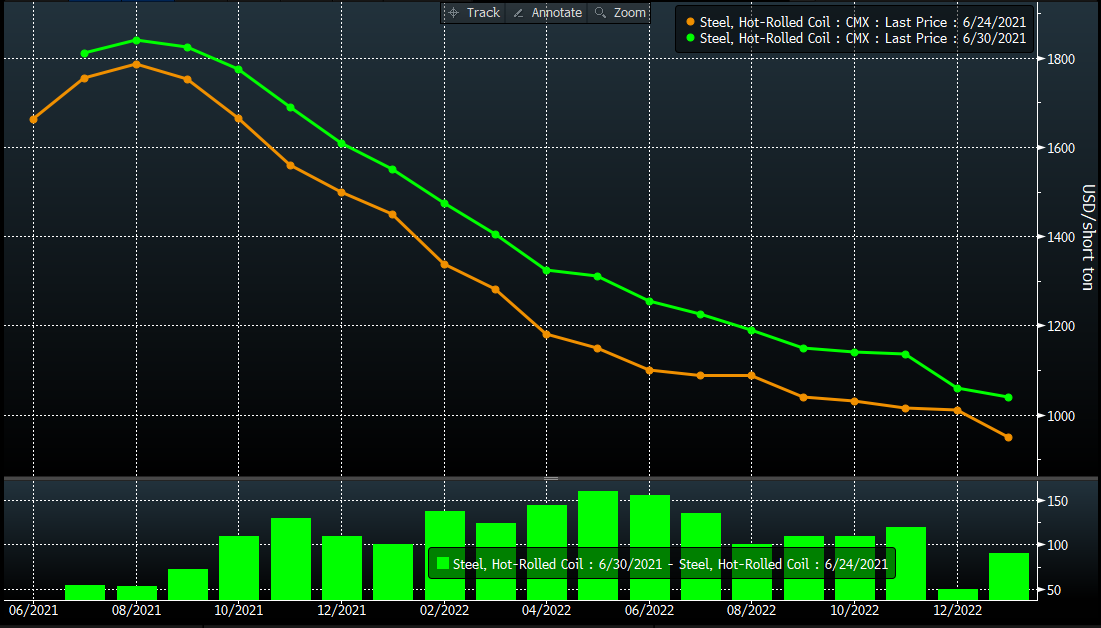
There is never a dull moment in the futures market these days. Never. We’ve seen unprecedented volatility, surging volumes, and increased adoption of futures to manage risk. But we are always looking for clues as to what may happen next, and we will dig into this a bit this week. First, let’s look at the week-over-week change in HRC prices. Nothin’ much goin’ on – just a roughly $100/ton move up across most months, with some rising $150/ton over the past week!
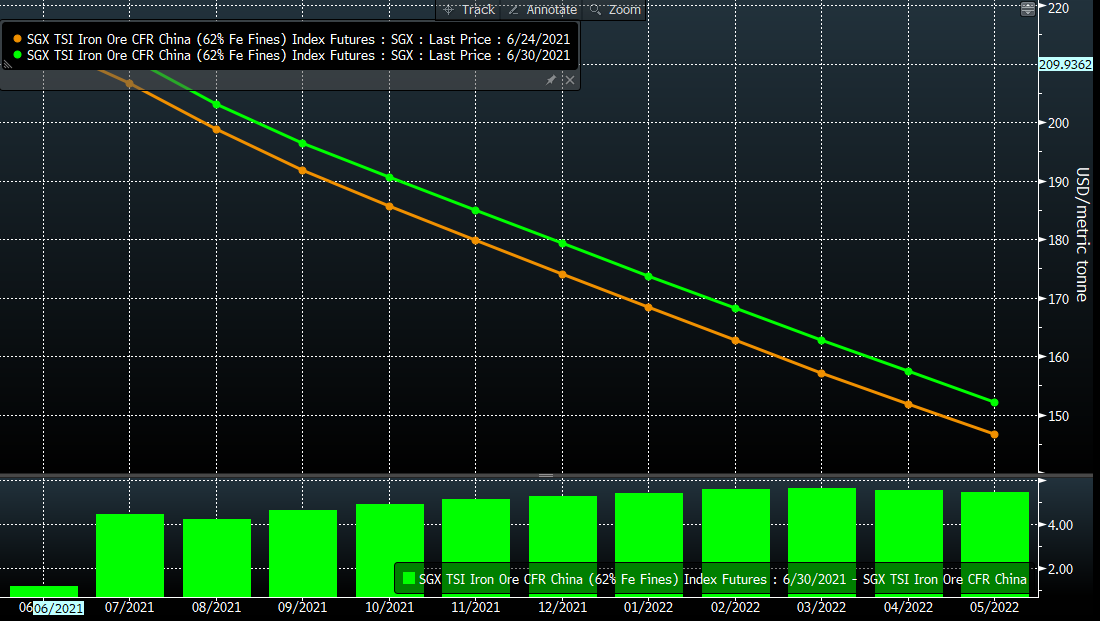
Ore prices also moved higher, despite some sloppier steel markets in China. There have been some seasonal factors making steel demand a bit softer, some holidays, and the oft cited “semiconductor chip shortage auto production slowdowns.” However, ore seemed to shrug this off to push higher week over week:
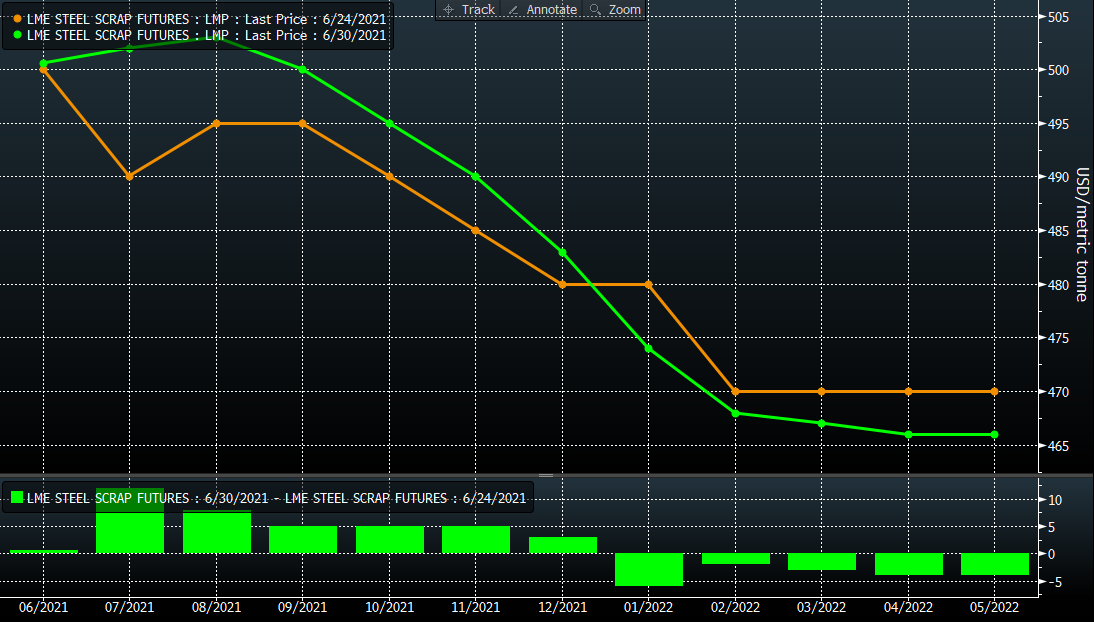
The busheling chart for this week is on the boring side, so instead we will look at Turkish scrap prices, which also pushed up somewhat in the nearby months:
But HRC prices went vertical. We can guess at some reasons—there were the unplanned outages at SDI Columbus and Nucor Gallatin, some residual (though we think waning) enthusiasm for an infrastructure package, and maybe some good- old-fashioned short covering by those tired of getting margin calls. There was also a notable amount of buying interest in 2022, as some participants look to lock up tons in front of what are likely contentious negotiations with their physical steel suppliers for next year. There is also interesting activity in some other commodity markets that we can sometimes look to for clues into what may be coming in steel. Here are a few charts for you.
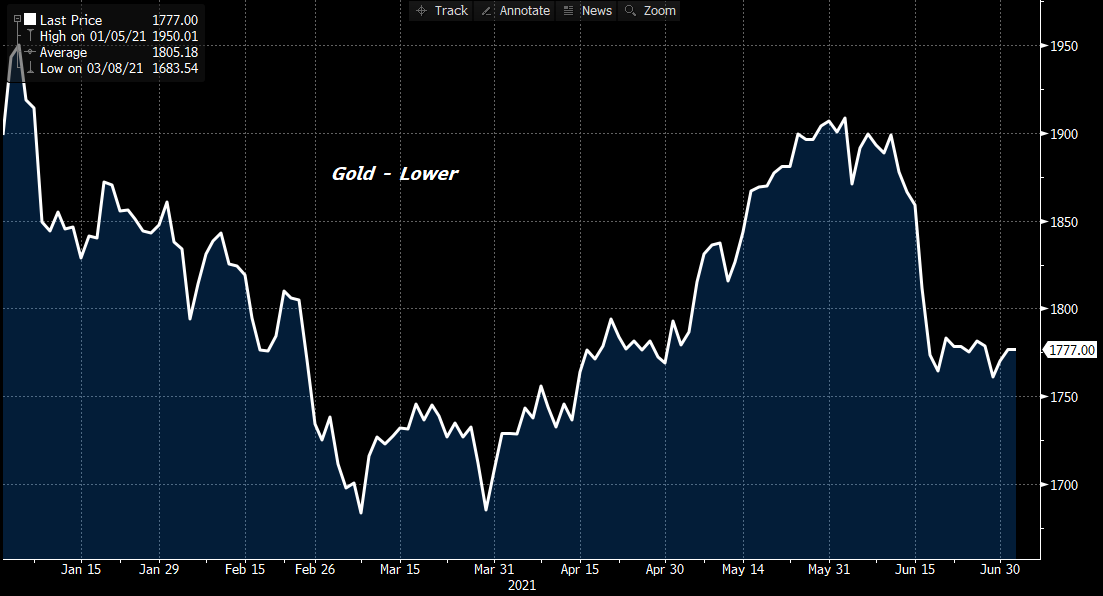
Gold is selling off after a big rally from March of this year into late May:
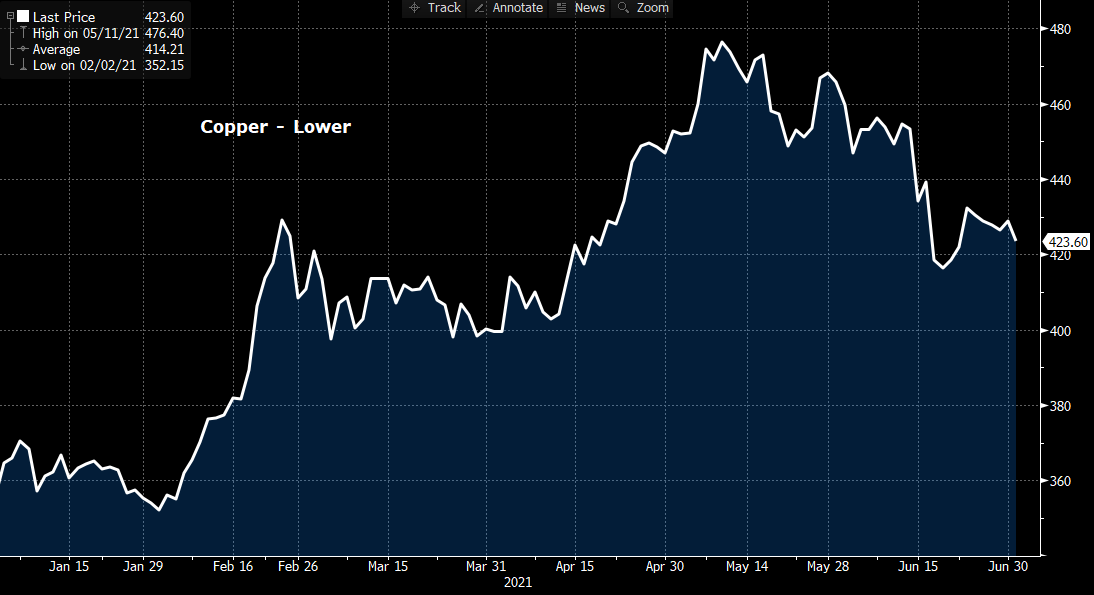
Copper, or “Dr. Copper” as some call it, has also pulled back. Some say that copper has a “PhD in Economics” as it can be a big indicator about the direction of the economy:
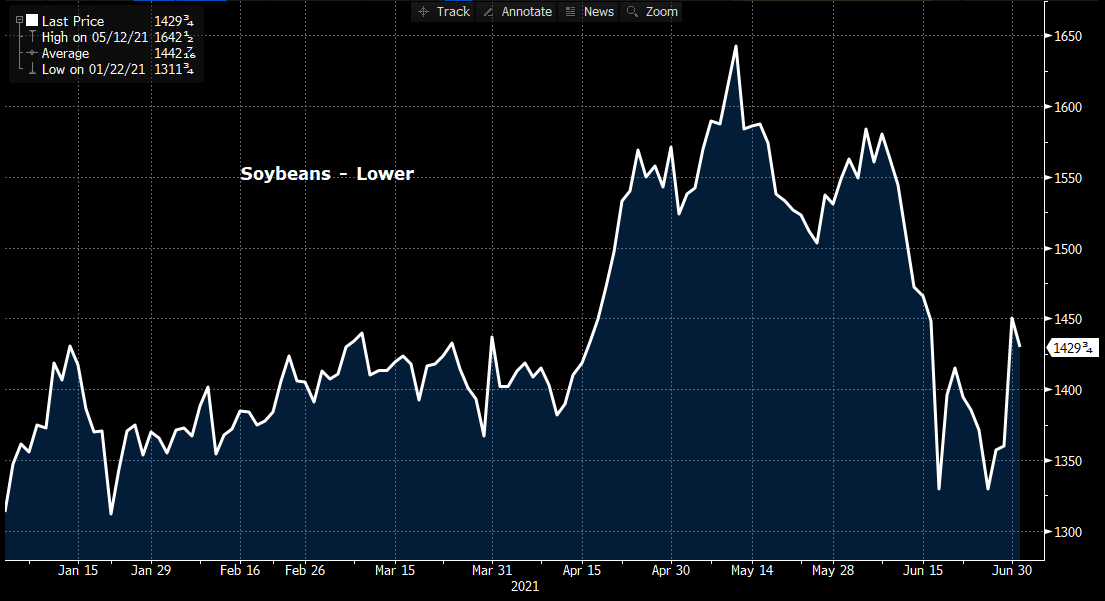
Soybeans have also pulled back, though have had a small recent recovery:
And as many of us have read—who could forget lumber futures—kerplooey! How about a 50% drawdown from the recent highs!:
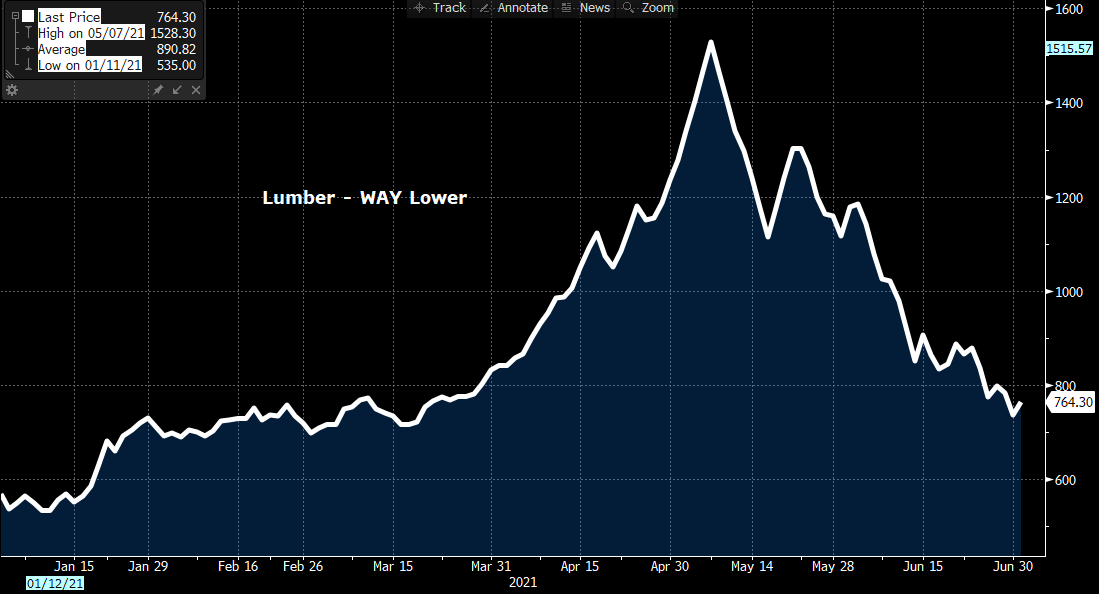
We’d add a few comments about these items, and their potential relevance to steel. First off, gold is an inflation hedge to many investors. Some of the pullback there has been due to gold bugs selling off the metal as inflation fears have come down, as have interest rates. Lower interest rates should be stimulative for the economy. Copper is a big one. However, China is the “tail that wags the dog” on commodity prices, so perhaps copper is reacting to some more sluggish demand trends there, while we haven’t seen much softness in the U.S. economy. The ag commodities like soybeans and corn may be reacting to some changes in weather patterns rather than acting as bellwethers for other commodities. And lumber—well it’s hard not to be concerned about the drubbing that this commodity has had. We wonder if labor and lot shortages may be impacting housing, as well as the uptick in mortgage rates. Further, mortgage rates could start to come back down as the 10-year Treasury yield has done recently. Nonetheless, all these markets are important to factor into any prognostications on steel.
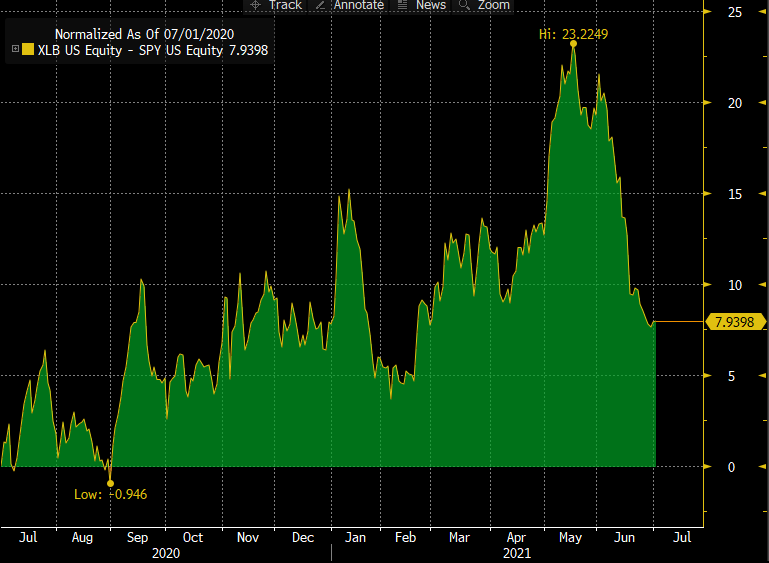
One other bearish chart we would like to share is the XLB versus the S&P 500. The XLB is an exchange traded fund that corresponds to the performance of basic industrial companies. These are companies that have significant exposure to the economy. When the line below is going up, cyclical companies are outperforming the broader market. When it is going down, these same companies are underperforming the S&P. From the top in mid-May, the XLB has underperformed by nearly 15%. Investors seem to be worried about the strength of the U.S. economy despite all the anecdotes we hear about the booming growth:
But one other one—a big one—is oil. This chart has some real momentum and is definitely “up and to the right”:
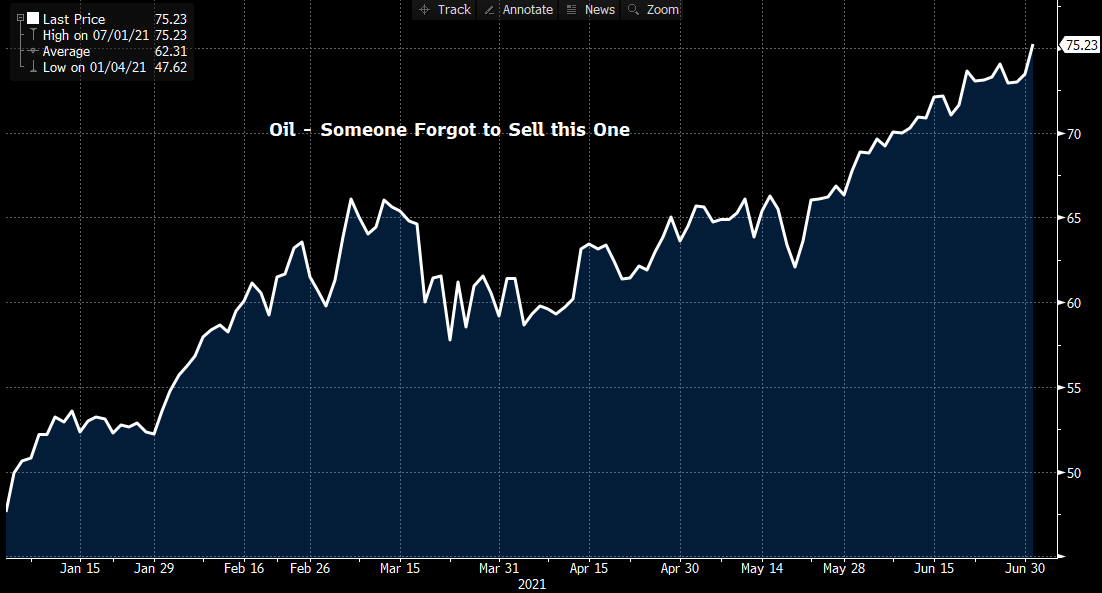
We’ve heard more people talking about $100 oil. In a weird way, the ESG movement may be responsible for booming oil prices. ESG has in some ways starved the oil sector of capital in an effort to “go green.” However, when a sector is starved of capital, production eventually is impacted, and higher prices can be a natural outcome. So, oil is marching to the beat of a different drum than the commodities that have pulled back, and steel demand in the oil sector has been terrible for the past couple of years. What would $100 oil do to steel demand? The question is—what drum is steel marching to? A bearish dirge or something more upbeat? Time will tell. We hope this has given you something to think about as you test your assumptions about the future. Thanks for reading!
Disclaimer: The information in this write-up does not constitute “investment service,” “investment advice” or “financial product advice” as defined by laws and/or regulations in any jurisdiction. Neither does it constitute nor should be considered as any form of financial opinion or recommendation. The views expressed in the above article by Metal Edge Partners are subject to change based on market and other conditions. The information given above must be independently verified and Metal Edge Partners does not assume responsibility for the accuracy of the information


