Analysis

February 22, 2021
North American Auto Assemblies Retract in January
Written by David Schollaert
Auto assemblies in North America took a step back in January after seeing a strong end to 2020. Although the U.S. market continues to rebound from the effects of the pandemic, domestic light vehicle sales fell by 3.1% in January compared to year-ago levels, according to LMC Automotive (LMCA). Canada’s light vehicle sales were down by 15.0% in January when compared to year-ago levels, while Mexico’s sales fell by 22.6% during the same period. The setback was largely due to a surge in COVID-19 cases at the beginning of the year that subdued overall automotive activity. North American production was up marginally month on month to 1.155 million units, from 1.150 million in December, but the impact of the recent microchip shortage is not yet reflected in available data.
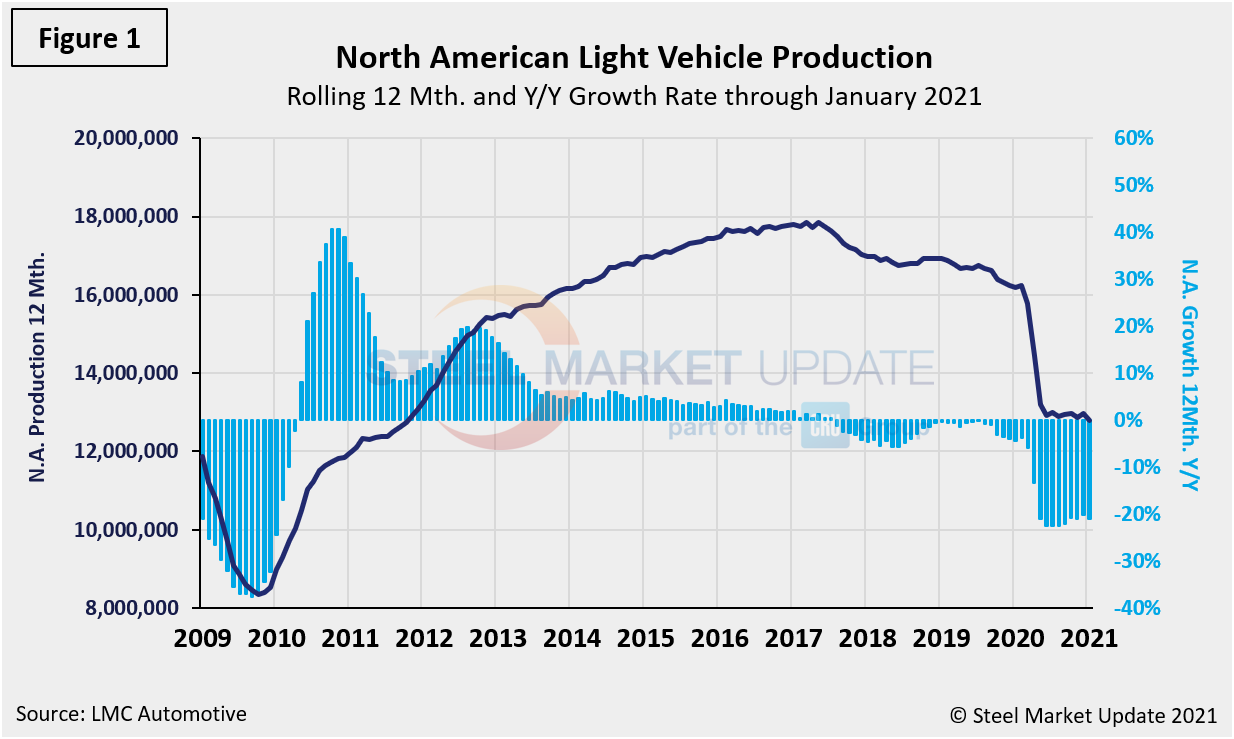
According to LMCA, U.S. light vehicle sales dipped 3.1% in January year over year, which could be explained by one fewer selling day than in January 2020. Despite the decreases in sales across North America, all three countries posted increased selling rates when compared to month-ago levels. The U.S. was at 16.6 million units, up from 16.4 million the month prior. Canada’s selling rate accelerated to 1.75 million units, from 1.5 million during the same period. Despite Mexico’s dismal sales in January on year-on-year basis, the selling rate rose to 1.03 million units, from 913,000 in December. As a comparison, Figure 1 shows the production in North America on a rolling 12-month basis as the dark blue line and the year-over-year growth as the light blue bars.
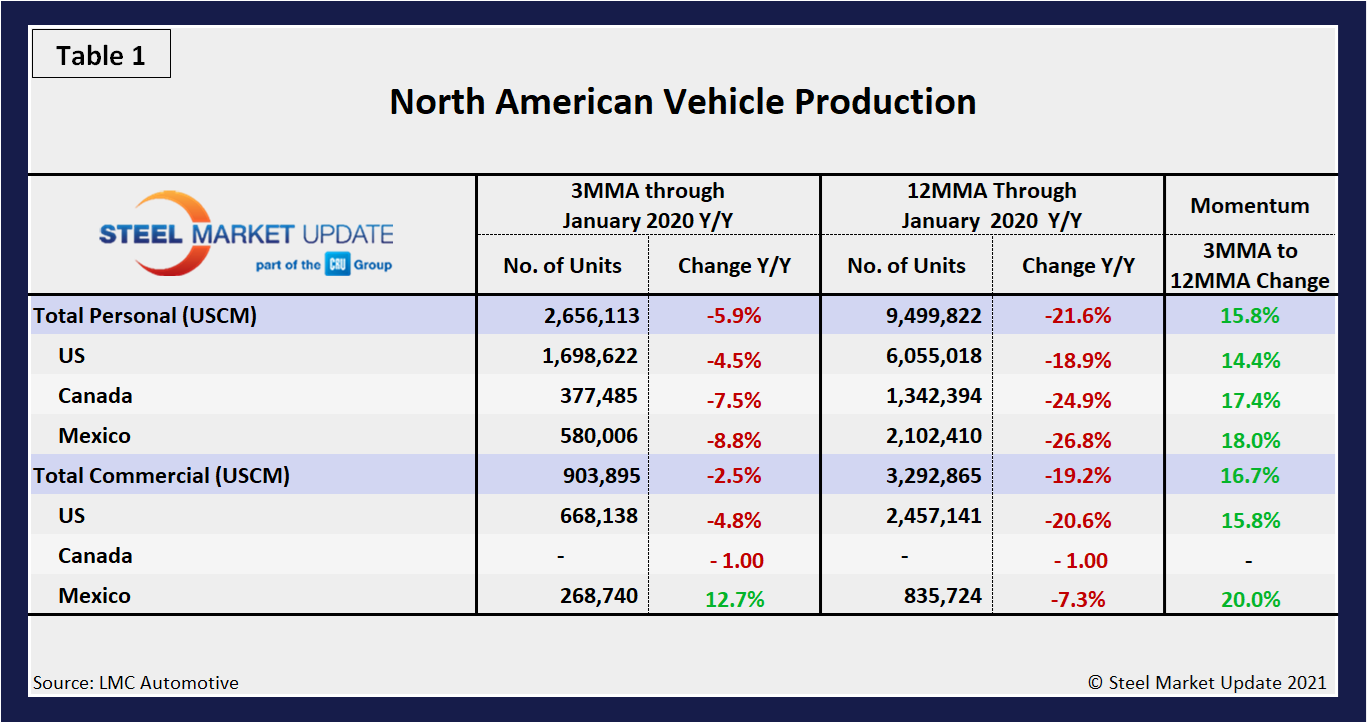
A short-term snapshot of assembly by nation and vehicle type is shown below in Table 1. It breaks down total North American personal and commercial vehicle production into the U.S, Canadian and Mexican components and the three- and 12-month growth rate for each. At the far right it shows the momentum for the total and for each of the three nations. In three months through January, total personal vehicle assemblies in the USMCA region were negative 5.9% year over year. Although it’s a step back from December’s positive results, the overall report is still a strong turnaround from the decrease of 70.5% seen in June 2020. Commercial light vehicle assemblies were also down at a negative 2.5% year over year after being down by 66.5% at the end of Q2 2020. There has been zero commercial vehicle production in Canada for 13 consecutive months. Despite the decreases, the momentum shift remains positive with total personal vehicle production on a 15.8% rise while commercial is at a 16.7% rise.
Personal Vehicle Production
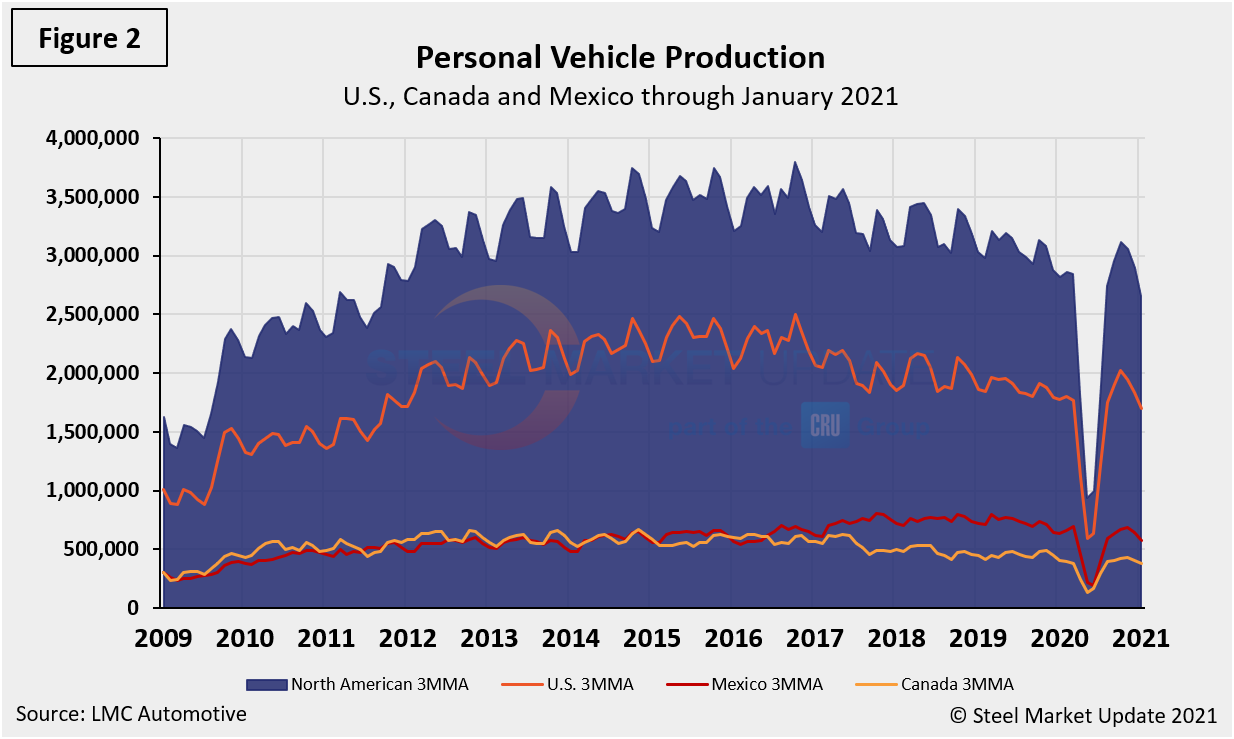
The longer-term picture is shown in the following charts by vehicle type and nation. Figure 2 shows the total personal vehicle production for North America and the total for each nation.
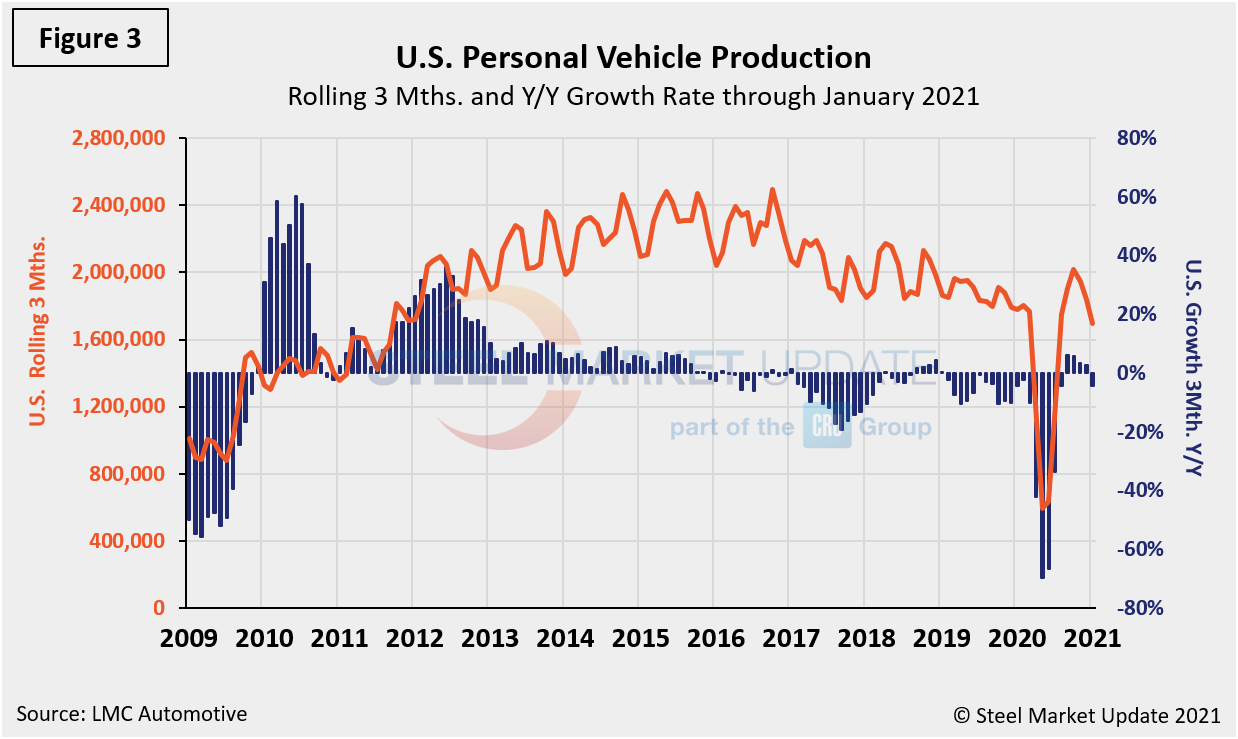
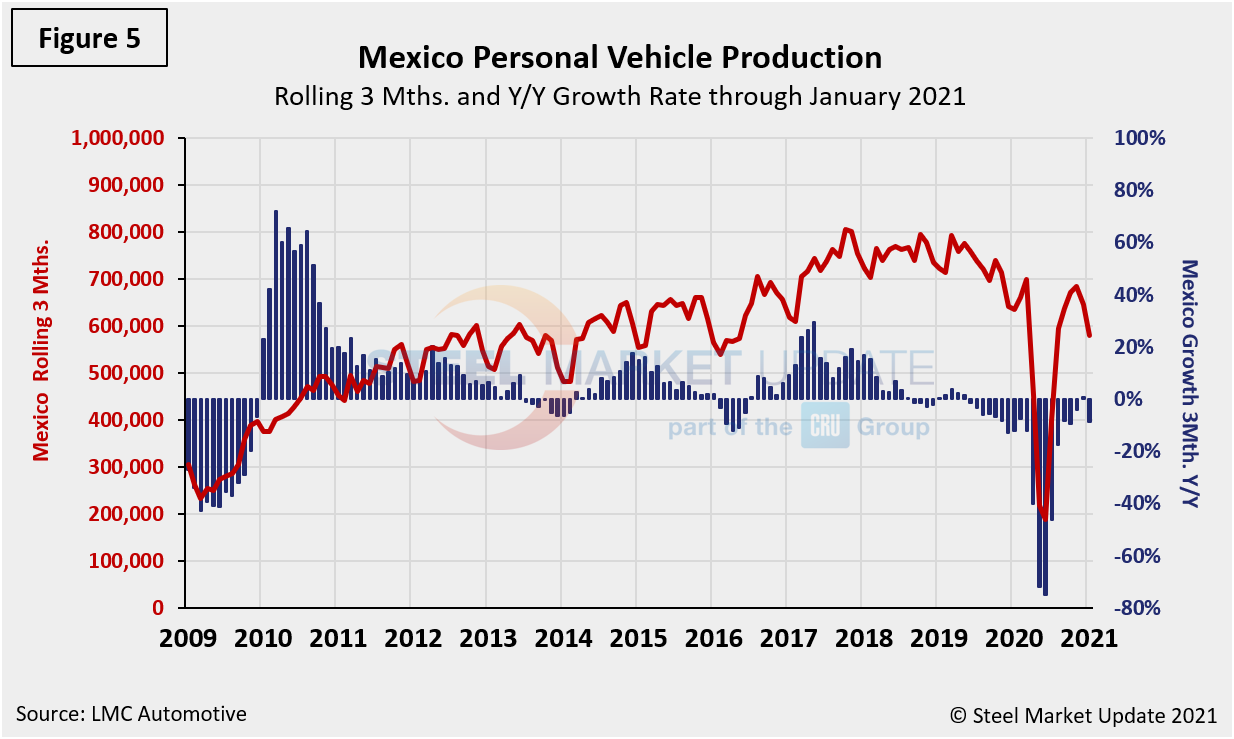
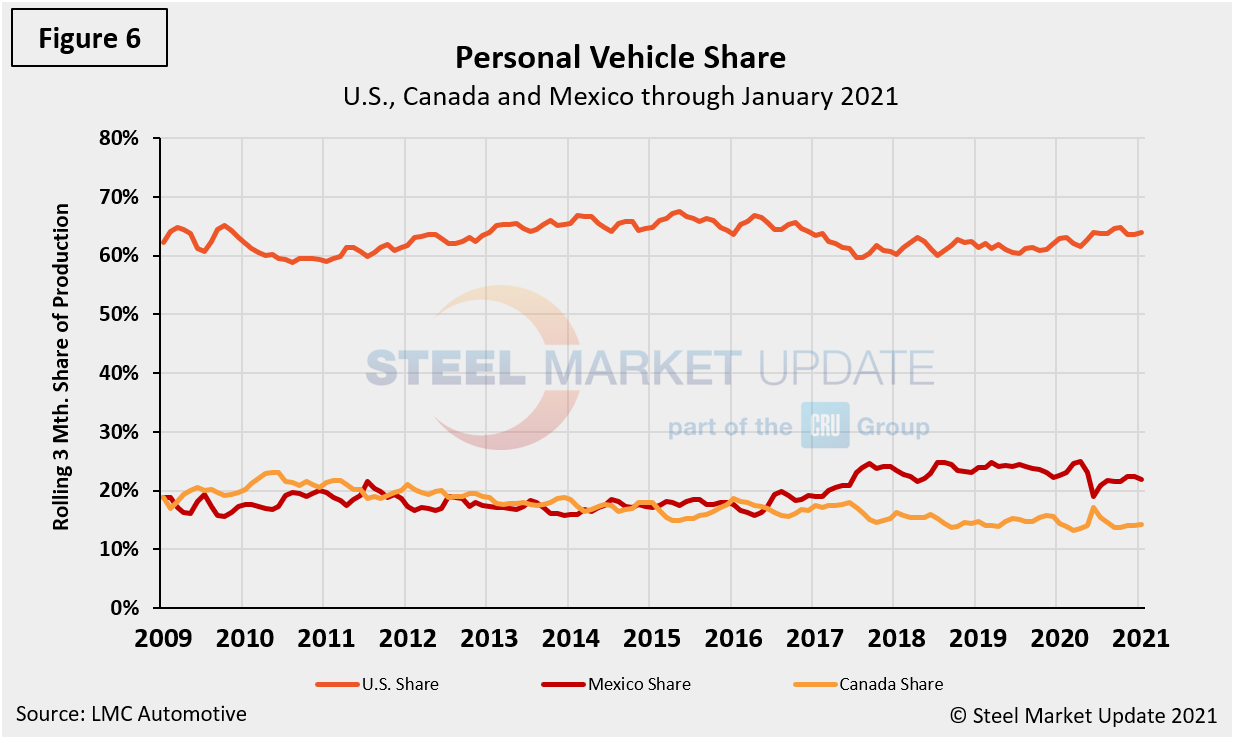
The production of personal vehicles by nation and the year-over-year growth rate for each is displayed below in Figures 3, 4 and 5. Figure 6 shows the production share for each nation. The U.S. share was as high at 64.8% in October. After slipping some to close out Q4, it has since increased to 64.0% through January. On the same basis, Canada’s share has risen for three consecutive months, currently at 14.2%. As a result, Mexico’s share dipped to 21.8% from 22.4% in the same period.

Commercial Vehicle Production
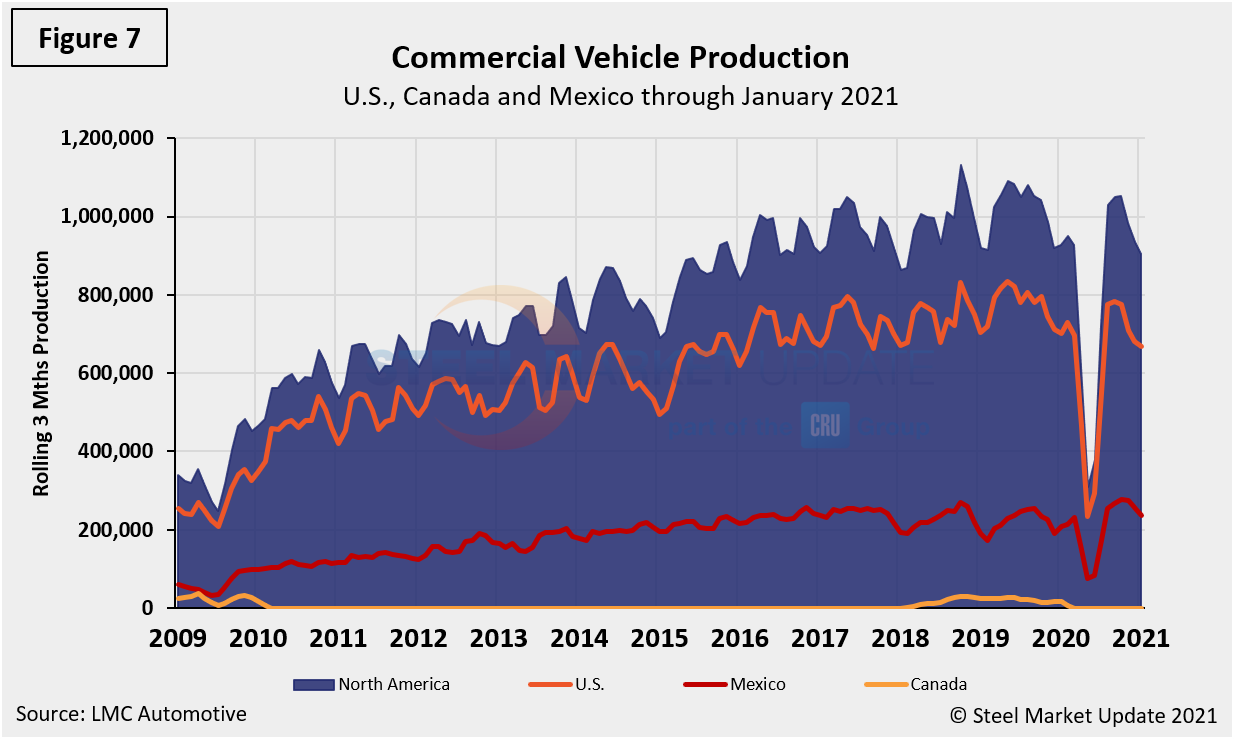
The total commercial vehicle production for North America and the total for each nation on a rolling three-month basis is shown below in Figure 7.
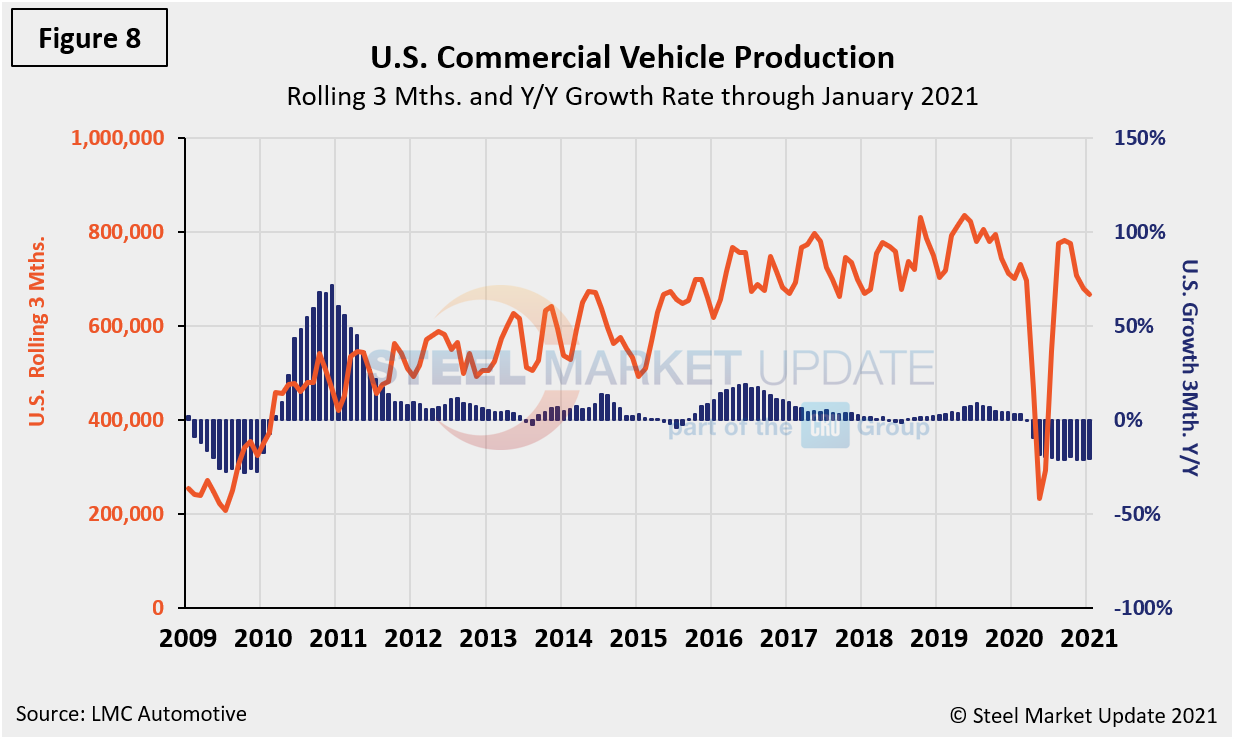
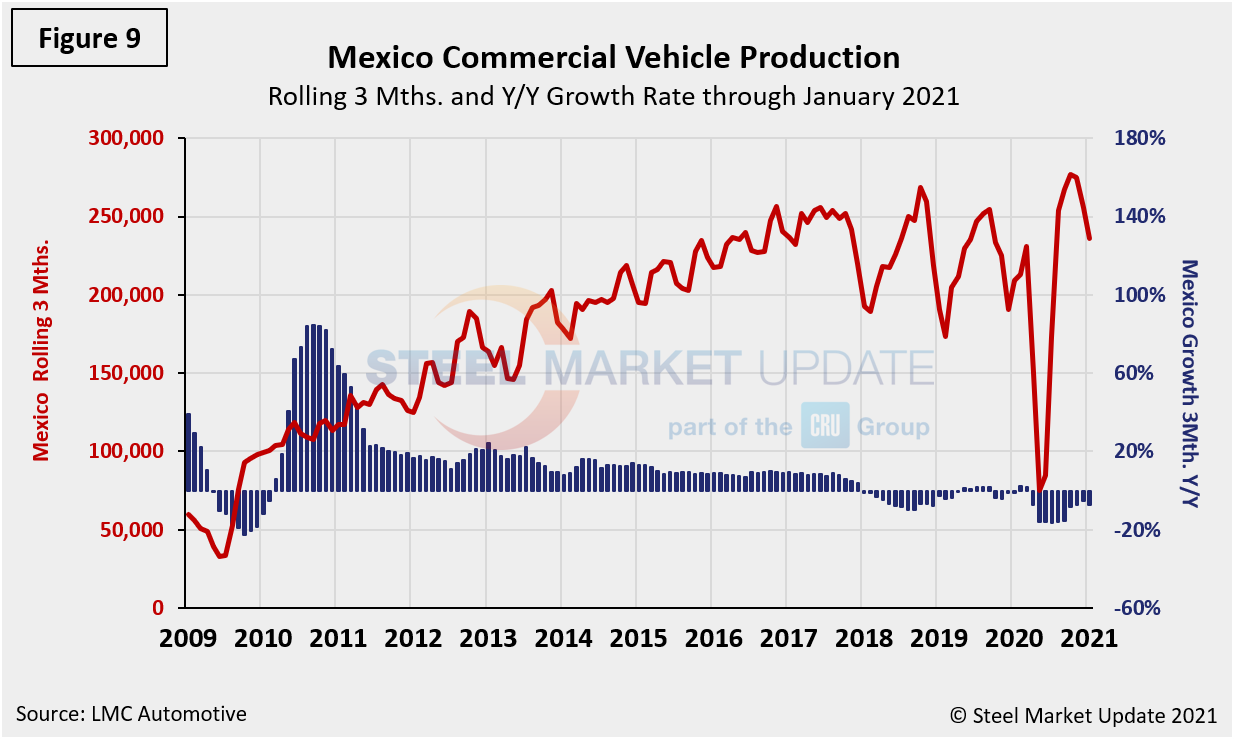
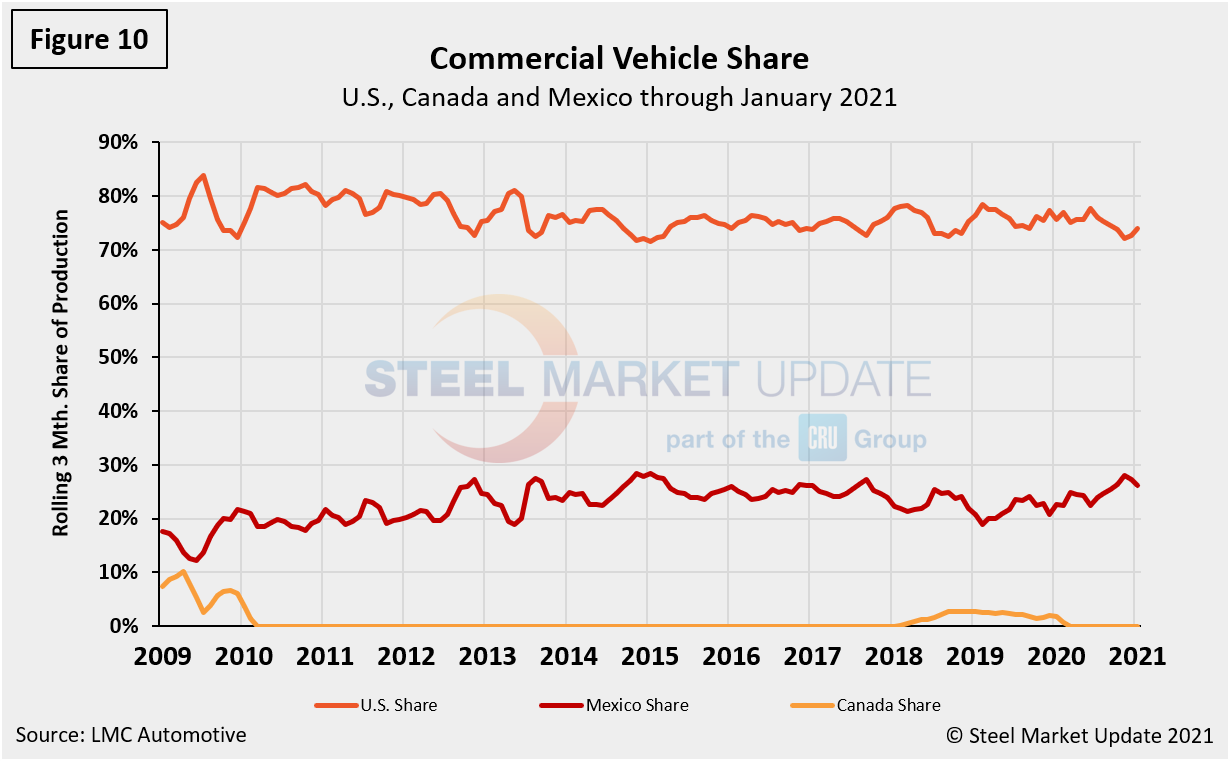
The production of commercial vehicles by nation and the year-over-year growth rate for each is shown in Figures 8 and 9, and Figure 10 shows the production share for each nation. The U.S. share edged down from 77.6% in June to 72.7% in December. In January, the share rose to 73.9%. Mexico’s share rose during the same period from 22.4% in June to 27.3% in December, but dipped down to 26.1% in January. Canada has had no commercial production since February 2020. Mexico currently exports about 80% of its light vehicle production. The U.S and Canada are the highest volume destinations for Mexican exports.
Note: This report is based on data from LMC Automotive for automotive assemblies in the U.S., Canada and Mexico. The breakdown of assemblies is “Personal” (cars for personal use) and “Commercial” (light vehicles less than 6.0 metric tons gross vehicle weight rating; heavy trucks and buses are not included). In this report, we briefly describe light vehicle sales in the U.S. before reporting in detail on assemblies in the three regions of North America.
By David Schollaert, David@SteelMarketUpdate.com


