

Analysis

February 10, 2021
CPIP Data: Residential Construction Leads the Way in January
Written by David Schollaert
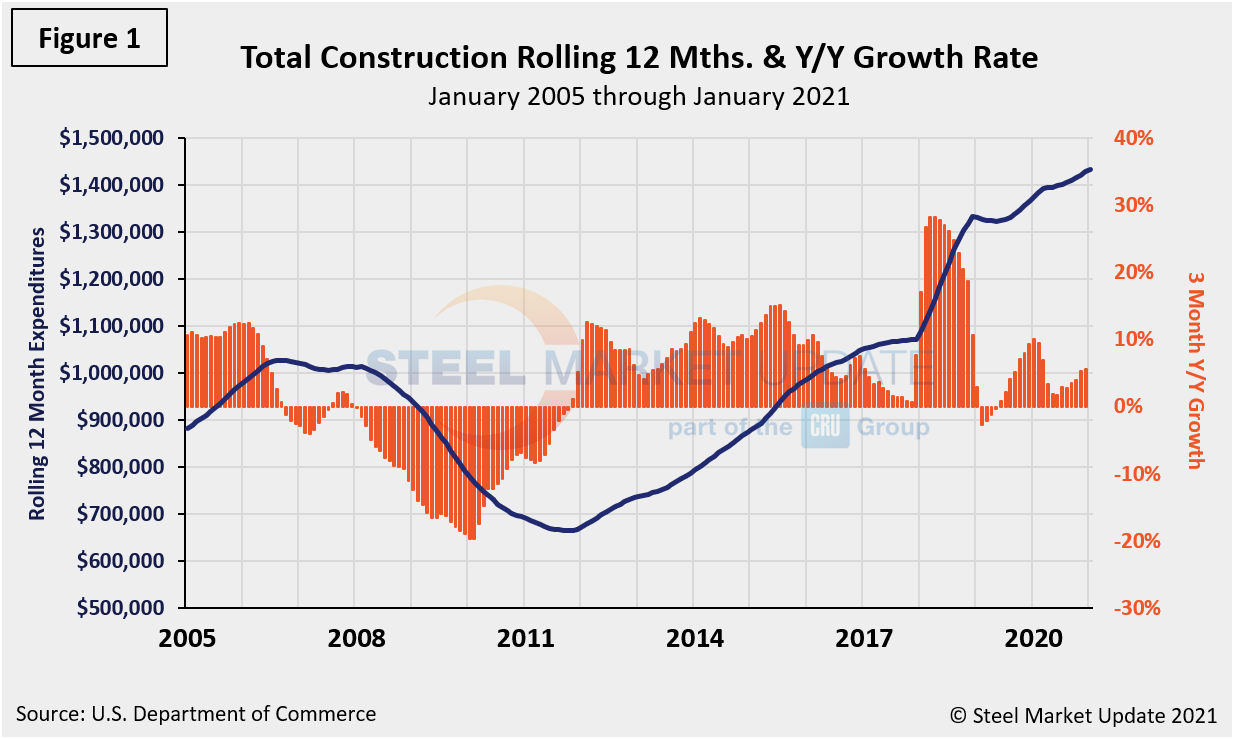
Total construction expenditures rose further in January to about $1.52 trillion, up 1.7% from December’s revised estimate of $1.50 trillion, reported the U.S. Census Bureau. The year-on-year comparison is rather remarkable, as the January figure is 5.8% above the year-ago, pre-pandemic estimate of $1.44 trillion. Although the economy is still in recovery mode, the construction sector continues to be a bright spot and has withstood the “COVID storm” other sectors have succumbed to this past year. Construction accounts for about 45% of total U.S. steel consumption.
See the end of this report for more background on the Construction Put In Place (CPIP) data used in this analysis.The CPIP that is the focus of this report is based on spending work as it proceeds; the value of a project is spread out from the project’s start to its completion. The Census Bureau reports separately on construction starts in which data for the whole project is entered into the database when ground is broken.
Total Construction
Certainly, the construction sector has been squeezed by the global pandemic and the fallout from widespread closures and shutdown efforts, yet it has been far more resilient than manufacturing due largely to pre-funding. Although some erosion has been seen in the growth trend arrows in Table 1 through January, private and federal construction are on the rise, especially residential buildings measured on a rolling three- and 12-month basis. State and local, infrastructure and other categories have all been edging down, however.
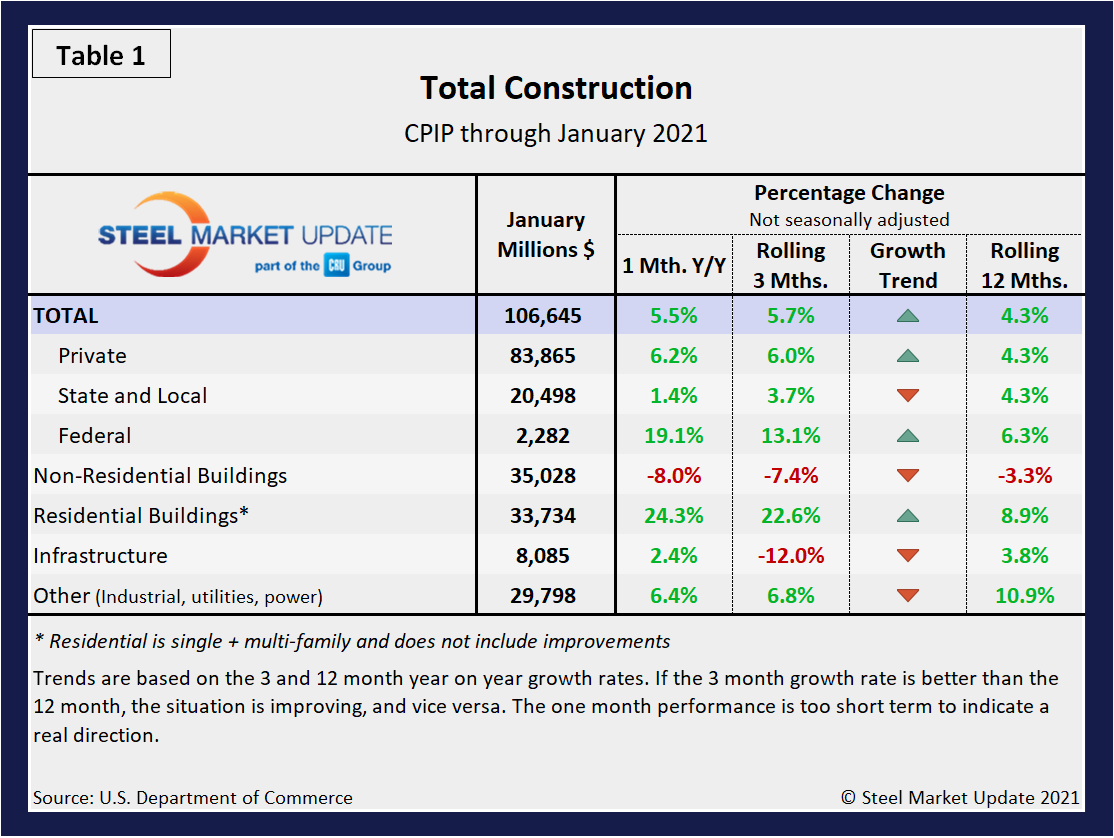
As a reference, please note that Figures 1, 2, 6, 7 and 9 in this analysis use the same rolling format to smooth out variation and eliminate seasonality. We consider four sectors within total construction: non-residential, residential, infrastructure and other (industrial, utilities and power). Figure 1 shows total construction expenditures on a rolling 12-month basis as the blue line and the rolling three-month year-over-year growth rate as the orange bars.
Private Construction
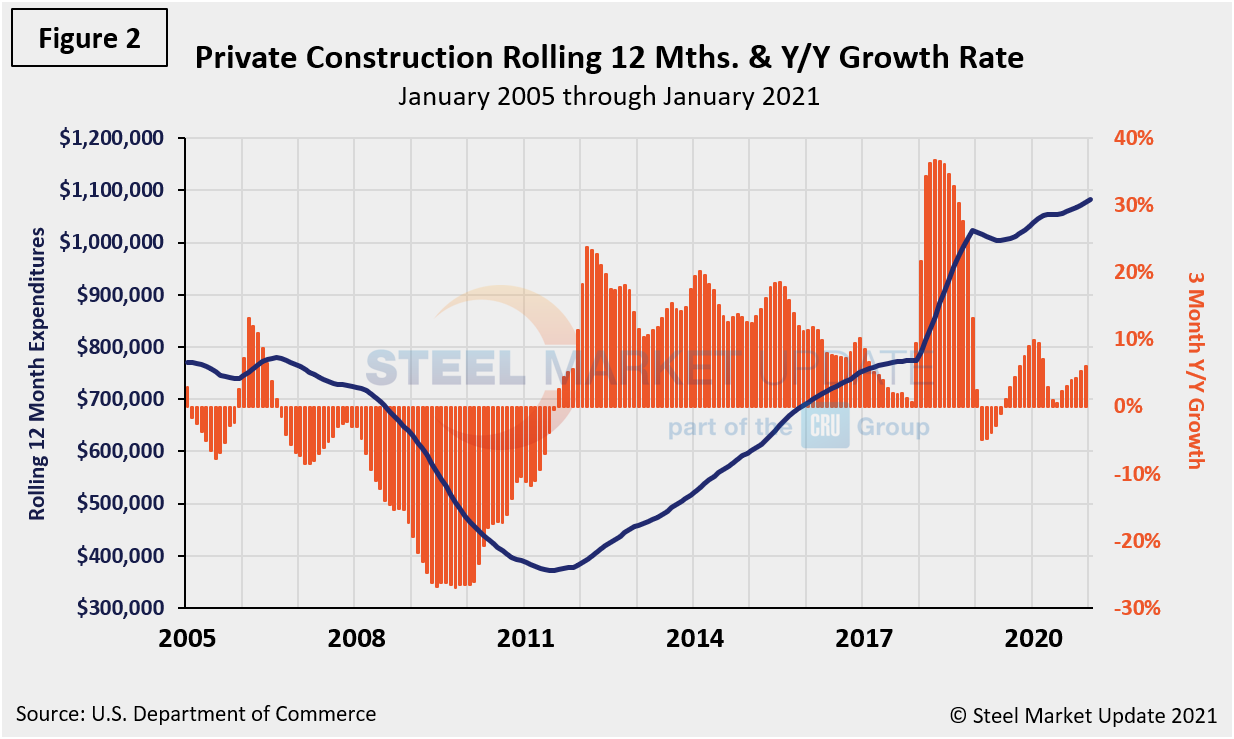
The breakdown of private expenditures into residential and non-residential and their subsectors are highlighted in (Table 2) below. The growth rate of private construction in three months through January 2021 was a positive 6.0%, a major upward swing from the negative 10.2% posted the month prior. The notable rebound was led almost singlehandedly by residential construction. Single-family and multifamily residential construction posted positive 23.7% and 18.4% growth, respectively in January. Spending on private construction hit a seasonally adjusted annual rate of $1.16 trillion, 1.7% above the revised December estimate of $1.14 trillion. Residential construction saw a seasonally adjusted annual rate of $713.0 billion in January, 2.5% above the revised December estimate of $695.7 billion, the U.S. Census Bureau reported (Figure 2).
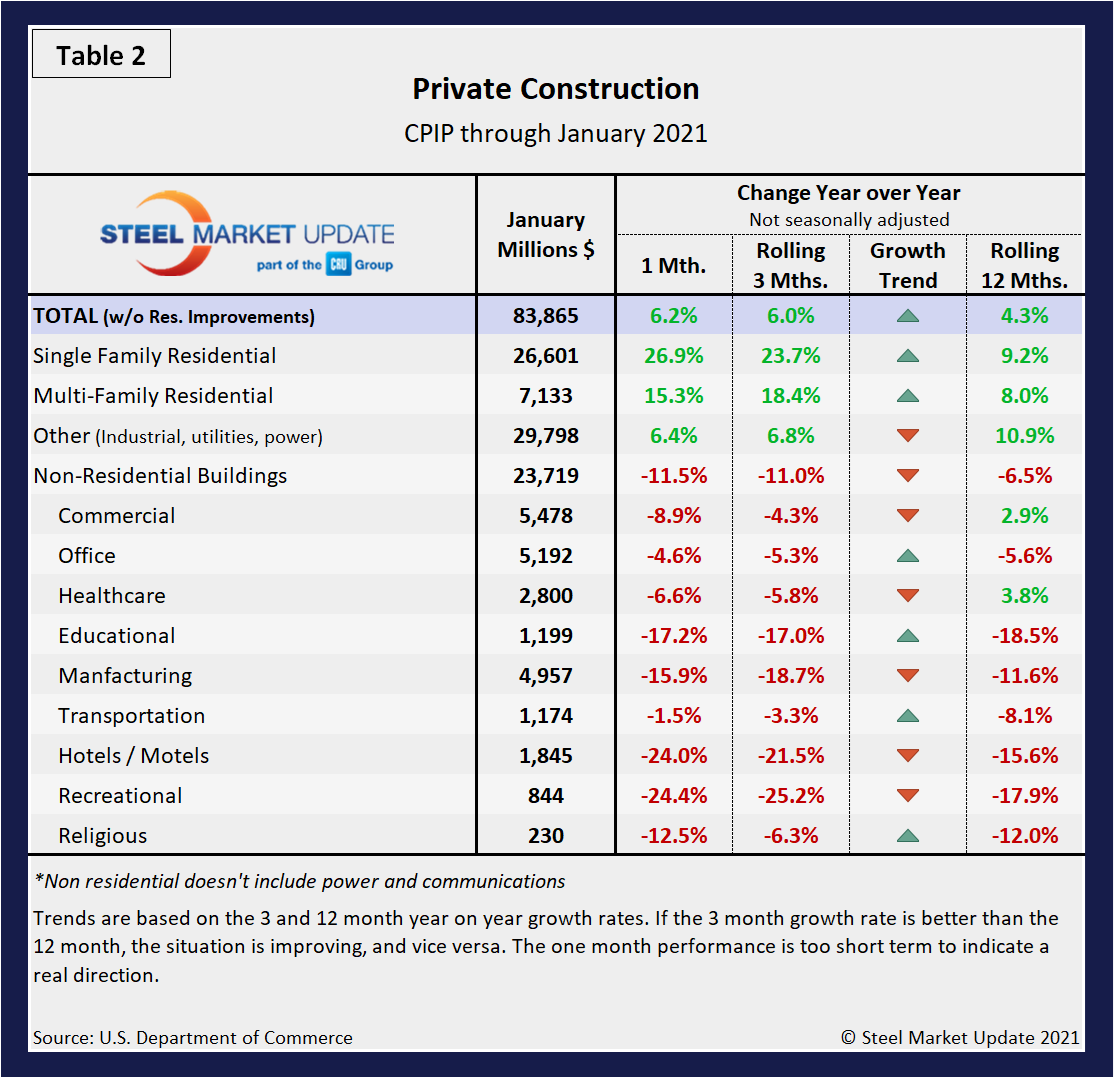
Despite the gains in residential construction, five of the nine sectors within nonresidential construction remained on a declining trend with negative momentum. Nevertheless, it’s an improvement from month-ago results, as office and educational buildings have joined transportation and religious buildings on a positive growth trend.
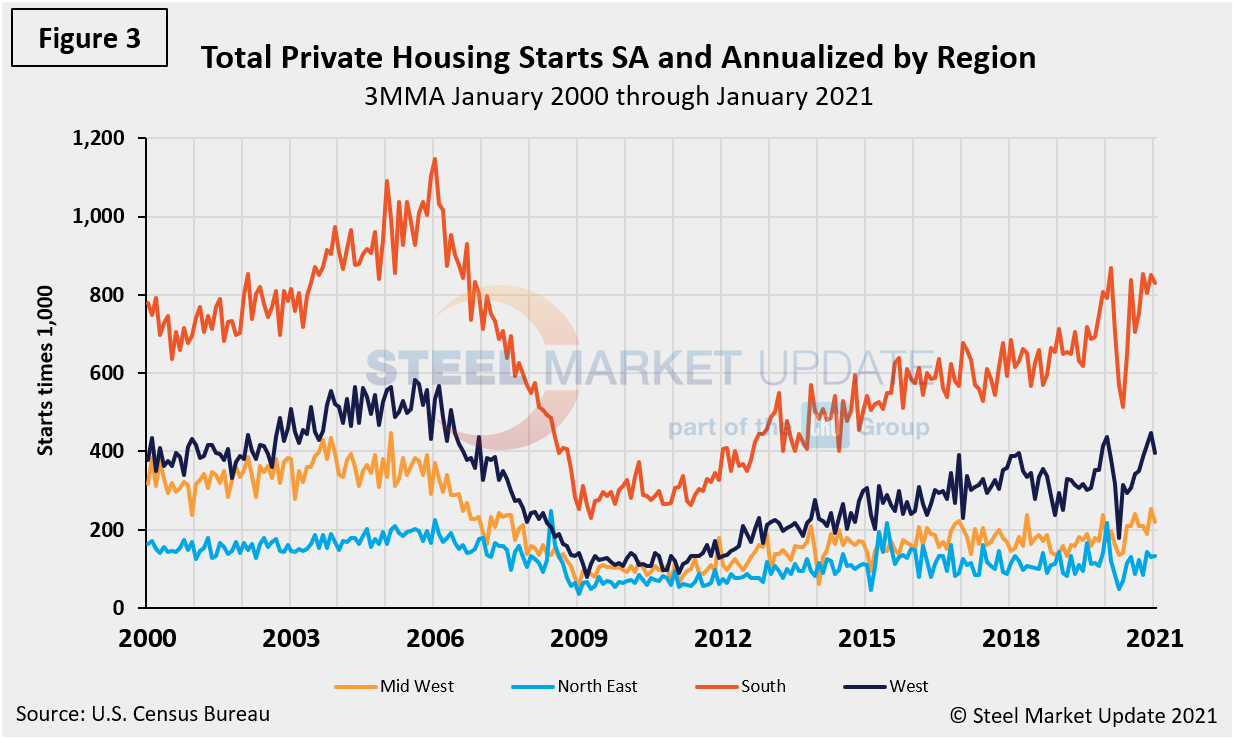
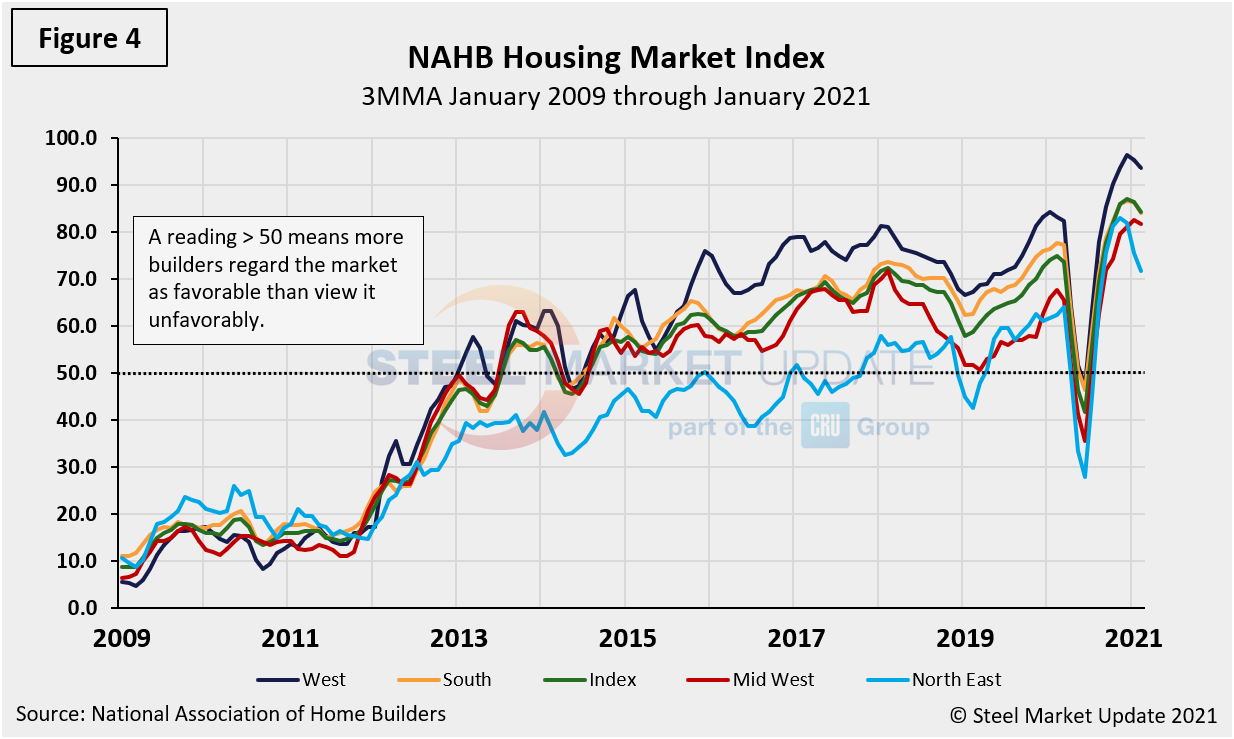
Total housing starts in four regions are displayed below (Figure 3) and show the Southern region being the strongest and the Northeast the weakest. All four regions suffered major declines in 2020 beginning in March, but have partially recovered since May. Although the Northeast remains the weakest of all four regions, it was the only region to post an increase month on month, and was up 14.0% on a 3MMA basis. The National Association of Home Builders optimism index crashed in April and recovered each month May through December last year. In January it slipped but still posted a slight increase, according to February data as shown in Figure 4.
State and Local Construction
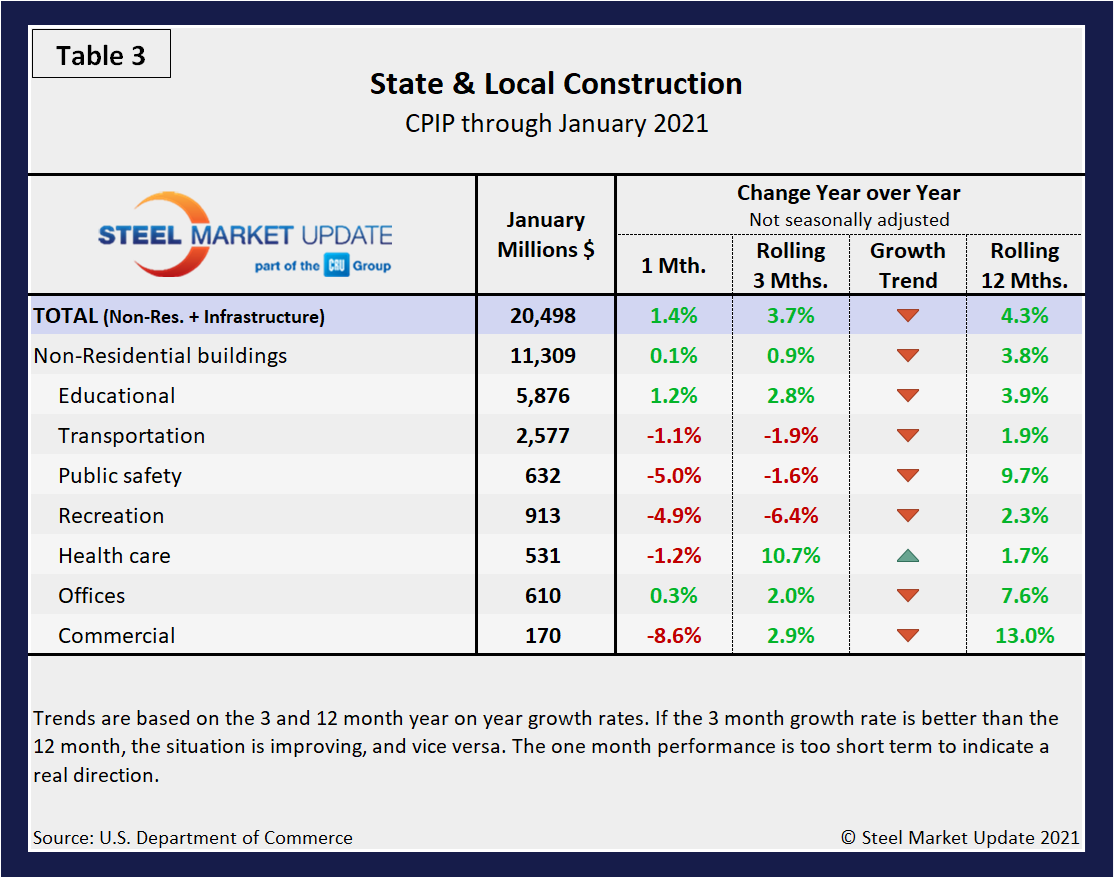
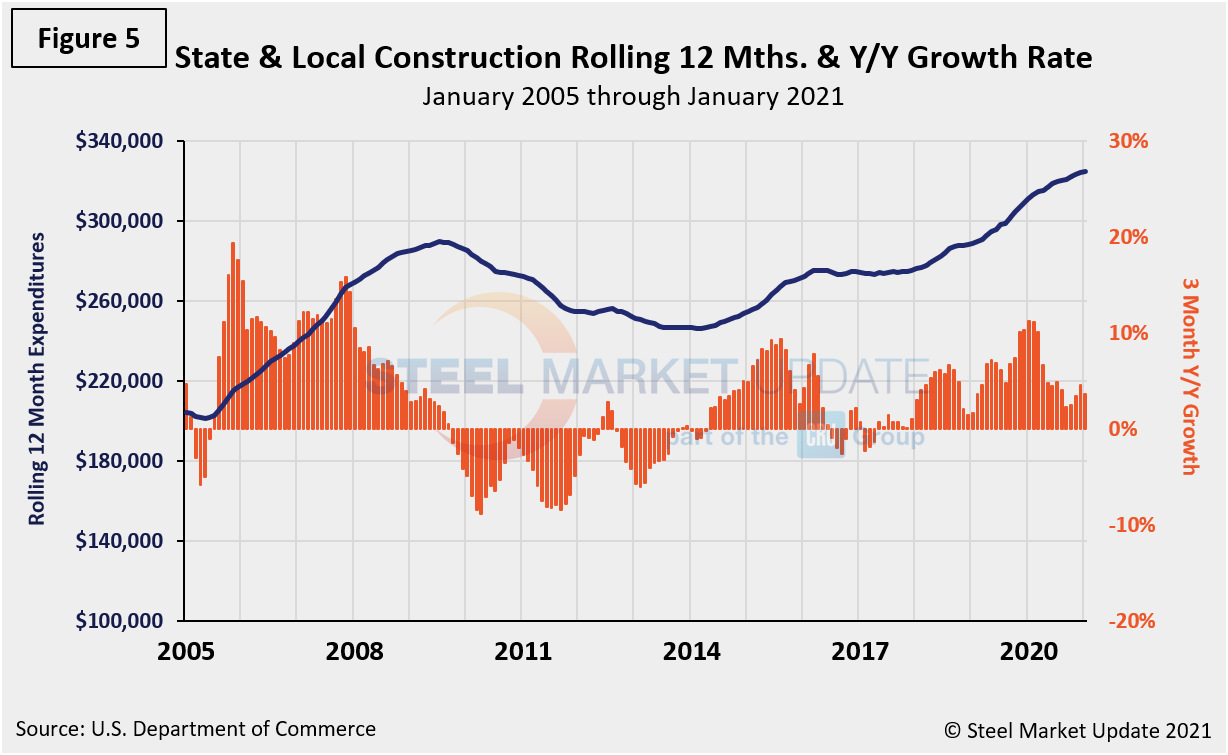
Total State and Local (S&L) expenditures recovered at a much slower pace than private work following the 2008-2009 recession and are again showing a delayed reaction. The growth trend remains on the decline (Table 3). In three months through January, only health care had positive momentum. Educational was by far the largest subsector of S&L nonresidential buildings at $5.9 billion in January. Public construction spending was $361.5 billion, 1.7% above the revised December estimate of $355.5 billion. Educational construction was at a seasonally adjusted annual rate of $89.9 billion, or 0.1% below the revised December estimate of $90.0 billion. Figure 5 shows the history of total S&L expenditures.
Infrastructure
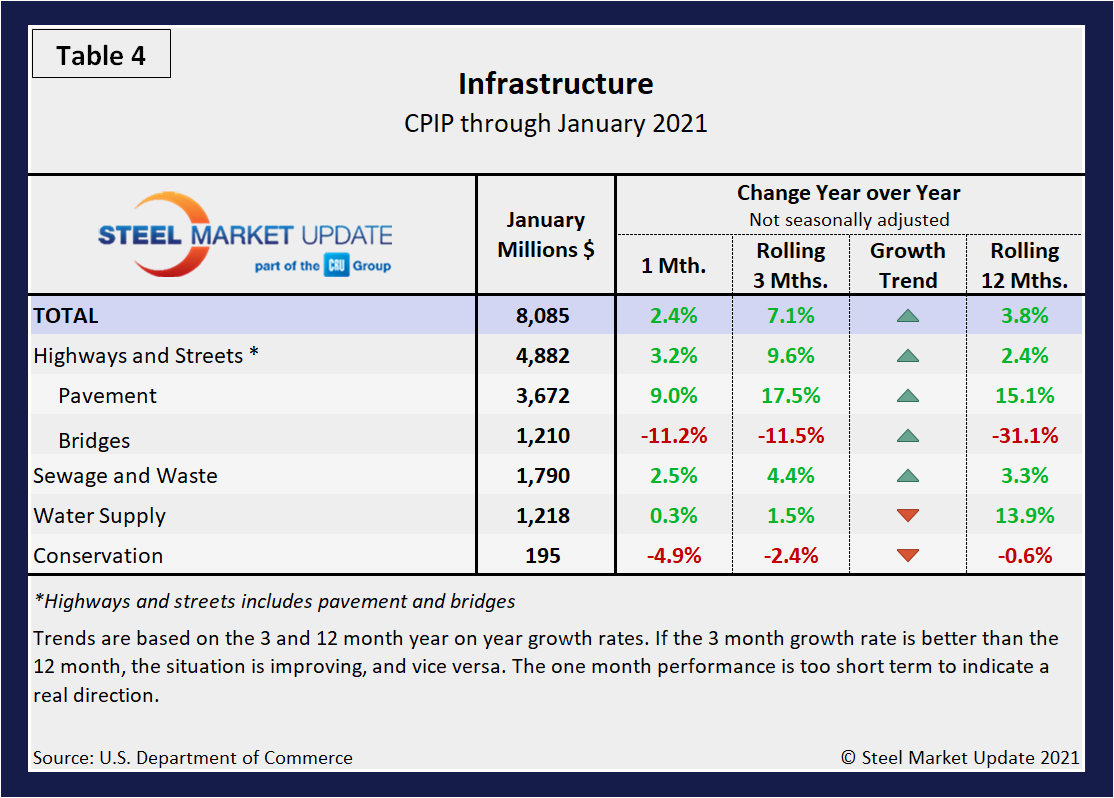
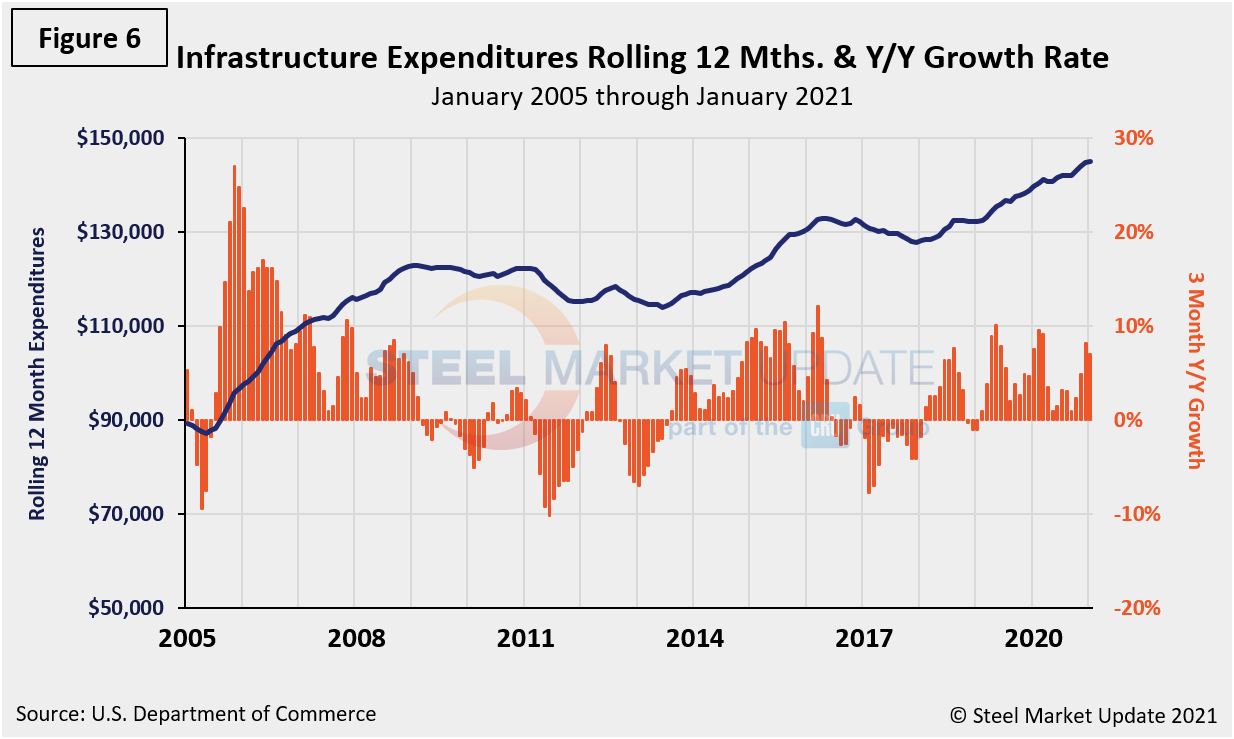
Infrastructure expenditures have seen growth since January 2019, reported the Census Bureau. Year over year, the growth of infrastructure expenditures in three months through January 2021 was 7.1%, down from 8.2% the month prior. Highways and streets including pavement and bridges account for almost three-quarters of total infrastructure expenditures. Highway pavement is the main subcomponent of highways and streets and had a 9.6% growth in three months through January. Highway construction was at a seasonally adjusted annual rate of $107.8 billion or 5.8% above the revised December estimate of $101.9 billion. Bridge expenditures have had a double-digit contraction rate every month since September 2019. Table 4 shows the breakdown of infrastructure expenditures in three months and 12 months through January, and Figure 6 shows the rolling 12-month history of infrastructure expenditures and the year-over-year growth rate.
Total Building Construction Including Residential
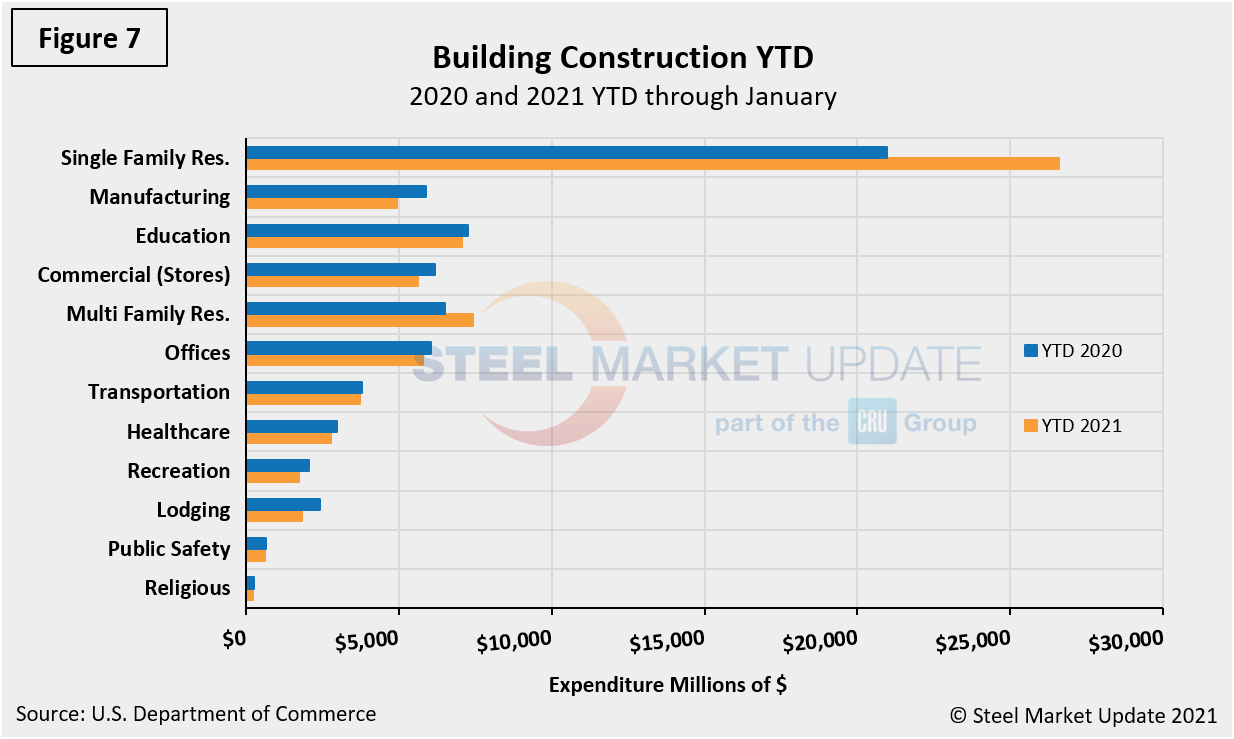
Figure 7 compares year-to-date expenditures for the construction of the various building sectors for 2019 and 2020. Single-family residential was dominant in 2020 expenditures totaling $301.9 billion annualized, and it has not let up in 2021. January’s expenditures for single-family construction were $26.6 billion, up 26.9% compared to year-ago levels.
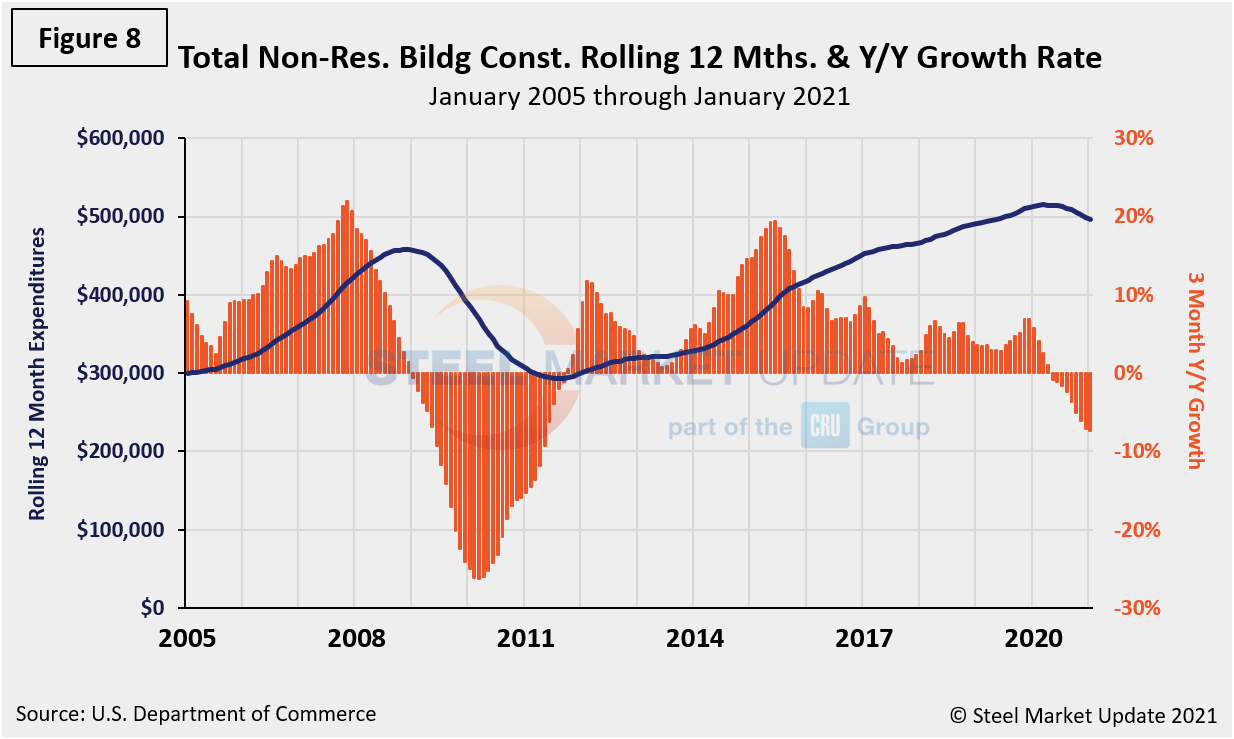
Total expenditures and growth of nonresidential building construction is shown in Figure 8. Growth has slowed every month since November 2019 and in January 2021 reached negative 8.0%, 0.8% lower compared to the month prior or 11.1% lower year on year.
Explanation: Each month, the Commerce Department issues its Construction Put in Place (CPIP) data, usually on the first working day covering activity one month and one day earlier. There are three major categories based on funding source: private, state and local, and federal. Within these three groups are about 120 subcategories of construction projects. SMU analyzes the expenditures from the three funding categories to provide a concise summary of the steel-consuming sectors.
By David Schollaert, David@SteelMarketUpdate.com