Market Data

November 16, 2020
Service Center Shipments and Inventories Report for October
Written by Estelle Tran
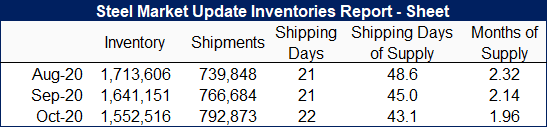
Flat Rolled = 43.1 Shipping Days of Supply
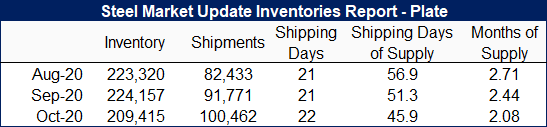
Plate = 45.9 Shipping Days of Supply
Flat Rolled
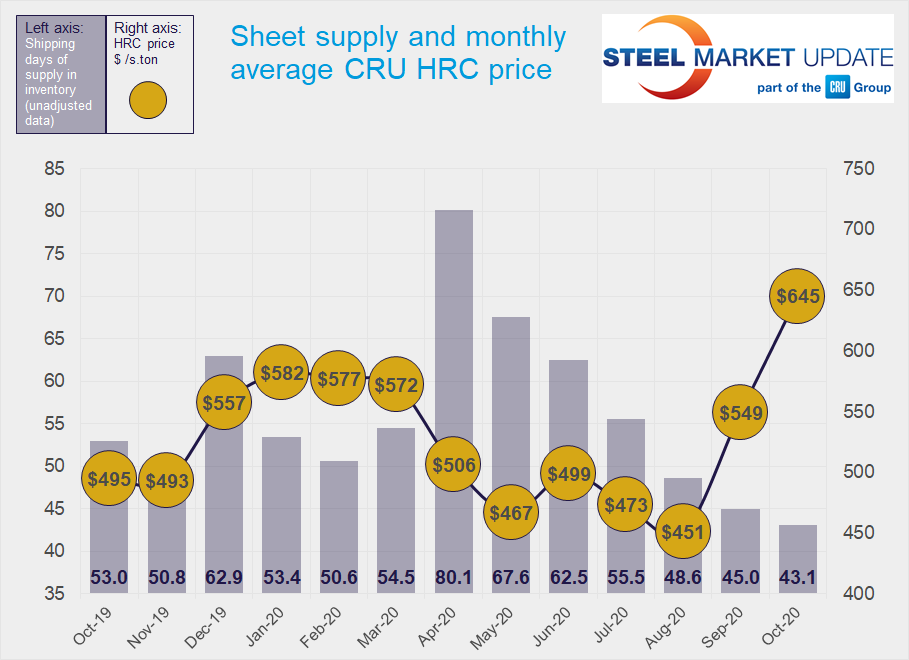
Service center flat roll inventories fell to a new low in October, amid extending mill lead times and shipment delays. Service centers carried 43.1 shipping days of supply at the end of October, which is a 3.8 percent decrease from 44.8 days in September. In terms of months on hand, inventories represented 1.96 months of supply in October, down from 2.13 in September.
The extremely lean inventories and extending mill lead times help to explain the $96/st month-on-month increase in HRC prices, using CRU’s average HRC price of $645/st in October. SMU reported HRC lead times at 6.58 weeks at the end of October, up from 6.15 weeks on Oct. 15.
Shipments for October increased 3 percent month on month, but the daily shipping rate was 1.5 percent lower. October had 22 shipping days compared to September’s 21.
On-order sheet volumes are easing back, which may be because mills have been slow to open their order books. Multiple market contacts said that some mills were running 2-4 weeks behind schedule, and that mills were not accepting orders for January. Though service centers contacts are anticipating a seasonal slowdown, it will be less pronounced than usual. Some sources have noted that they have had to no-quote some customers because they could not guarantee the material; this has given service centers confidence that the market will remain tight.
Sheet supply on order at the end of October was down slightly from September. Given the much lower inventories and long lead times, it is no surprise that the on-order volumes still represent a high percentage of inventories.
With prices rising sharply, the percentage of inventories committed to contracts increased to 58.7 percent in October, up from 53.6 in September.
Plate
Plate inventories fell 5.7 percent month on month, and supply reached a new low of 45.9 shipping days of supply. Plate supply was down from 51.3 shipping days of supply in September. Inventories represented 2.08 months of supply in October, down from 2.44 months in September.
Though the plate market has not seen the same supply constraints as sheet, plate prices have also gotten a boost from lean service center and end-user inventories. Mills have also been controlling their order entry for January. Average plate prices have increased $51/st month on month to $604/st in October.
Plate mill lead times have similarly edged out to 5.6 weeks at the end of October from 5.0 weeks on Oct. 15, according to SMU data.
With full data reported, plate shipments increased 9.5 percent month on month in October, and the daily shipping rate rose 4.5 percent.
With inventories falling to their lowest level recorded, the percentage of inventories on order rose from September.
The percentage of plate inventories committed to contract was nearly flat month on month at 33 percent.