Prices

October 22, 2020
Hot Rolled Futures: Shock and Awe
Written by Tim Stevenson
SMU contributor Tim Stevenson is a partner at Metal Edge Partners, a firm engaged in Risk Management and Strategic Advisory. In this role, he and his firm design and execute risk management strategies for clients along with providing process and analytical support. In Tim’s previous role, he was a Director at Cargill Risk Management, and prior to that led the derivative trading efforts within the North American Cargill Metals business. You can learn more about Metal Edge at www.metaledgepartners.com. Tim can be reached at Tim@metaledgepartners.com for queries/comments/questions.
The middle of August seems like a long time ago. We were awash in steel, prices were in the low $400s, and nobody needed inventory because lead times were two weeks or less. Fast forward to today and it seems like we are in a completely different universe. Check out the change in the forward curve from mid-August to now:
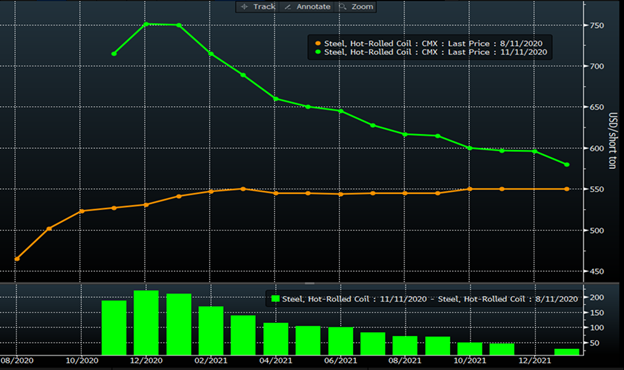
The green bars at the bottom of the chart show the price change per ton, in dollars. Quite the move! All in the middle of a pandemic….
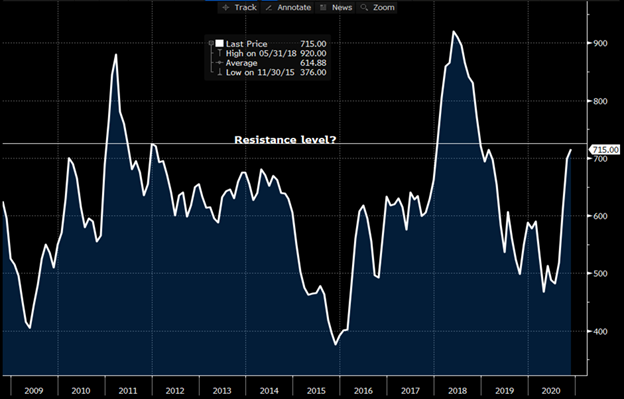
We believe that some long-term perspectives may be helpful in a market like this. The below chart shows the front month HRC futures contract, going back to 2008. While this move seems incredible, and in some ways it is record setting, the chart below shows that these kinds of things happen with some regularity. We sometimes have periods of relative tranquility—like from mid-2012 to mid-2014—but violent moves like we have just seen happen with some frequency. I’ve also drawn a line on the chart across the peak steel price that we hit at the end of 2011. We also almost touched this line on the “dead cat” bounce rally in early 2019 before we hooked lower again. The reason why this line may be important is that the prior two times we’ve blown through it the market has continued to run. We are not saying that will happen again this time, but it’s a bit spooky.
The “set up” for the current rally was a confluence of events:
• The prior rallies had been dead cat bounces, so many felt this one would be the same.
• We are in the middle of a global pandemic—how can prices go up much?
• Demand destruction was pervasive once the virus impact took hold in March and April, which had a significant impact on buyer sentiment.
• Capacity cuts were aggressive once they started.
• The Cliffs/ArcelorMittal deal looks like it may be a game changer for the industry.
• Auto and consumer demand have been much higher than expectations.
• Restarts haven’t happened yet.
Throw on a booming China market and high ore prices—and the fire was stoked. Speaking of ore, much has been made of the recent increase in inventories by some Wall Street banks. Indeed, look at the rise we have seen:
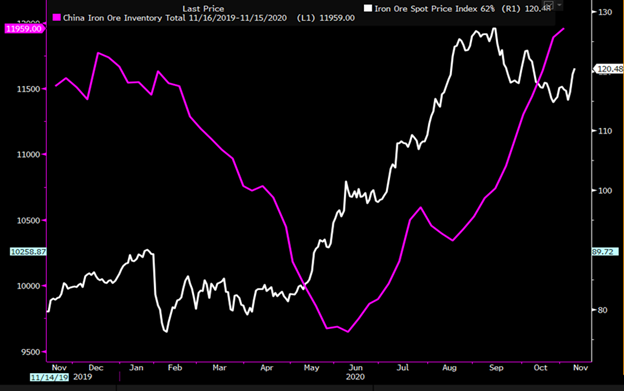
How can prices not be going down? Well, if you expand the view to a longer term perspective, the situation looks different:
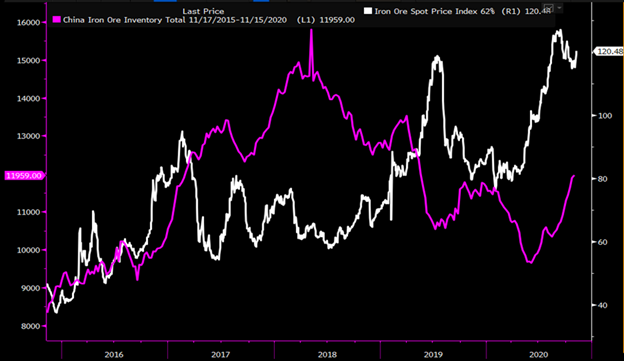
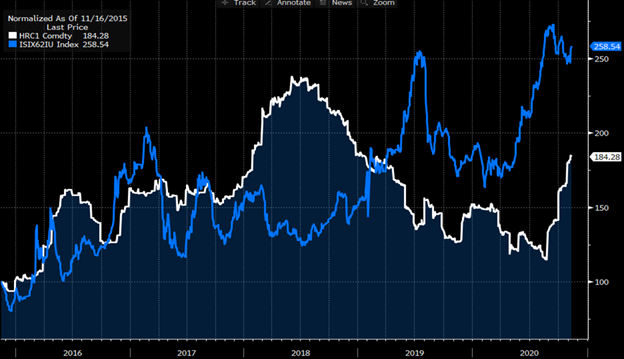
Ore inventories are rising, but from an extremely low level, and they are still way lower than they were in 2018. And given how much we have seen steel production growth expand in China, we’ve seen some analysts estimate that the current stockpiles are only 30 days of production. Also, check out how low ore prices were in 2018, when the S232 tariffs pushed steel prices way higher in the U.S. It’s a different picture today. The inflationary impact of ore is hard to overstate. The below chart shows the percentage change in U.S. HRC prices vs. the percentage change in ore going back to the same starting point. The index starts at 100, so the “258” next to the blue line means that ore has gone up 158% since late 2015. Steel prices in the U.S. have gone up 84%. So, while a number of the above factors (the list of drivers for the rally) are domestic issues, China’s nearly insatiable demand for ore has also contributed to the inflationary picture we see right now.
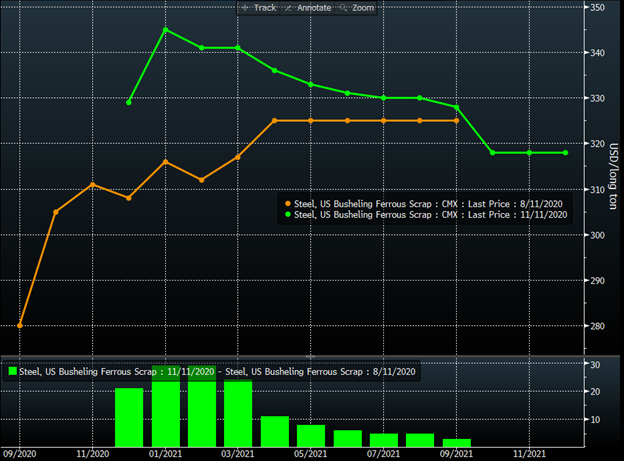
Shifting briefly over to scrap, I’ve kept the same dates on this chart as I did on the HRC chart at the very top of the article to show the changes from mid-August to now. What a difference! There should be simply massive margin expansion for the minimills in this environment. Scrap up $30, HRC up $200:
All told, we are witnessing a record-setting rally as supply constraints have been met with better than expected demand. As the old adage goes—“the cure for high prices is high prices.” Something will change to bring the market into equilibrium—but the question is when? Stay healthy everyone!
Disclaimer: The information in this write-up does not constitute “investment service,” “investment advice” or “financial product advice” as defined by laws and/or regulations in any jurisdiction. Neither does it constitute nor should be considered as any form of financial opinion or recommendation. The views expressed in the above article by Metal Edge Partners are subject to change based on market and other conditions. The information given above must be independently verified and Metal Edge Partners does not assume responsibility for the accuracy of the information


