Prices

October 22, 2020
Hot Rolled Futures: Demand and Supply Mismatch
Written by Tim Stevenson
SMU contributor Tim Stevenson is a partner at Metal Edge Partners, a firm engaged in Risk Management and Strategic Advisory. In this role, he and his firm design and execute risk management strategies for clients along with providing process and analytical support. In Tim’s previous role, he was a Director at Cargill Risk Management, and prior to that led the derivative trading efforts within the North American Cargill Metals business. You can learn more about Metal Edge at www.metaledgepartners.com. Tim can be reached at Tim@metaledgepartners.com for queries/comments/questions.
Steel futures have continued to be well bid over the past week. Tightness in the physical market has been well telegraphed by the extended mill lead times, and the potential Cliffs/Arcelor deal has caused some uncertainty as to when restarts of additional blast furnaces will take place. The below chart shows the week/week move in the HRC curve:
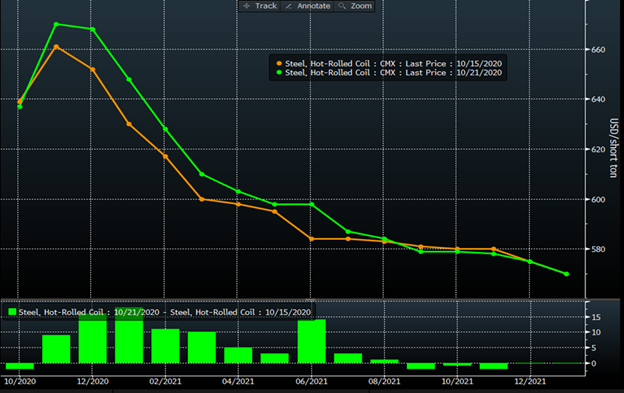
Most of the strength has been in the nearby months, which makes sense. Inventory levels are not excessive, we still have some furnaces idled, and demand seems to be OK. The months farther out on the curve aren’t seeing much upward movement.
Digging into demand a bit more in the U.S., the picture has been a bit more mixed from a macro perspective. The Philly Fed index soared to 32.3 last week, from 15.0 the prior month. Housing starts also were up just under 2%, although that was a bit less than expected. While not a huge driver of steel demand, single-family housing has been on fire so far in 2020, as evidenced by the below chart on new home sales:
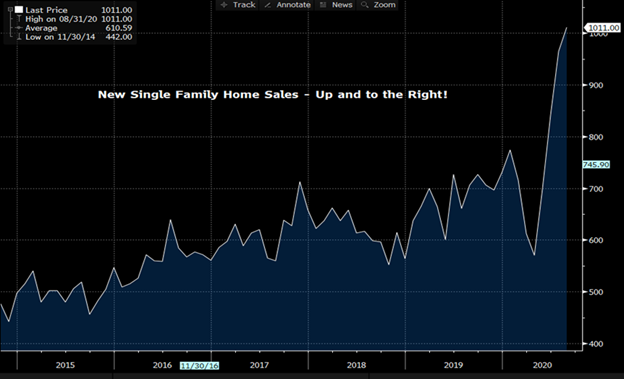
Again, not much steel goes into single-family home sales, but they do drive appliance purchases, and most companies in that space report very strong demand. As far as automotive demand goes, the recovery has been quite dramatic:
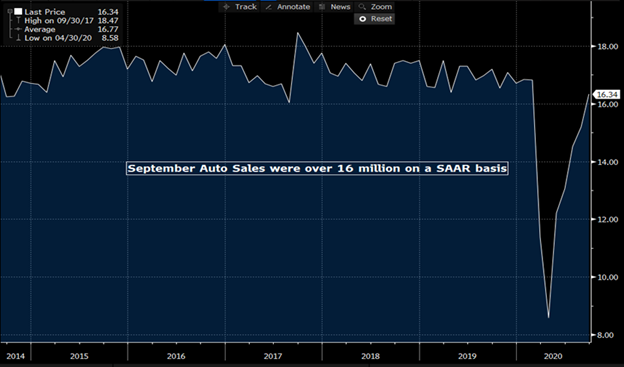
This is the definition of a “V” shaped recovery! Couple this with inventories at dealer lots reportedly near a nine-year low, and auto production is likely to stay high for a while until these inventories can be replenished. The strength in car sales is interesting, because it is happening without the rental car fleets buying much. This is understandable given how little travel is going on. In normal times, the rental car fleets buy around 20% of the cars that are sold. Taking 2019 as a benchmark, the 16.3 million SAAR selling rate we saw in September is all the more remarkable. In 2019, before any COVID-related economic disruptions, the total sales were roughly 16.9 million units. If we assume that rental car fleets were 20% of demand, this would put retail consumer demand at approximately 13.5 million units. Here we are, just a few months from the depths of the March/April COVID panic, and sales are 16.3 million without much help from the fleet buyers! There are several factors that may be driving this. First, average vehicle age is still high, and growing:
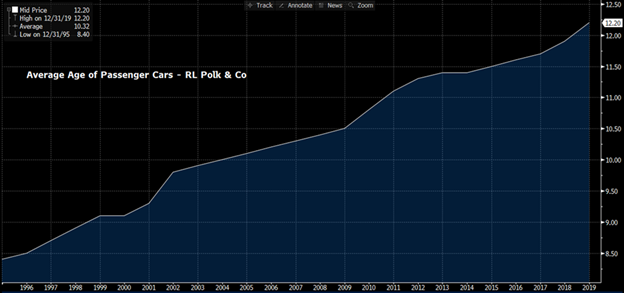
We will admit that new cars do last much longer than cars used to, but having the average age creep over 12 years is still a positive driver for new vehicle demand. Couple that with low interest rates and very strong used vehicle prices, and demand has been well supported. One additional driver of new car sales may be the fact that people are still shunning mass transit. The virus has made people less comfortable getting on a bus, subway or commuter train, and thus may be pushing them into their local dealership. However, there are still some warning signs out there. First, travel demand, and thus fleet demand for cars, remains depressed. Second, the strong level of consumer buying is perplexing, given that we are still running at a nearly 8% unemployment rate. It would be surprising to us if auto demand could remain just 4% under the 2019 sales level with this set of circumstances. Third, the University of Michigan Sentiment Survey also has a section on whether or not it is a “good time to buy a vehicle.” A chart of that index is below:
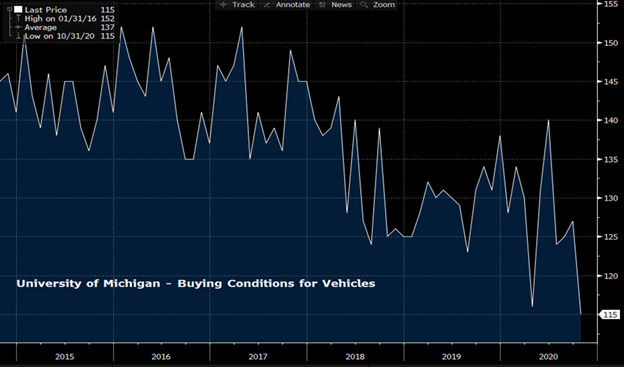
It’s hard to square this chart with the current auto sales pace! Clearly there are other factors at play that may become clearer over the coming months.
As far as other sectors, ag machinery seems to be on an uptrend, and even construction equipment seems to be bottoming. Volvo recently reported strong orders for construction machinery in their most recent release. Energy-related steel demand is still in a pretty dark place. And one last interesting datapoint was manufacturing production, which fell by 0.3% last month, versus expectations of a 0.6% rise. Kind of strange as we are climbing out of a recession.
In summary, the demand environment seems like it is in recovery mode, and the key question is when steel production will recover enough to move this market back into balance. For now, it seems we are still in a “deficit” until this happens.
Comparing the U.S. and European steel prices also paints an interesting picture:
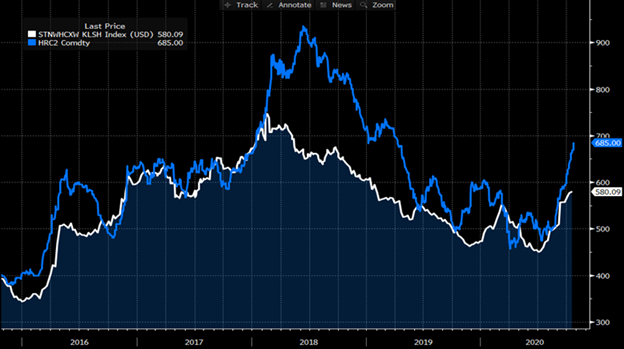
This is the second month U.S. HRC futures contract (second month, in blue) compared to the Kallanish NW Europe steel price index. Admittedly, we are comparing short tons and metric tons here, which makes the emerging spread even more interesting. Aside from the Section 232-induced divergence in 2018, we are closing in on some of the higher levels that we experienced in 2016.
The scrap curve shows a different picture than hot rolled steel:
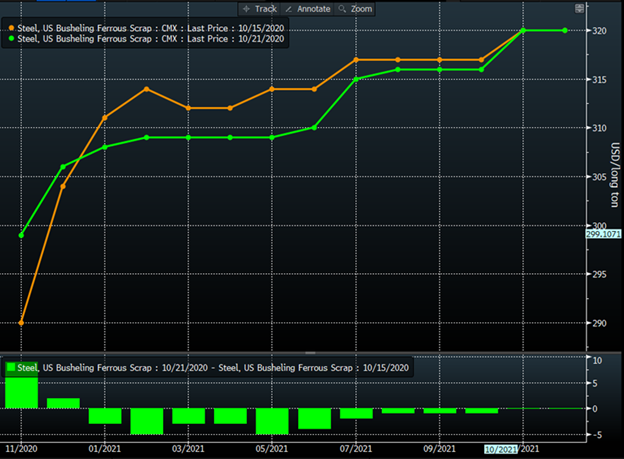
With the exception of the front two months, the scrap curve actually weakened on a week/week basis. October’s scrap mart was a bit soft, and this sentiment lingered into the middle of the month. Comparing the U.S. Busheling contract to the LME Turkish scrap contract shows a slight premium in scrap here in the U.S. This seems to be a relatively normal state of affairs over the past couple of years:
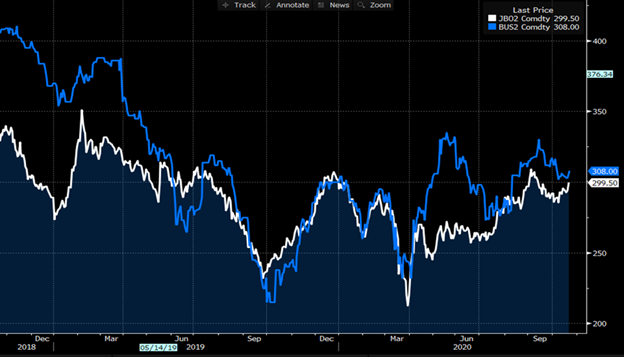
With all of the new steel capacity in the U.S. being minimill-based, one has to wonder how they plan to manage through the startups of all these mills. Busheling futures could offer an interesting tool, though we need to see further volume growth in order to get the mills’ attention. With that – we will wrap up for this week. Stay healthy!
Disclaimer: The information in this write-up does not constitute “investment service,” “investment advice” or “financial product advice” as defined by laws and/or regulations in any jurisdiction. Neither does it constitute nor should be considered as any form of financial opinion or recommendation. The views expressed in the above article by Metal Edge Partners are subject to change based on market and other conditions. The information given above must be independently verified and Metal Edge Partners does not assume responsibility for the accuracy of the information


