Product

October 15, 2020
HRC Futures: Nov/Dec Rocket Higher While Futures Curve Illustrates Doubt
Written by David Feldstein
Editor’s note: SMU Contributor David Feldstein is president of Rock Trading Advisors. David has over 20 years of financial market trading experience and has been active in the ferrous futures space for eight years. David earned an MBA from the University of Chicago Booth School of Business with concentrations in economics, statistics and analytical finance.
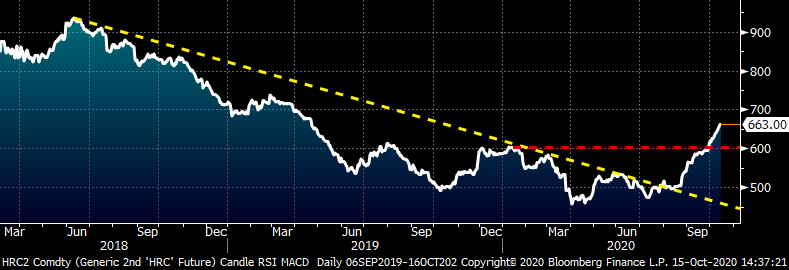
The explosive rally in the November CME Midwest HRC future continues. So far this week, it has already gained $25/t, now at $663/st. The November HRC future has rallied $140/t in two months.
Rolling 2nd Month CME Hot Rolled Coil Future $/st
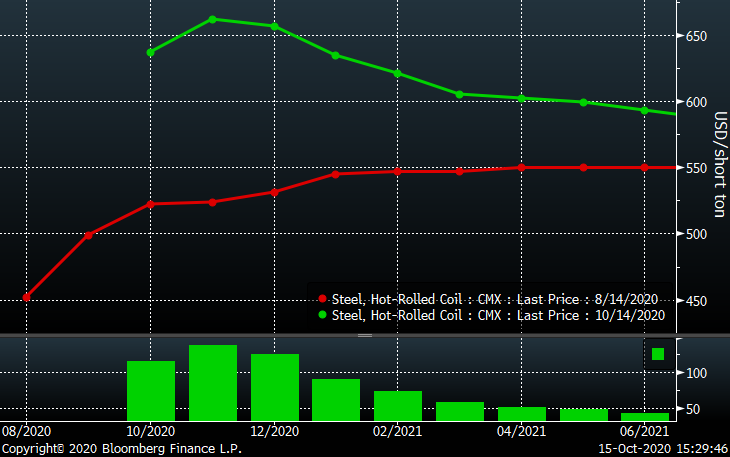
This graph shows the CME HR curve on Aug. 14 in red. At that point it was in contango (upward sloping) with the front month (August) future at $450. October and November were trading around $525. The curve looked to be pricing in a rebound, and it was correct. What a rebound it has been!
The curve from Wednesday night’s settlements (green) is backwardated (downward sloping). November has moved above October, and this week December, which has gained $50 since Friday, is now also above October. Then the curve falls back toward $600 for 2021.
CME Midwest HRC Futures Curve $/st
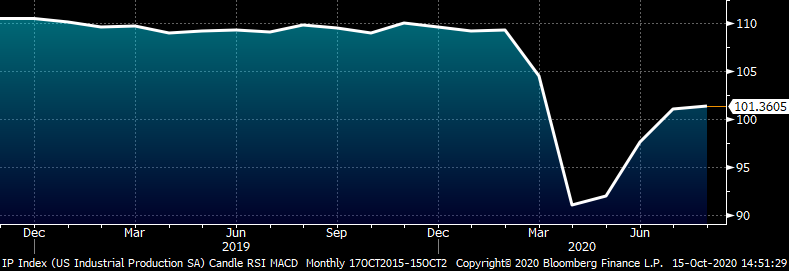
What could be causing market participants to doubt a continued Midwest HRC price above and possibly beyond $650? Could it be the weakness in U.S. and global manufacturing? Tomorrow, September U.S. industrial production is released. The chart of IP below is similar to many other economic data points looking like a backwards square root symbol. The IP data fits with most economists’ forecasts for slow grinding growth over the coming years. This chart illustrates this well. However, tremendous risk of a double dip recession remains. Many economists are calling for fiscal stimulus to avoid that.
U.S. Industrial Production Index
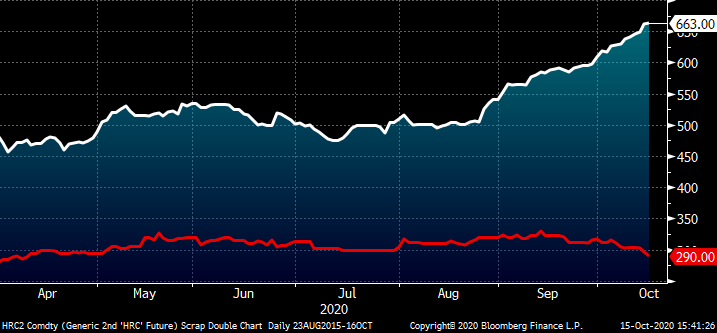
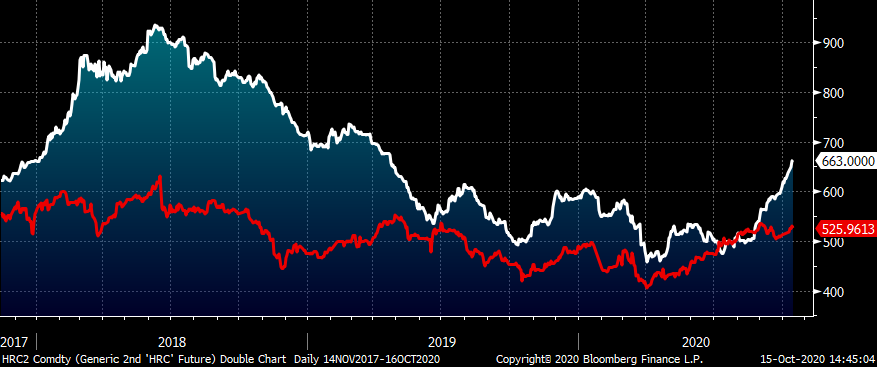
Could the HRC curve’s backwardation be due to weakness in scrap? This chart shows the move higher in hot rolled, while busheling has actually moved lower.
Rolling 2nd Month CME HRC Future $/st (white) & November CME Busheling Future $/lt (red)
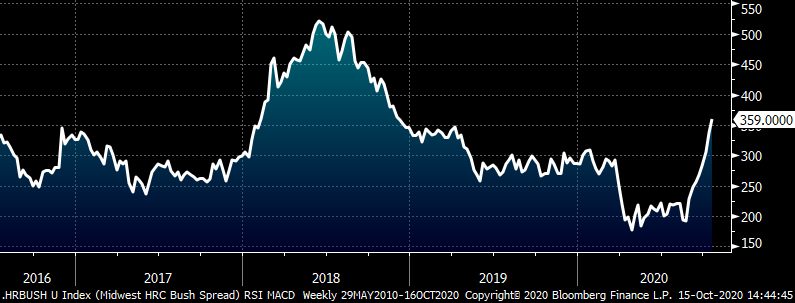
Could it be that the metal spread has blown out to $360/t? That is a fantastic profit per ton that perhaps is concerning some fearing that minimills will try to capture that spread by producing more tons and alleviating the “shortage.”
Metal Spread – Rolling 2nd Month Midwest HRC Minus Busheling Spread
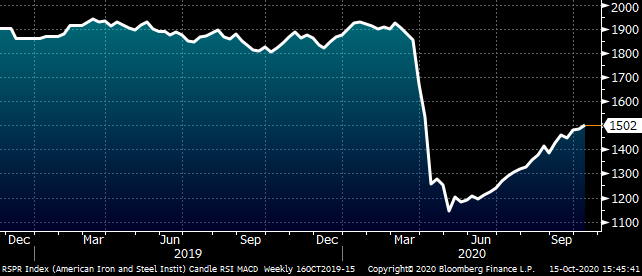
Much of the reason for the screaming rally is because there is a steel shortage. Why is there a steel shortage? Clearly more steel can be produced if the AISI is at 66% capacity. Why not bring back the mills idled earlier in the year? If the domestic EAFs aren’t buying scrap and the domestic BOFs aren’t bringing idled mills back online, is that why the futures curve is expressing little confidence in this rally continuing?
AISI Weekly Raw Crude Steel Production
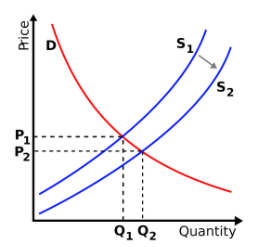
Is it because in economics we learned that as supply increases there is a shift to a new equilibrium with more quantity and relatively lower prices?
Or is it because if the price of Midwest hot rolled goes much higher, the tariff adjusted import window opens up supplanting demand for domestic tons?
Rolling 2nd Month Midwest HRC (white) & Chinese HRC (red) USD/st
Or is it that the dollar looks to have bottomed and is perhaps rallying while the euro falls? Europe is having a massive COVID outbreak that is forcing cities like London and Paris to effectively shut down.
Euro/U.S. Dollar Spot (left) & U.S. Dollar Index (right)

It could be the threat and uncertainty from COVID. This is a risk that is exceptionally underpriced. This chart shows the front month hot rolled future in white and the number of daily new COVID-19 infections in red with a 14-day moving average in yellow. Hot rolled moved sharply lower in response to both rapid increases in new daily cases.
Front Month CME Hot Rolled Coil Future $/st (white) New Daily COVID-19 Cases- USA (red)
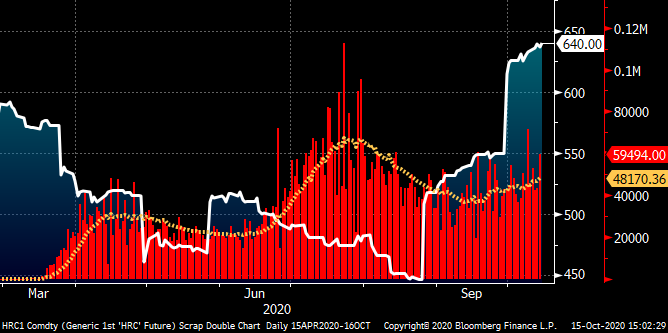
For weeks I have been warning my customers about the oncoming wave of new cases heading to the U.S. I watched Europe very carefully and saw a couple of important patterns. The first was that the proliferation across the continent was unstoppable. The contagion hit with precision. First Ukraine, Poland, Spain and France. Then the UK and the Netherlands. It moved into neighboring countries until almost every country saw an outbreak. Italy and Germany were the last two, but sure enough they are seeing exponential growth in new cases now.
The second observation is the pattern of the second wave in many places not only exceeding the top of the first wave, but doubling or more in some cases, like France. The graphic below shows the daily new cases in the United Kingdom from late August until today. Notice how it starts to build slowly from the top left to the top right, then in the bottom left section it breaches the previous high, which makes that previous high look insignificant (lower right).
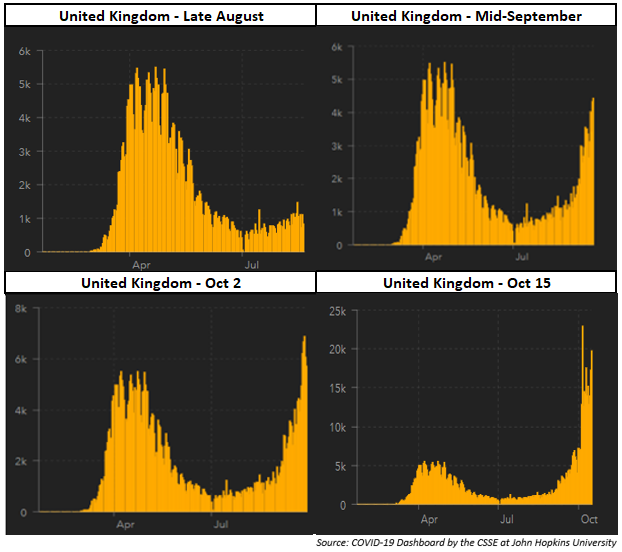
If that pattern happens in the U.S., the outbreak will wreak havoc on the economy and the hot rolled price will plunge. September service center inventory data shows inventory levels at record lows. What you may have missed is these same service centers with low inventory have a significant number of tons on order at the mills, thus, the price spike. Service centers maxed out contract tons in August, September and October and will be intaking those tons in the coming months. How many of those tons were for customers and how many were for restocking I don’t know, but if all of the sudden demand dries up, that is going to be a problem.
A swing in purchasing can be expected with the new elevated price simply from those contract tons shifting from max to minimum, while utilization continues to build and Big River starts melting steel at its brand new EAF. If the increasing mill supply has to compete with service center destocking due to this drop in demand, then as fast as it went up, it will go down.
I’ve been carrying this chart around in all my reports for about a month now. From left to right, the first yellow line is Memorial Day. The first red line is when it was obvious that new cases started to increase. The second red line is the peak in new cases and the third red line is when new cases cleared and these areas normalized again.
New Daily COVID-19 Cases-USA, CA, FL, TX
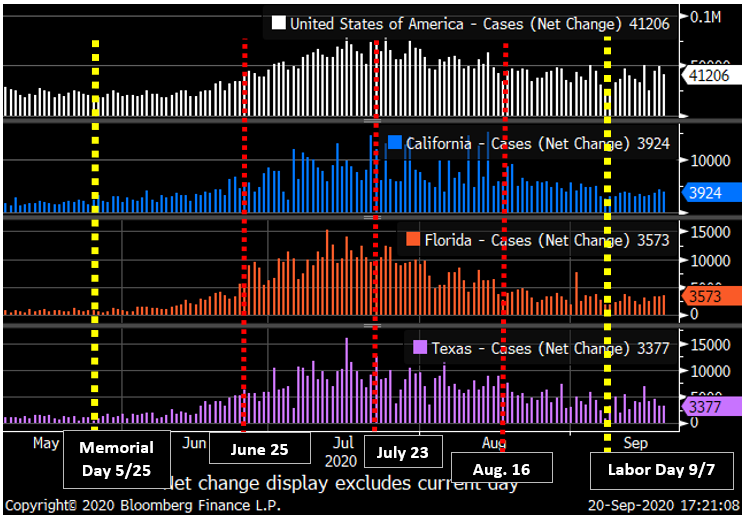
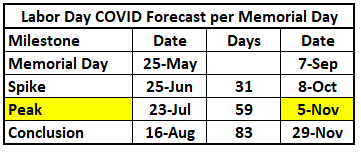
Extrapolating the same post Memorial Day timeline to Labor Day indicates the next wave is already occurring, is ramping up now to see rapid growth throughout October, and will peak right around the election if it follows a similar pattern.
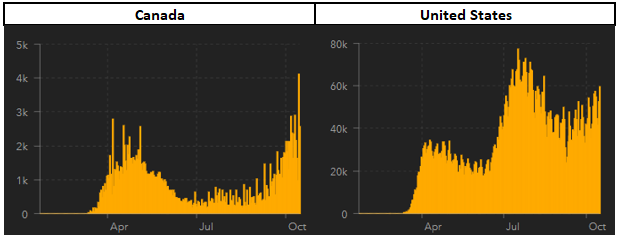
Back to the point I made about the contagion across Europe above. On the left is Canada’s chart of new daily cases and the U.S. on the right (both from today). Right now, states seeing the worst outbreaks include New York, Wisconsin, Minnesota and North Dakota, which all share a border with Canada. If the U.S. then sees state to state contagion like the country to country contagion seen in Europe, just look at the map and watch the Midwest and Northeast.
Here are some of today’s headlines:
“France reports 30,621 new coronavirus cases in 24 hours”
“Futures sink on despair over stimulus, virus curbs.”
“London bans households mixing; Paris orders evening curfew.”
“Covid’s Midwest surge hits populous Illinois, Ohio and Michigan.”
While I know it is not very popular to discuss this topic, I have focused much of my attention on COVID and not only feel very confident in my understanding, analysis and forecast, but also a sense of obligation to express this to you, unfortunately. The exponential growth in new cases has a stealth like insidious nature to it. Exponential growth is about doubling. Going from 2 to 4 to 8 to 16 to 32 to 64 doesn’t garner much attention, definitely little action. When it goes from 64 to 128 to 256 to 512 to 1,024, 2,000, 4,000, 8,000 to 16,000, then people start rapidly adjusting their behavior in ways that are very costly to the economy. So far, the only solution to an out of hand COVID outbreak is avoiding other humans. Europe is a perfect example of that.
Hedging downside price risk in CME HRC futures had worked very well this year. I have been providing an update for the last few articles looking at implementing a strategy of selling futures at 1) $520, 2) 90 days and 3) 60 days prior to settlement. The gains made during April through August have been wiped out in September, October and so far November with all three strategies turning negative. So, was implementing a hedging strategy this year a total failure?
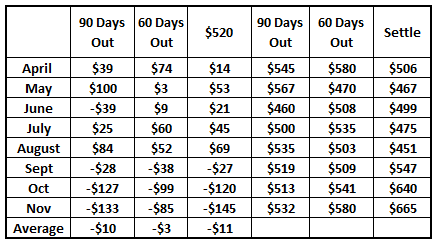
Absolutely not. The primary purpose of hedging is to smooth out cashflows and it did just that. A service center’s entire organization is correlated with prices moving higher. Sales, volume, inventory, price risk, etc. The hedge strategy is the only noncorrelated part of the business that makes money when prices and volumes are falling. This year, the hedging strategy provided the business with much needed cash to weather the tougher months. Now, the organization should be running on all cylinders. Not only can inventory, especially aged inventory, be moved, but also at fantastic margins. Folks in sales and marketing are busy, sprits are lifted and making profits for the firm. Tons bought last month are worth more this month. The bank is happy. Life is good. It is not that different from insurance, giving up some of the upside to better manage the downside. These trade-offs are what make hedging a fantastic component of the overall business strategy.
Disclaimer: The content of this article is for informational purposes only. The views in this article do not represent financial services or advice. Any opinion expressed by Mr. Feldstein should not be treated as a specific inducement to make a particular investment or follow a particular strategy, but only as an expression of his opinion. Views and forecasts expressed are as of date indicated, are subject to change without notice, may not come to be and do not represent a recommendation or offer of any particular security, strategy or investment. Strategies mentioned may not be suitable for you. You must make an independent decision regarding investments or strategies mentioned in this article. It is recommended you consider your own particular circumstances and seek the advice from a financial professional before taking action in financial markets.


