Prices

October 8, 2020
Hot Rolled Futures: Perfect Storm?
Written by Jack Marshall
The following article on the hot rolled coil (HRC) steel and financial futures markets was written by Jack Marshall of Crunch Risk LLC. Here is how Jack saw trading over the past week:
Hot Rolled
Hot rolled spot prices have risen sharply in the last month in step with mill lead times that have moved out significantly for deliveries in mid Nov’20 and as late as Dec’20. The latest HR index is $605/ST, which reflects almost a $120/ST increase from early Sep’20. The latest weekly HR Spot Index was reported up $5, which compares with an average of almost $28 per week in Sep’20.
HR service center inventories appear to be near the lower end of their recent ranges, as seen in recent SMU Service Center inventory data. Given the uneven nature of the pandemic and its impact on supply chains, it seems unlikely many service centers will change much. However, the recent futures activity and thinner volumes suggest there is concern that inventories could get too low in an environment where supply is temporarily constrained. It is being reported that HR order demand has been pretty robust. Recent restrictions on the supply of slabs along with reduced BOF capacity due to idling of some assets in conjunction with numerous planned short-term outages at a number of mills in October could further constrain supply and help push prices up further.
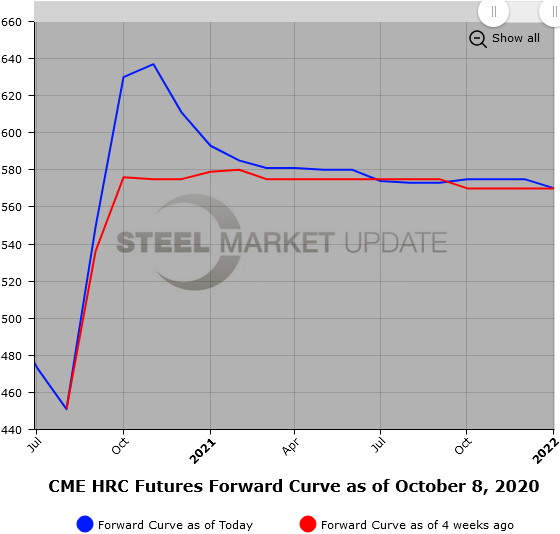
Where are we in the latest business cycle and how does the futures market reflect market expectations? The current HR forward curve has shifted up from early September. This is likely due to short covering and squaring up of positions in front of the Nov. 3 election. HR futures volumes have moderated as participants move to the sidelines as they square up positions. To compare early Sep’20 with yesterday’s settlements close, Q4’20 HR futures prices are $55/ST higher, Q1’21 and Q2’21 HR futures prices are $15/ST higher, and Q3’21 HR futures prices are $7/ST higher than one month ago. In early September, the futures curve was basically flat $565-570/ST as compared to yesterday where there is almost a $50/ST backwardation. Currently, the HR futures price curve peaks in Nov’20 at $630/ST and declines to $573/ST 12 months forward based on yesterday’s closing values.
As the HR spot market price pushes higher, expect the curve to get more steeply backwardated as participants look for prices to mean revert as the cycle ends.

Scrap
Early indications for Oct’20 BUS suggested prices would be up $10-20/GT, but the latest word is that BUS for Oct’20 will be sideways to slightly higher. Sep’20 BUS settled at just under $289/GT. The current selling cycle has the front month metal margin (HR-BUS) at around $338/ton ($630/ST//$292/GT). This spread currently narrows as you move further out the futures curve. For example, one could sell the Dec’20 metal margin spread this morning for $298/ton (HR $610/ST// $312/GT). The current wide margin for this spread reflects the strong price move of both instruments since early September when this same Oct HR-BUS spread was valued at $248/ton ($565/ST//$317/GT). In that time the BUS price has declined by $25/GT and the HR price has risen $65/ST. After what appeared to be a constrained supply due to manufacturing shutdowns, it appears supply is back on a more normal path and demand could be the culprit. Lower demand by BOF mills due to planned outages and idling of some assets might go some way toward explaining the strong move out in the metal margin. Also, no constraints on the importation of scrap and scrap substitutes.


