

Market Data

August 31, 2020
Shipments and Inventories Through June
Written by Peter Wright
Census Bureau data for downstream steel product shipments lags, but supports AISI data for crude steel production.
The Census Bureau provides monthly data on manufacturing inventories, shipments and new orders for total U.S. manufacturing and for individual industries, one of which is steel products. Therefore, the Census Bureau provides a useful reality check for steel industry trade association data, which is most widely used to assess the state of the industry.
![]()
Total shipments and inventories are reported in millions of dollars seasonally adjusted. Year over year through June, total manufactured product shipments declined by 9.1 percent as steel product shipments declined by 12.5 percent. Figures 1 and 2 show the history of both since 2005. In April year over year, total manufacturing shipments were down by 19.4 percent and steel product shipments were down by 21.4 percent.

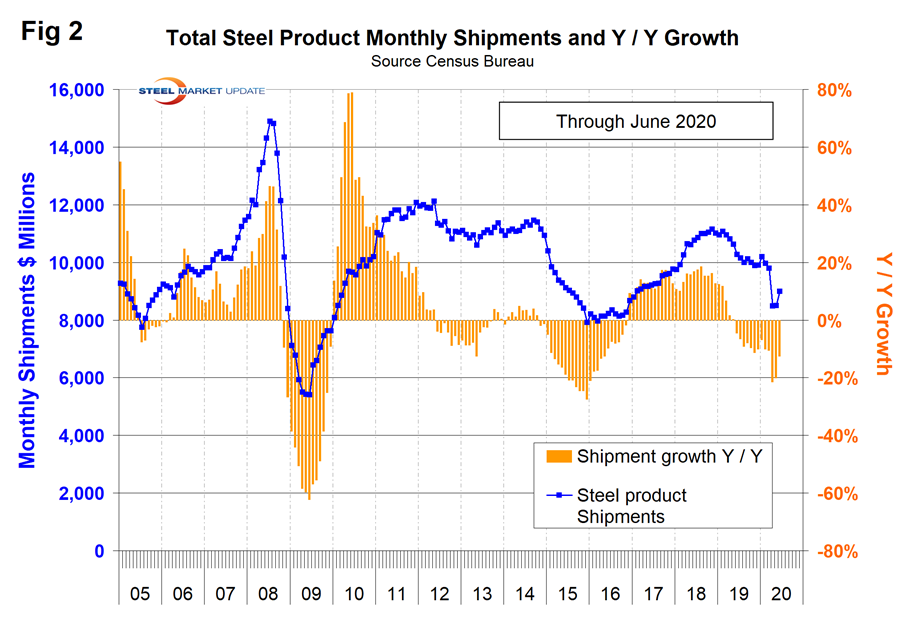
Figure 2 shows monthly steel product shipments in millions of dollars with the year-over-year growth through June. Shipments of steel products had a recent peak in November 2018 with the pandemic-driven decline evident in April. The year over year growth rate has declined from 18.6 percent in August 2018. The Census Bureau defines shipments as follows: “Manufacturers’ shipments measure the dollar value of products sold by manufacturing establishments and are based on net selling values, f.o.b. (free on board) plant, after discounts and allowances are excluded. Freight charges and excise taxes are excluded. Multi-industry companies report value information for each industry category as if it were a separate economic unit. Thus, products transferred from one plant to another are valued at their full economic value.”
In our SMU reports, we aim to provide information on the same subject from different sources. The data in Figure 2 compares quite well over the long term with the AISI weekly crude steel production shown in Figure 3, which is more current than the Census data. Figure 2 is in dollars and Figure 3 is in tons, but the shape of the curves is comparable. The AISI weekly tonnage had a recent bottom in the week ending May 9 on a four-week moving average basis as shown in Figure 3 and has steadily improved since then, but year over year was still down by 27.1 percent in week ending Aug. 15.
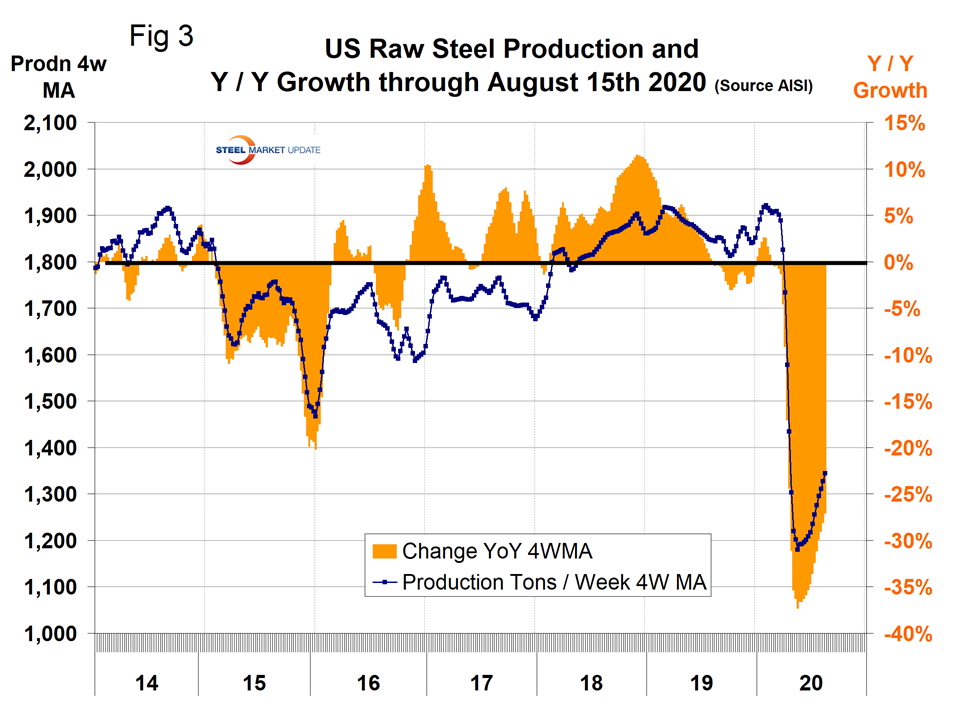
Figure 4 shows shipments and new orders on a monthly basis for all steel products since 2010. New orders declined much more than shipments in April, but by June were back in balance.
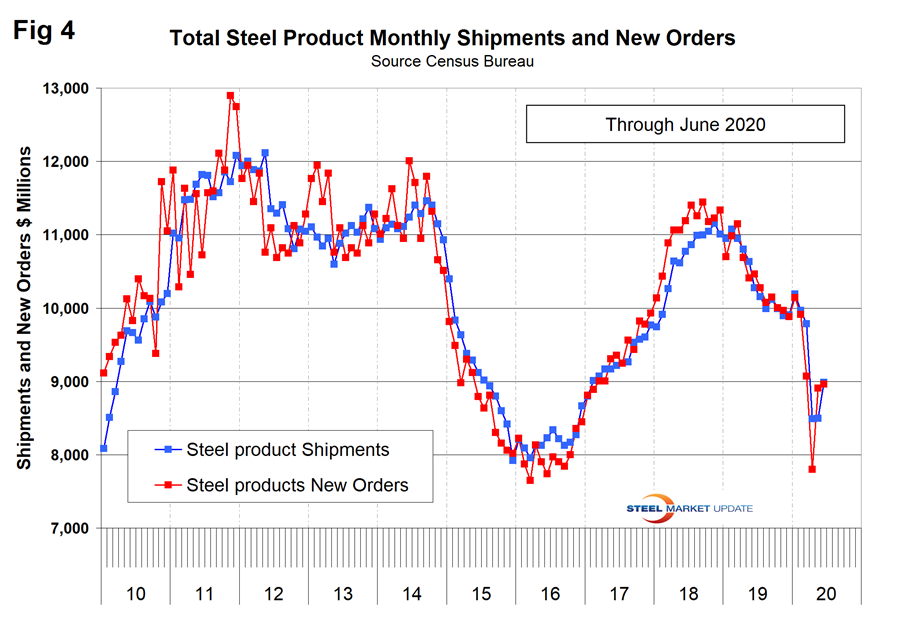
Figure 5 shows the same total shipment line as Figure 2, but now includes the inventory-to-shipment ratio. The IS ratio shot up in April, but has since declined almost to the recent norm. Shipments improved by 5.8 percent between May and June.
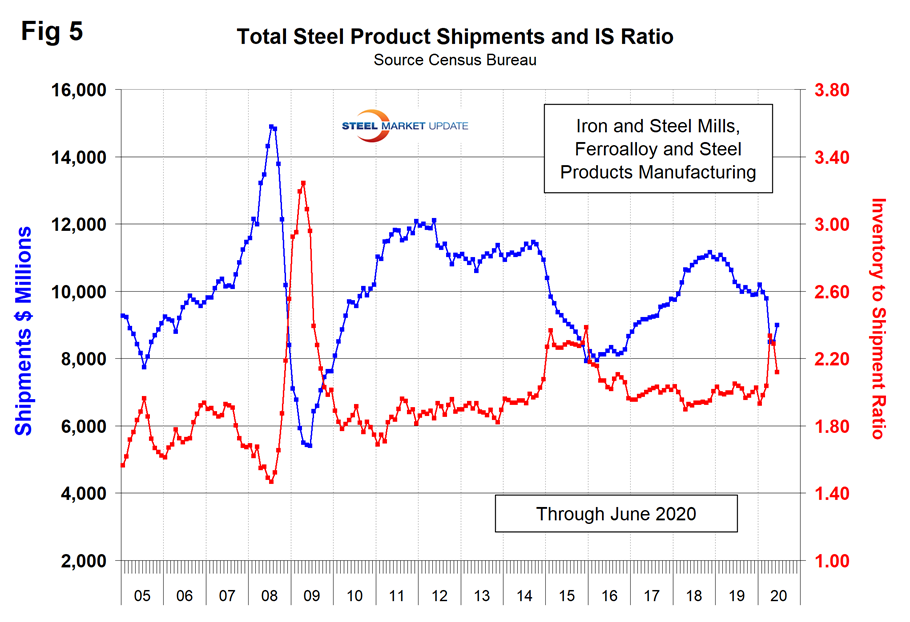
Figure 6 shows total inventory in millions of dollars and repeats the inventory-to-shipment ratio shown in Figure 5.

SMU Comment: Data from the Census Bureau for steel product orders, shipments and inventories indicates that steel product shipments were hit harder than total manufacturing in April, and in May and June have recovered more slowly. The IS ratio of both total manufactured goods and products made from iron and steel peaked in April and declined in both May and June. In the week ending Aug. 15, steel mill capacity utilization was 61.5 percent, but this measure was positively influenced by the AISI’s reduction of the total annual U.S. capacity by 4.7 million tons since March 14.


