Market Data

July 19, 2020
Regional Jobs Report: States See Uneven Recovery
Written by Peter Wright
Since the severe pandemic-led job losses of March and April, all regions and all states have seen some level of recovery, though not on a uniform basis. The recovery in Michigan has far exceeded that of Texas, for example, a reversal of what is considered the normal employment pattern.
Comparing September to April on a state-by-state basis, Michigan employment has improved the most at 18 percent, followed by Vermont at 15.9 percent and Nevada at 13.9 percent. States with the highest number of employed people are New York, Florida, Texas and California, which have recovered by 10.2 percent, 8.1 percent, 5.7 percent and 6.6 percent, respectively. On a regional basis comparing Q3 with Q2 2020, the North East and New England have performed the best with job increases of 5.0 and 4.9 percent. South Central has performed the worst with a 1.4 percent increase.
Third-quarter regional employment data by state was released by the Bureau of Labor Statistics (BLS) on Oct. 21. The state data follows and confirms the employment situation that we reported at the national level two weeks ago. The states compile their employment numbers independently of the feds, and then both are reported by the BLS. In the first three quarters of 2020, the states reported a total number of job losses of 10.076 million and the feds reported losses of 10.278 million. Our report covers only the lower 48 states and the state numbers don’t include individuals such as those in the military who are employed overseas. Therefore, the federal and state totals are close. Figure 1 shows the history of federal data totals since 1992 and Figure 2 shows the same format for the state data.


SMU has graphs in the same format for 10 geographic regions and can produce them for individual states on request. Figure 3 shows the history of the South Central region.

The 10 geographic regions described in this report are:
New England (CT, ME, MA, NH, RI, VT)
North East (NY, PA, NJ)
Mid Atlantic (DE, DC, MD, NC, SC, VA, WV)
North Central (IA, KS, MN, MO, NE, ND, SD)
East North Central (IL, IN, MI, OH, WI)
East South Central (AL, KY, MS, TN)
South Central (TX, OK, LA, AR)
Mountain (AZ, CO, ID, MT, NV, NM, UT, WY)
Pacific (CA, OR, WA)
South East (FL, GA)
Table 1 shows the seasonally adjusted history of employment changes by region since Q1 2017. In Q3 2020, all regions recovered to some degree. The North East gained the most jobs and the East South Central gained the least.
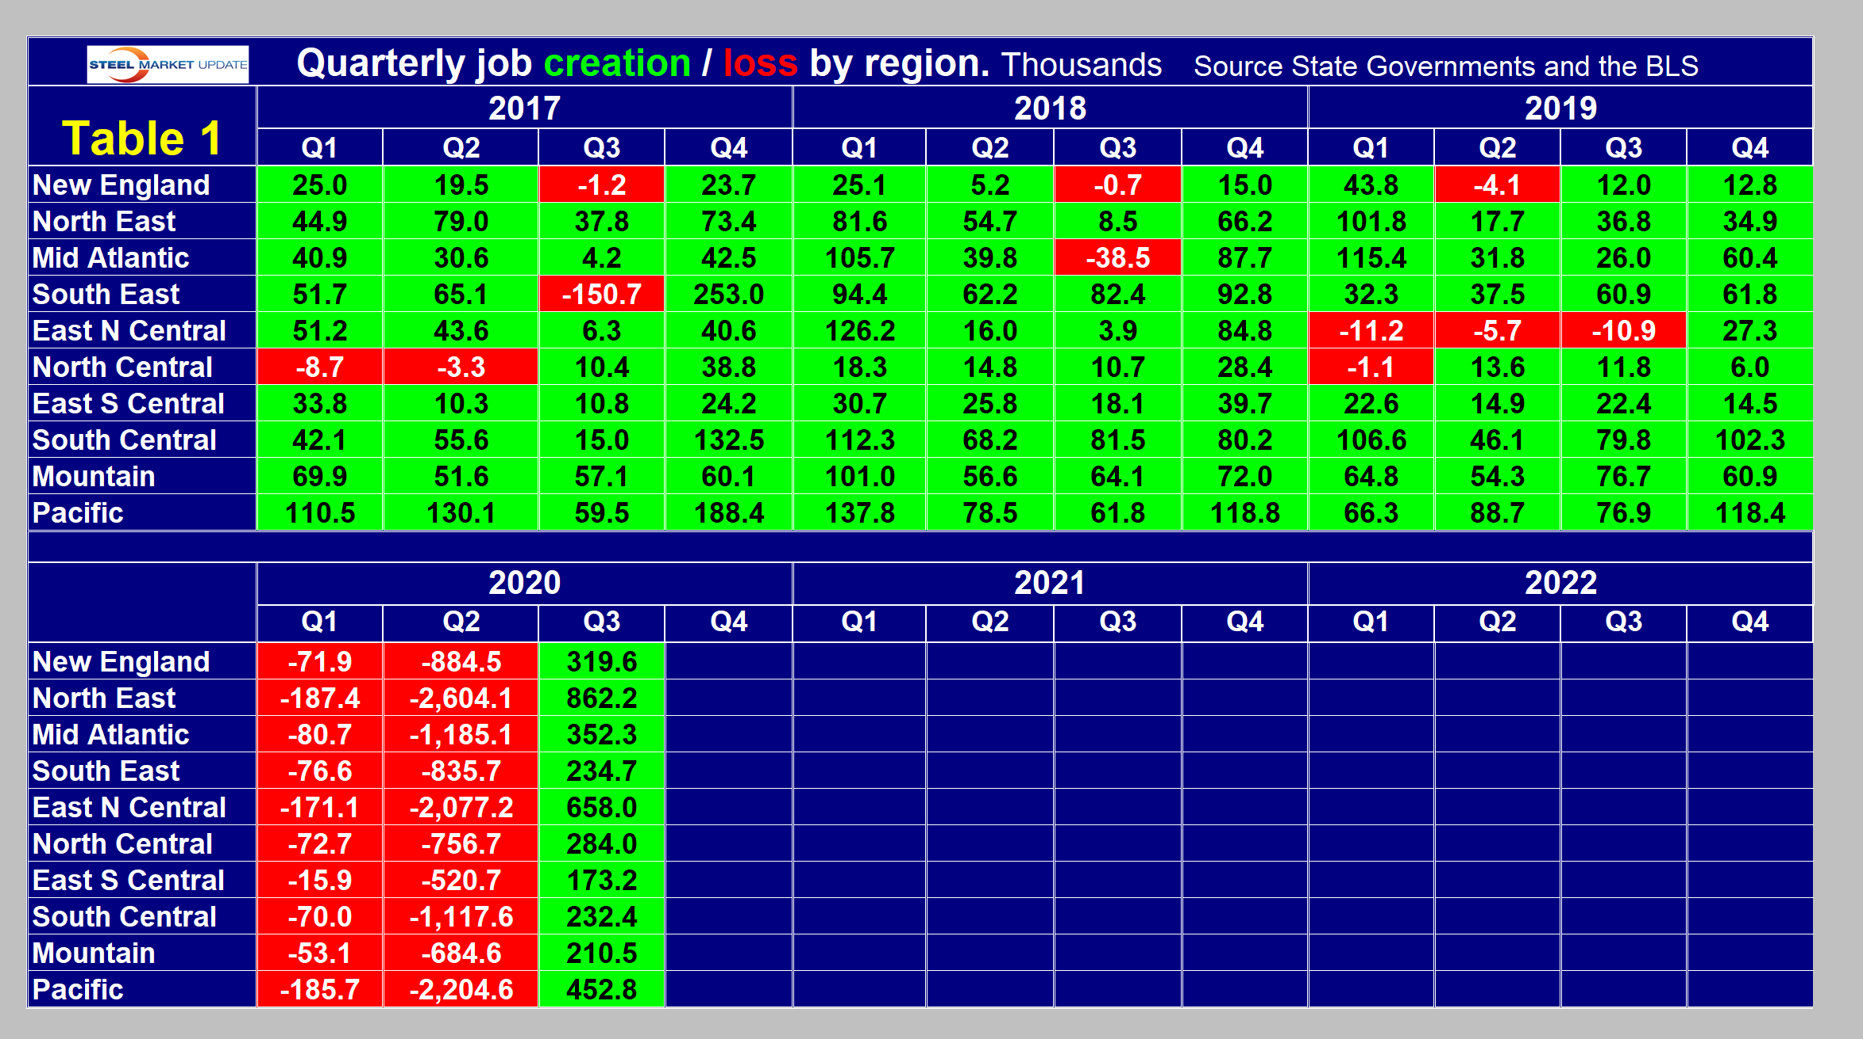
Table 2 shows the change in employment by region in the first three quarters of 2020. Based on state data, the nation as a whole lost 13.856 million jobs in the first three quarters of 2020 (Table 2).

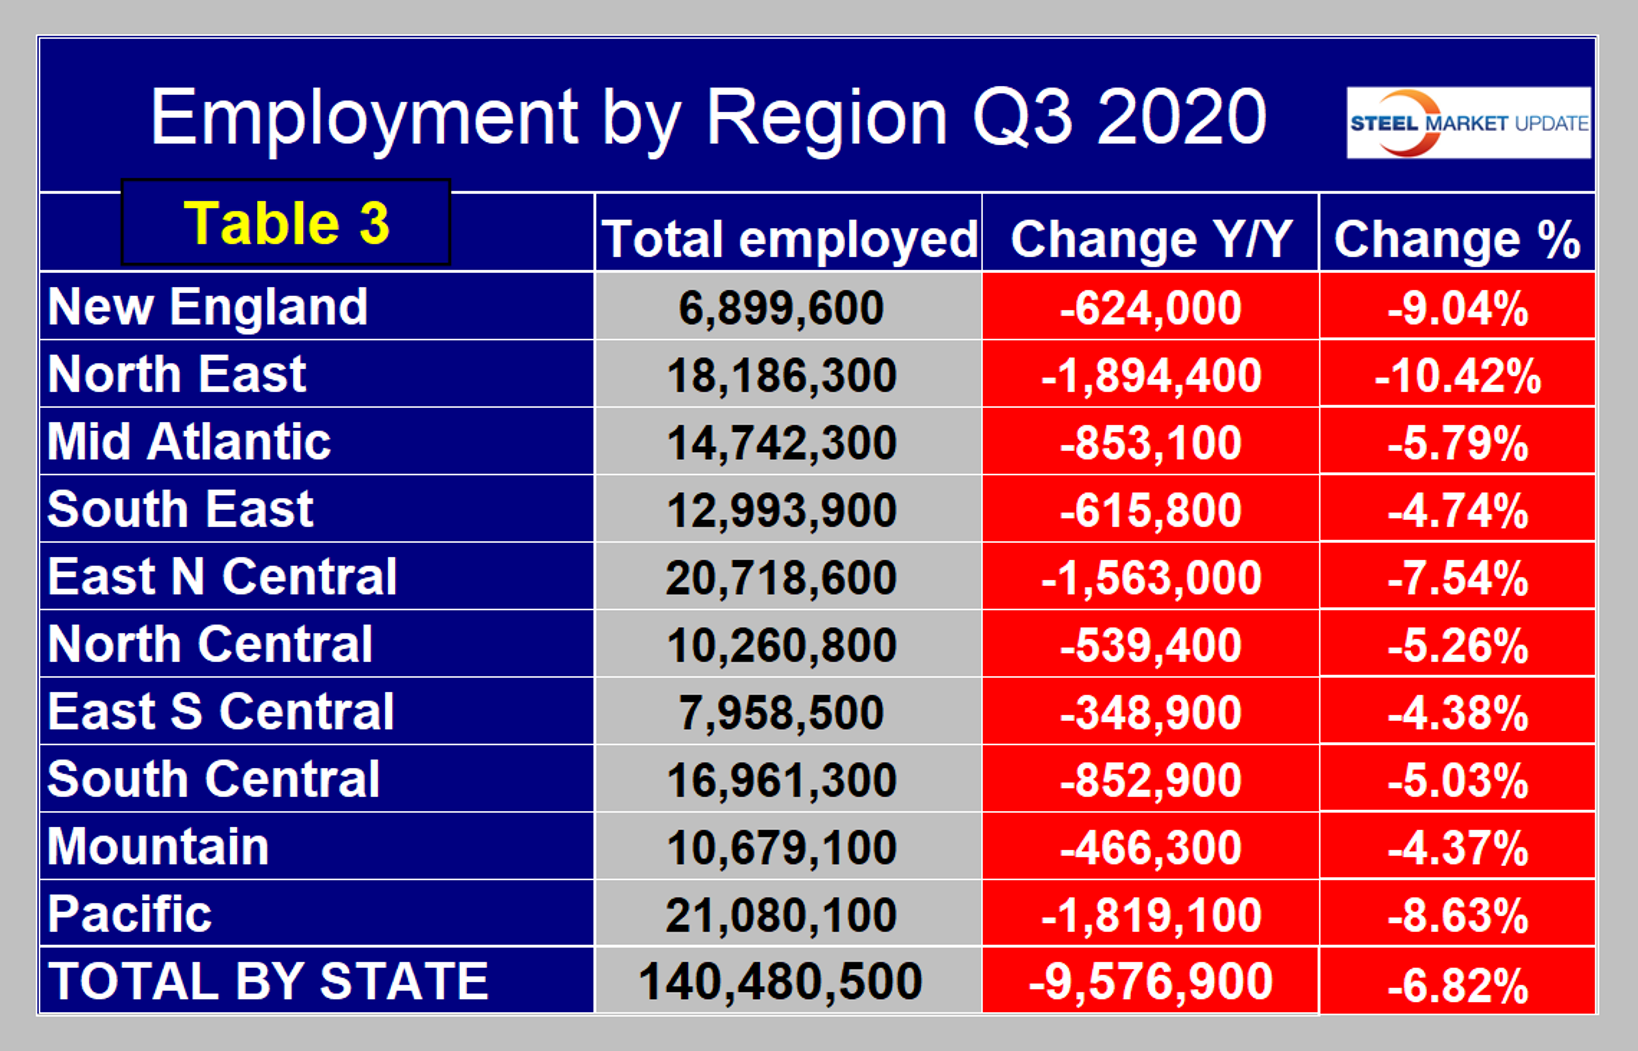
The Pacific region continues to have the highest number of people employed, followed by the East North Central. Year over year, the North East, Pacific and East North Central regions have lost the most jobs, and on a percentage basis these accounted for three of the four highest losses. From Q3 2019 through Q3 2020, the Mountain region suffered the least on a percentage basis followed by the East South Central and the South East (Table 3).