

Market Data

June 5, 2020
Sheet Shipments and Inventories Through May
Written by Peter Wright
Census Bureau data for downstream steel product shipments lags but supports American Iron and Steel Institute (AISI) data for crude steel production.
The Census Bureau provides monthly data on manufacturing inventories, shipments and new orders for total U.S. manufacturing and for individual industries, one of which is steel products. Therefore, the Census Bureau provides a useful reality check for the steel industry trade association data that is most widely used to assess the state of the industry.
Total shipments and inventories are reported in millions of dollars seasonally adjusted. Year over year through April, total manufactured product shipments declined by 18.9 percent as steel product shipments declined by 21.3 percent. Figures 1 and 2 show the history of both since 2005.

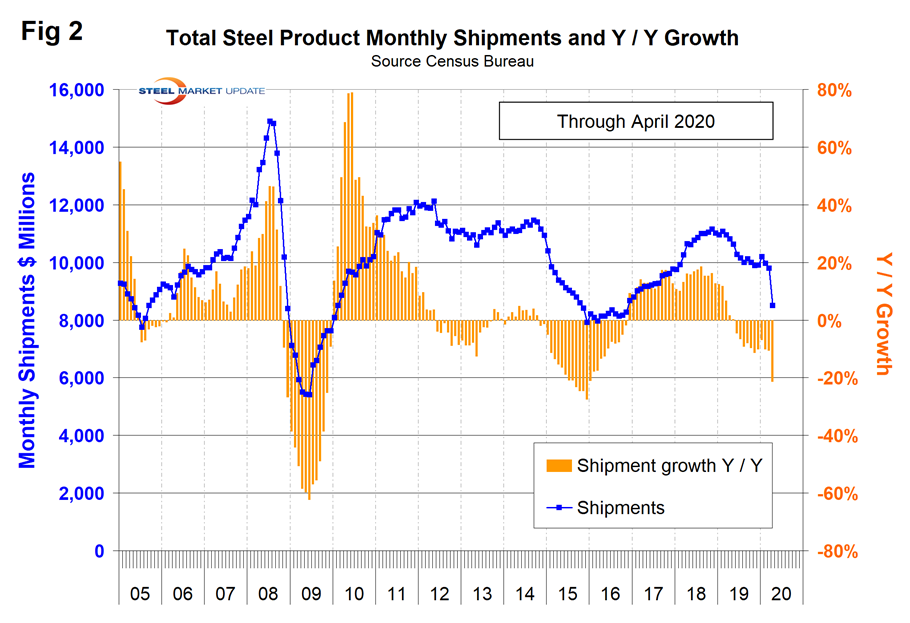
Census Bureau results for April were released on June 3. Figure 2 shows monthly steel product shipments in millions of dollars with the year-over-year growth through April. Shipments of steel products had a recent peak in November 2018 with the beginning of the pandemic decline evident in April. The year-over-year growth rate has declined from 18.6 percent in August 2018 to negative 21.3 percent in April 2020. The Census Bureau defines shipments as follows: “Manufacturers’ shipments measure the dollar value of products sold by manufacturing establishments and are based on net selling values, f.o.b. (free on board) plant, after discounts and allowances are excluded. Freight charges and excise taxes are excluded. Multi-industry companies report value information for each industry category as if it were a separate economic unit. Thus, products transferred from one plant to another are valued at their full economic value.”
In our SMU reports, we aim to provide information on the same subject from different sources. The data in Figure 2 compares well over the long term with the AISI weekly crude steel production shown in Figure 3, which is four weeks more current than the Census data. Figure 2 is in dollars and Figure 3 is in tons, but the shape of the curves is comparable. The AISI weekly tonnage had a recent bottom in the week ending Oct. 5 last year on a four-week moving average basis as shown in Figure 3 and is current as of May 30.
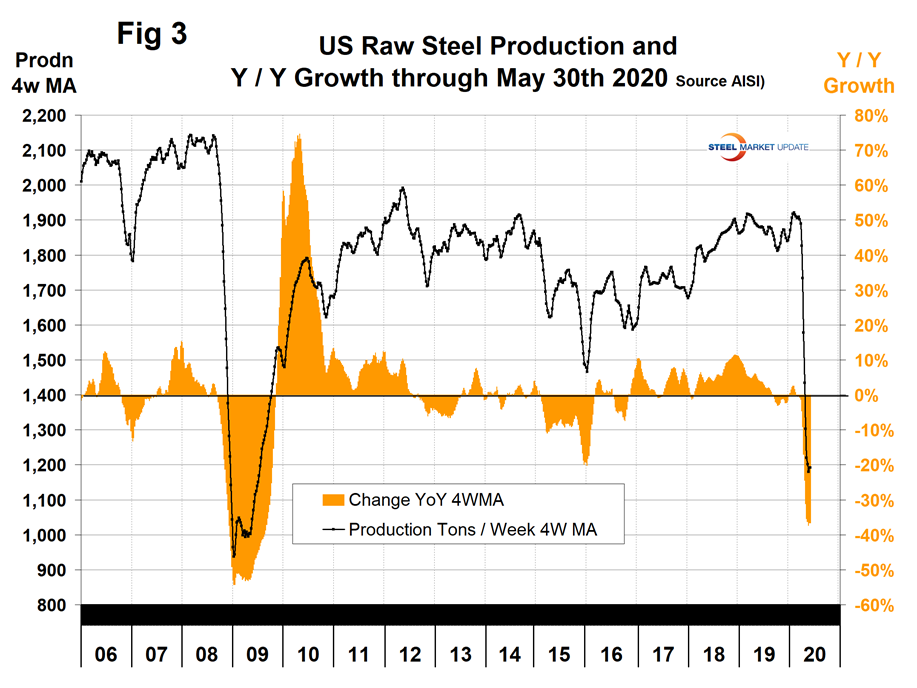
Both Figures 2 and 3 highlight the steel recession of 2015. The AISI data is four weeks more current than that from the Commerce Department and shows a negative 35 percent year-over-year growth in the week ending May 30. Since the Commerce Department data is for steel products and the AISI data is for crude production, there is at least another two months difference in time frame. We can expect the Commerce data to show a continuing massive decline in the next few months.
Figure 4 shows shipments and new orders on a monthly basis for all steel products since 2010. Currently, orders are declining faster than shipments.
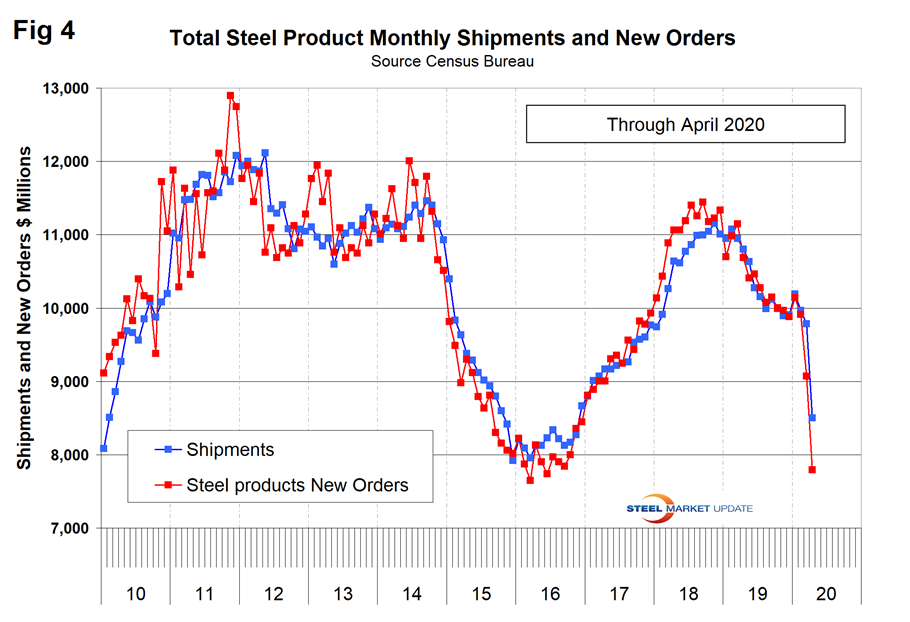
Figure 5 shows the same total shipment line as Figure 2 but now includes the inventory-to-shipment ratio. The IS ratio shot up in April as shipments declined.
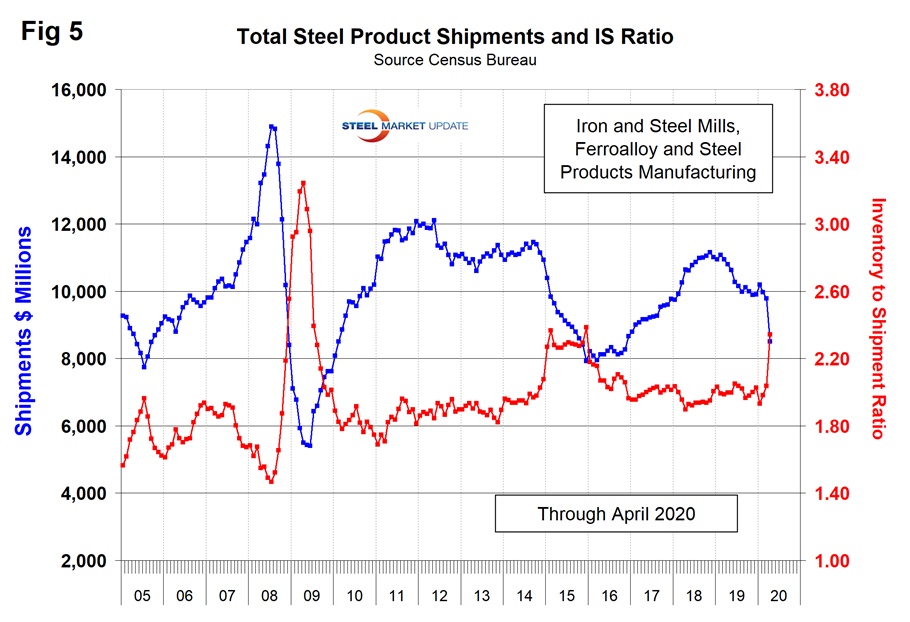
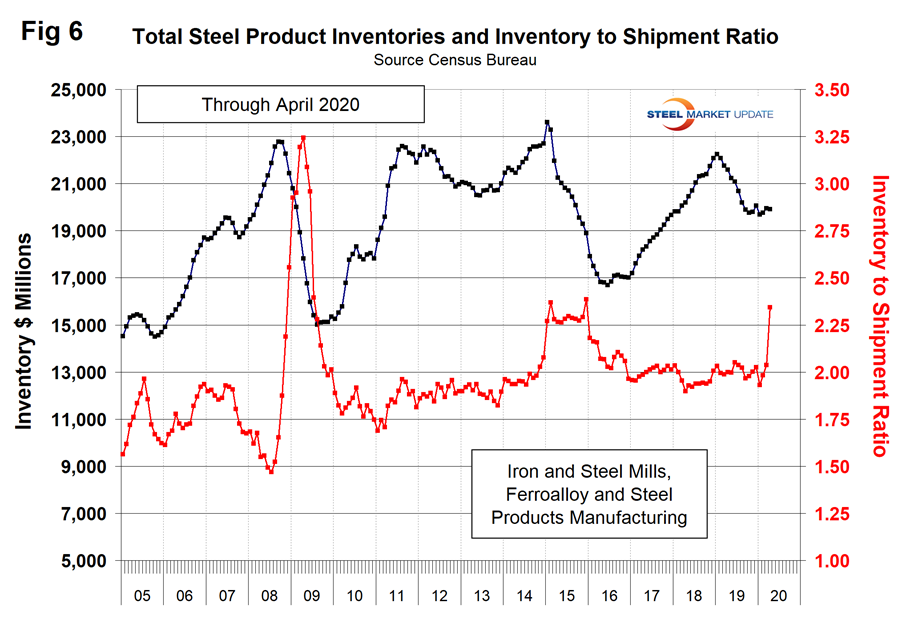
Figure 6 shows total inventory in millions of dollars and repeats the inventory-to-shipment ratio shown in Figure 5. Inventories through April had not yet responded to the crisis, which will exacerbate the steel demand situation going forward.
SMU Comment: Data from the Census Bureau for steel product orders, shipments and inventories tells the same story as AISI data for weekly steel production, but with more economic detail. In the week ending May 30, steel mill capacity utilization was 53.8 percent, but this is an overstatement because AISI has reduced the total annual U.S. capacity by 4.7 million tons since March 14.


