Market Data

April 6, 2020
Employment by Industry in April
Written by Peter Wright
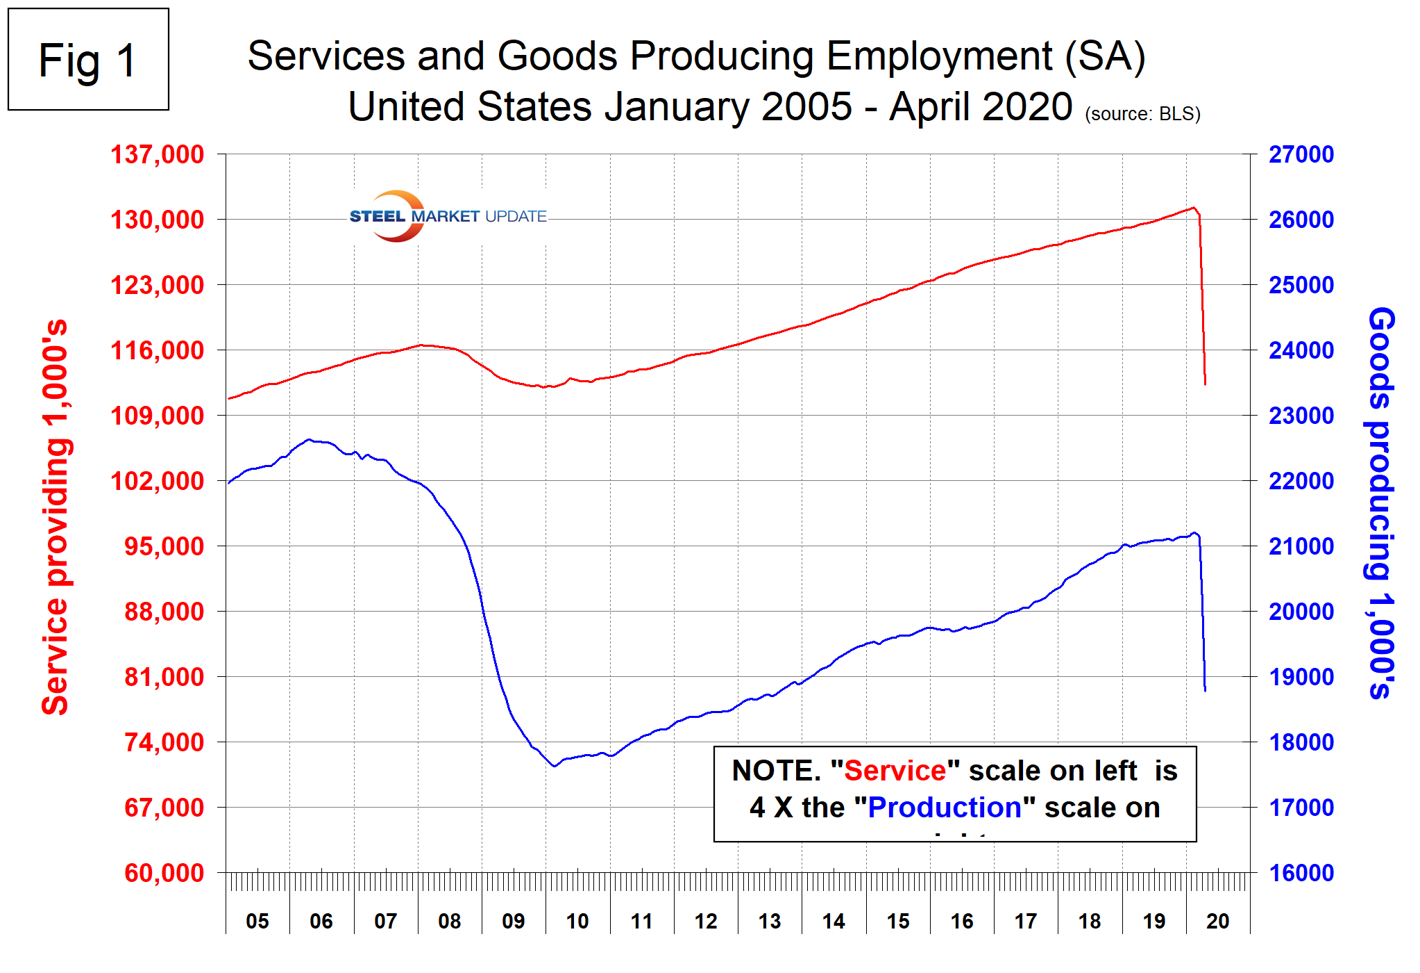
More than 20.5 million Americans lost their jobs in April, including 18.1 million in service industries and 2.4 million in goods-producing industries such as manufacturing and construction, according to data just released by the Bureau of Labor Statistics. The latest job losses came on top of 870,000 lost in March, following a gain of 230,000 in nonfarm employment in February before the government shut down nonessential businesses to stop the spread of COVID-19.
Obviously, employment in service industries such as bars and restaurants was hit much harder in April than jobs in construction and manufacturing, some of which were considered essential and were less affected by the shutdowns .
Table 1 breaks total employment down into service and goods-producing industries and then into private and government employees. The components of manufacturing and construction of most relevance to the steel industry are broken out in Table 1. (Note, the sectors listed under manufacturing and construction in Table 1 don’t add up to the total because they only include those that consume the most steel.)

Comparing the change in employment from March to April in service industries versus goods-producing industries shows service jobs declined by 13.9 percent and goods-producing jobs by 11.1 percent in a single month (Figure 1).

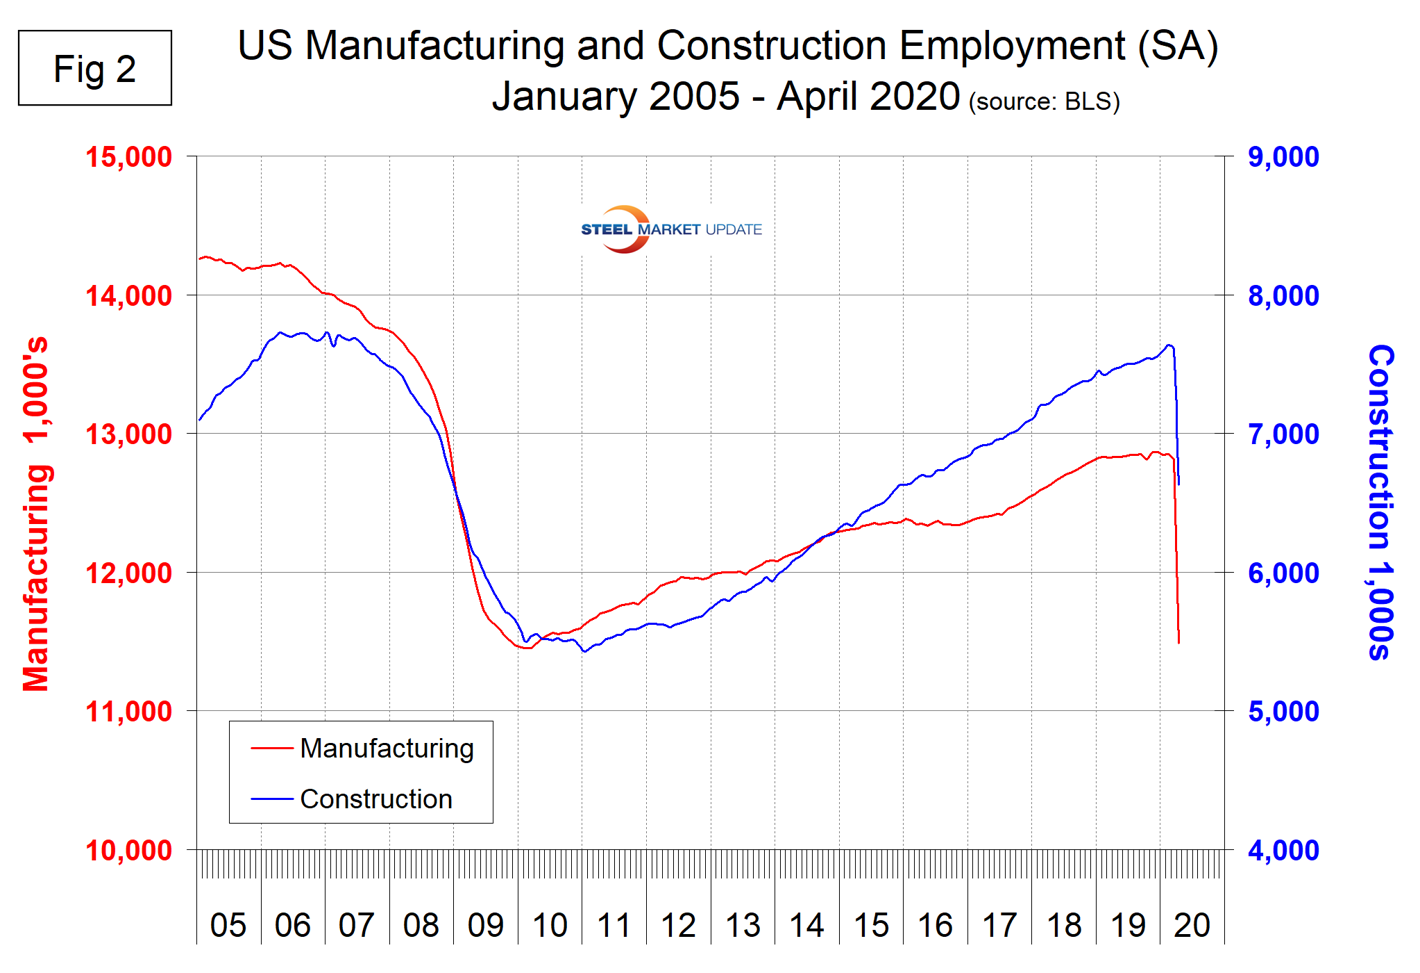
Goods-producing is comprised mainly of manufacturing and construction employment. Comparing the April job losses in manufacturing with the job losses in construction, the data shows manufacturing declined by 10.4 percent and construction by 12.8 percent. The rapid decline in construction employment is a bit surprising considering the momentum that exists in long-term projects. Figure 2 shows the level of employment in these two sectors since January 2005. On a numerical basis, manufacturing lost 1.33 million jobs and construction lost 975,000 jobs in April.

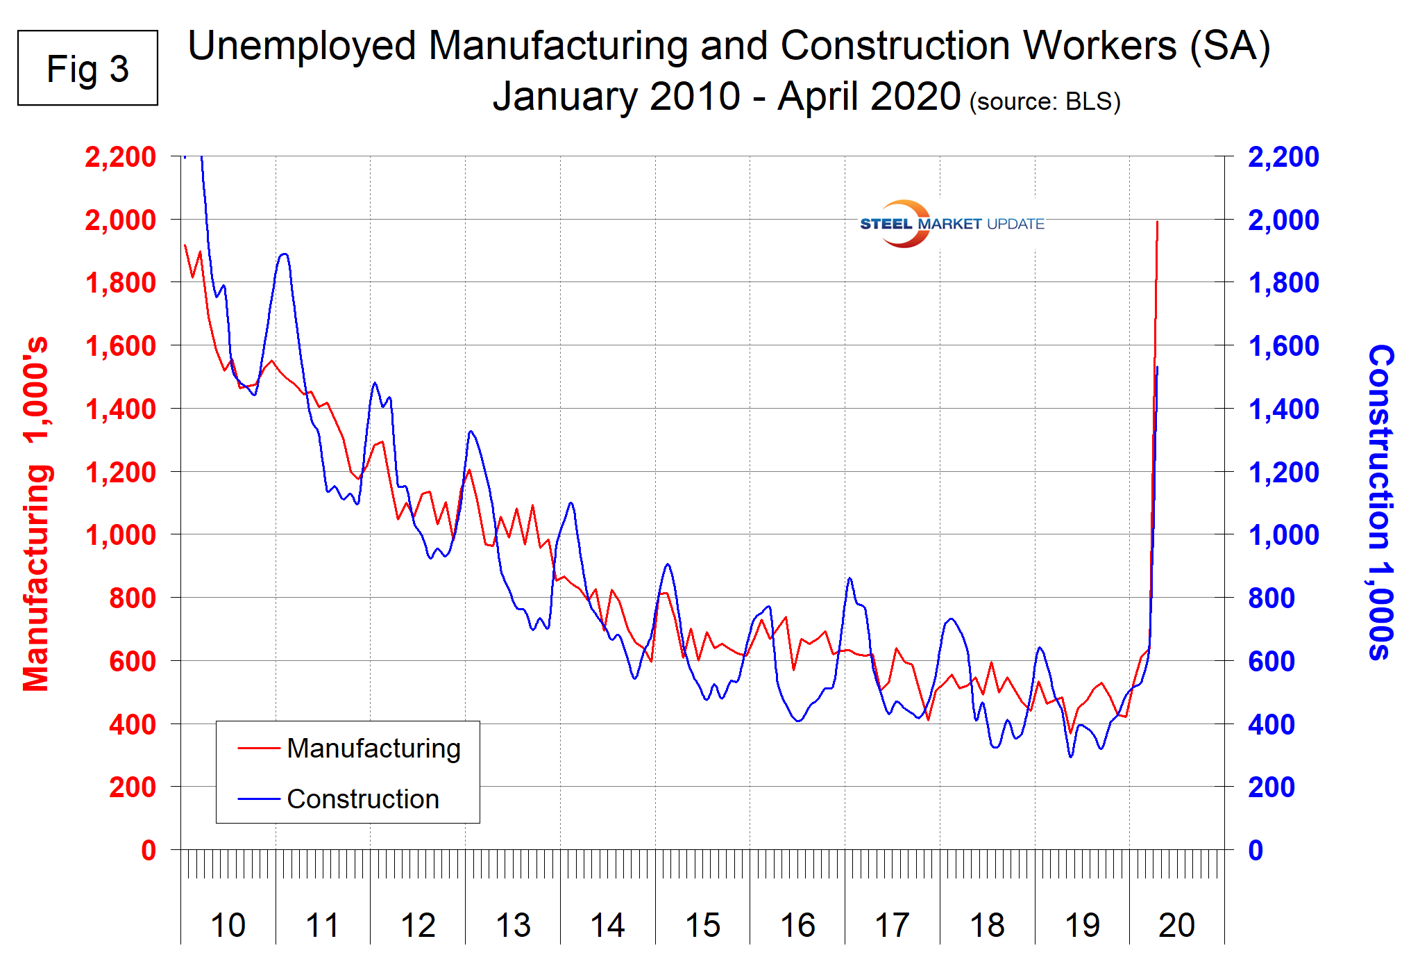
Figure 3 shows the sharp rise in the number of unemployed manufacturing workers (2.0 million) and construction workers (1.5 million).

SMU Comment: The speed and severity of the job declines have left American workers badly shaken. Even after the pandemic runs its course and hiring resumes over the coming months and years, consumer spending (and indirectly steel consumption) are likely to lag for some time until confidence returns to prior levels.
Explanation: On the first or second Friday of each month, the Bureau of Labor Statistics releases the employment data for the previous month. Data is available at www.bls.gov. The BLS employment database is a reality check for other economic data streams such as manufacturing and construction. It is easy to drill down into the BLS database to obtain employment data for many subsectors of the economy.


