

Market Data

December 9, 2019
Employment by Industry Through November 2019
Written by Peter Wright
Manufacturing gained 54,000 jobs in November, more than offsetting the effects of the GM strike. Construction added 1,000 jobs last month, as well.
The private sector gained 254,000 jobs in November as government gained 12,000 positions. Table 1 breaks total employment down into service and goods-producing industries and then into private and government employees. Most of the goods-producing employees work in manufacturing and construction and the components of these two sectors of most relevance to steel people are broken out in Table 1.

In November, the number employed by the federal government declined by 1,000. State government employment broke even and the local level increased by 13,000. Since February 2010, the low point of total nonfarm payrolls, private employers have added 22,369,000 jobs as government has gained 168,000 (Figure 1).

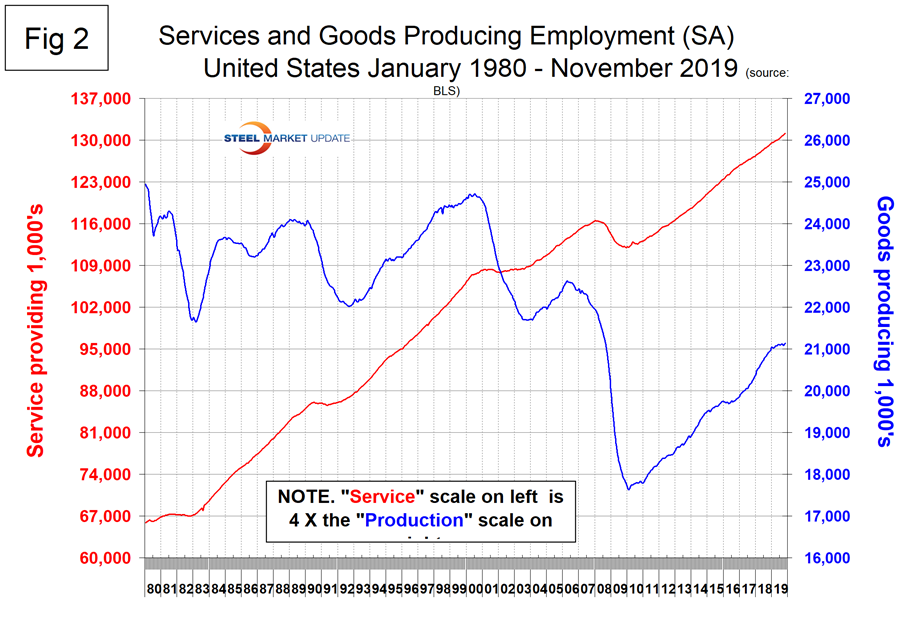
In November, service industries expanded by 218,000 as goods-producing industries, driven mainly by construction and manufacturing, gained 48,000 jobs (Figure 2). The GM strike reportedly resulted in a decline of 42,000 people employed, but these jobs were recovered in November.
Since February 2010, service industries have added 19,026,000 and goods-producing 3,511,000 positions. This has been a drag on wage growth since the recession as service industries on average pay less than goods-producing industries such as manufacturing. In the last 12 months the rate of job creation in service industries has been 50 percent higher than in goods-producing industries.
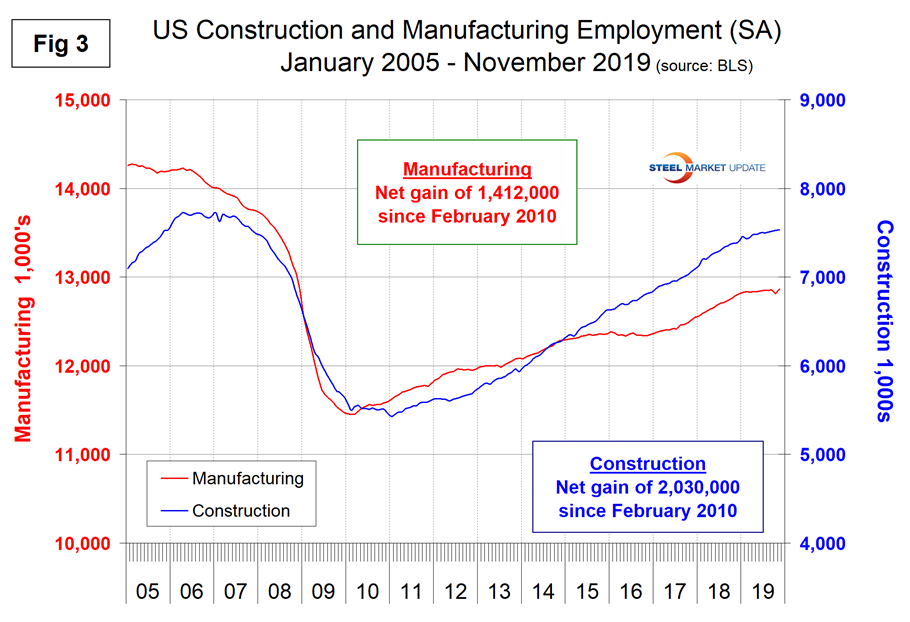
Construction was reported to have gained only 1,000 jobs in November. Since and including January 2018, construction has added 437,000 jobs and manufacturing 320,000. The BLS JOLTS report (Job Openings and Labor Turnover Survey) is reported two months in arrears and stated that there were 338,000 job openings in construction at the end of September, not seasonally adjusted, which was the highest total for September since the series began in December 2000. This underscores the challenge that contractors face in finding and retaining acceptable workers to hire. Construction openings have set series records for 16 consecutive months through September. Manufacturing productivity declined by 0.1 percent year over year in Q3 2019; the gain in Q2 was zero and was 1.0 percent in Q1 2019. Figure 3 shows the history of construction and manufacturing employment since November 2005. Construction has added 2,030,000 jobs and manufacturing 1,412,000 since the recessionary employment low point in February 2010.
Note, the subcomponents of both manufacturing and construction shown in Table 1 don’t add up to the total because we have only included those with the most relevance to the steel industry.
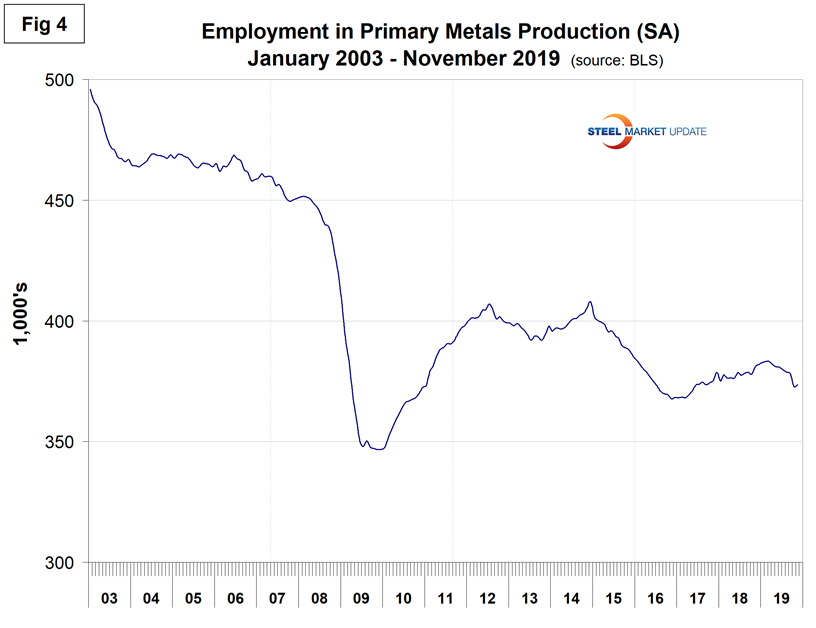
Table 1 shows that primary metals gained 700 jobs in November, which was the first positive month since February this year. Figure 4 shows the history of primary metals employment since January 2003. The primary metals industries have lost 8,500 jobs this year.
Motor vehicles and parts industries were reported to have gained 41,300 jobs in November, which made up for the strike-driven loss of 42,800 in October. Figure 5 shows the history of motor vehicles and parts job creation.

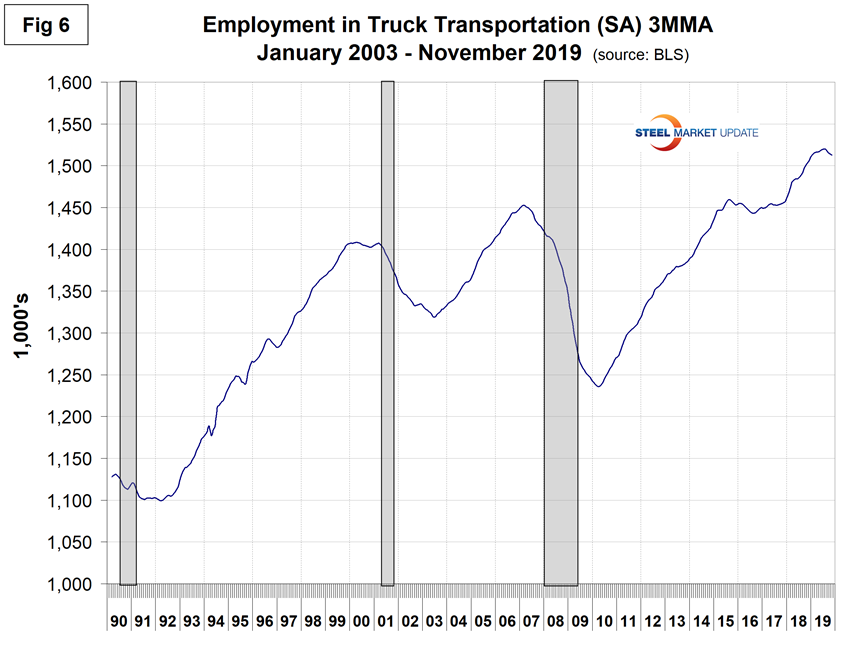
Trucking lost 1,000 jobs in November following a loss of 7,600 in the previous four months. Employment in truck driving is one of SMU’s recession monitors and Figure 6 shows that at this time there is not an indicative decline.
SMU Comment: It’s not clear whether the slowdown in the growth of construction employment is due to a lack of qualified workers or to a slowdown in overall construction expenditures. Probably both to some degree. Manufacturing employment in November recovered from the GM strike and then some. Primary metals industries have lost jobs in seven of the last eight months.
Explanation: On the first or second Friday of each month, the Bureau of Labor Statistics releases the employment data for the previous month. Data is available at www.bls.gov. The BLS employment database is a reality check for other economic data streams such as manufacturing and construction. It is easy to drill down into the BLS database to obtain employment data for many subsectors of the economy. The important point about all these data streams is the direction in which they are headed.


