

Market Data

October 10, 2019
Employment by Industry Through September 2019
Written by Peter Wright
Job creation in September continued at a lackluster pace and the details signal a slowdown in steel consumption.
In September, 7,000 jobs were created in construction, while manufacturing industries lost 2,000 jobs. About 114,000 jobs were created in the private sector, while government gained 22,000 positions.
Table 1 breaks total employment down into service and goods-producing industries and then into private and government employees. Most of the goods-producing employees work in manufacturing and construction, and the components of these two sectors of most relevance to steel people are broken out in Table 1.
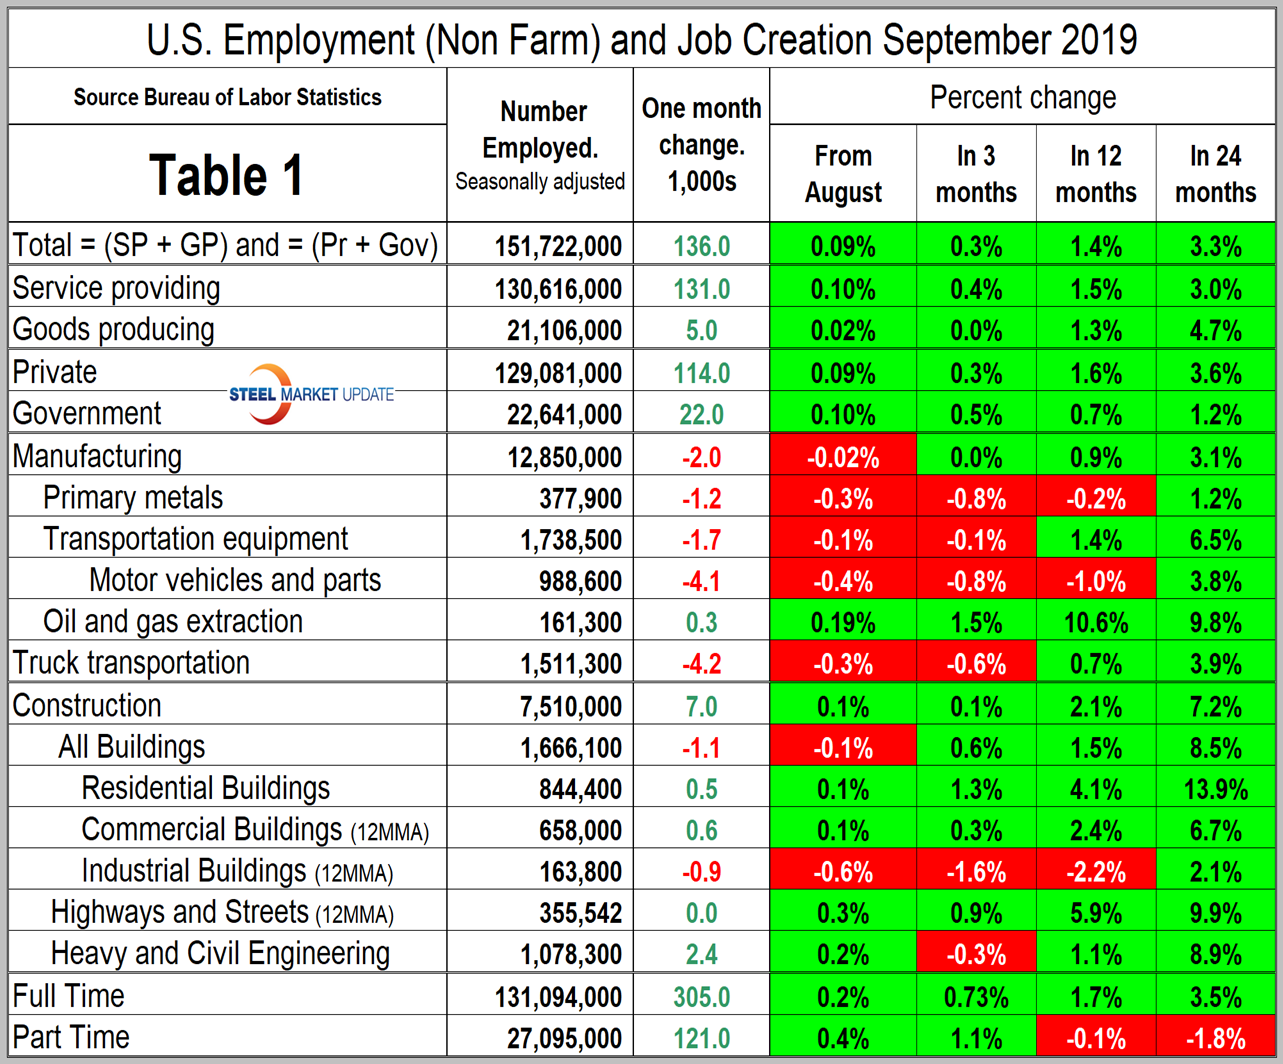
In September, the number employed by the federal government declined by 2,000. State government employment increased by 10,000 and the local level increased by 14,000. Since February 2010, the low point of total nonfarm payrolls, private employers have added 21,842,000 jobs as government has gained 165,000 (Figure 1).
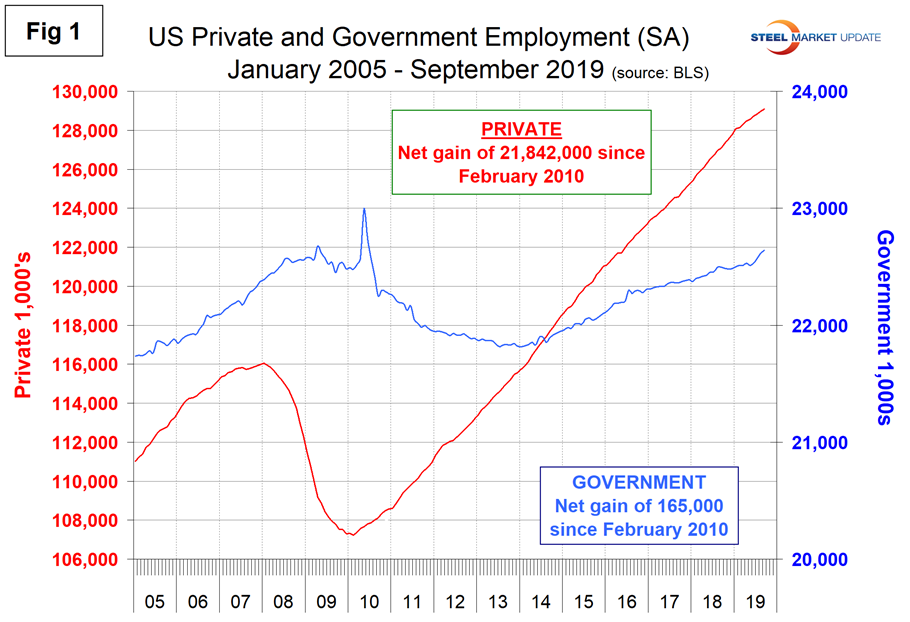
In September, service industries expanded by 131,000 as goods-producing industries, driven mainly by construction and manufacturing, gained 5,000 jobs (Figure 2). Since February 2010, service industries have added 18,528,000 and goods-producing 3,479,000 positions. This has been a drag on wage growth since the recession as service industries on average pay less than goods-producing industries such as manufacturing. In the last 24 months, the rate of job creation in goods-producing industries on a percentage basis has been higher than in service industries, but that trend reversed in more recent time periods.
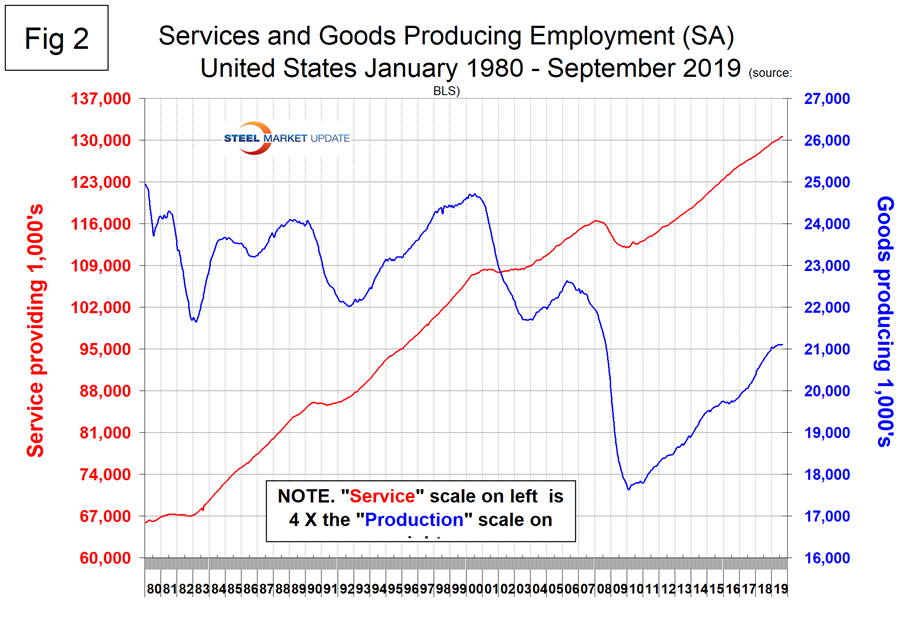
Construction was reported to have gained 7,000 jobs in September as manufacturing lost 2,000. Since and including January 2018, construction has added 417,000 and manufacturing 305,000 jobs. Manufacturing productivity improved by 0.2 percent in Q2 2019 after a gain of 0.9 percent in Q1 2019. Figure 3 shows the history of construction and manufacturing employment since September 2005. Construction has added 2,010,000 jobs and manufacturing 1,397,000 since the recessionary employment low point in February 2010. The number of unemployed jobseekers with construction experience reached a record low for September, according to an analysis of government data by the Associated General Contractors of America. Association officials said the modest increase in employment likely reflects tight labor conditions and urged federal officials to increase funding for career and technical education and pass immigration reform.
Note, the subcomponents of both manufacturing and construction shown in Table 1 don’t add up to the total because we have only included those with the most relevance to the steel industry.
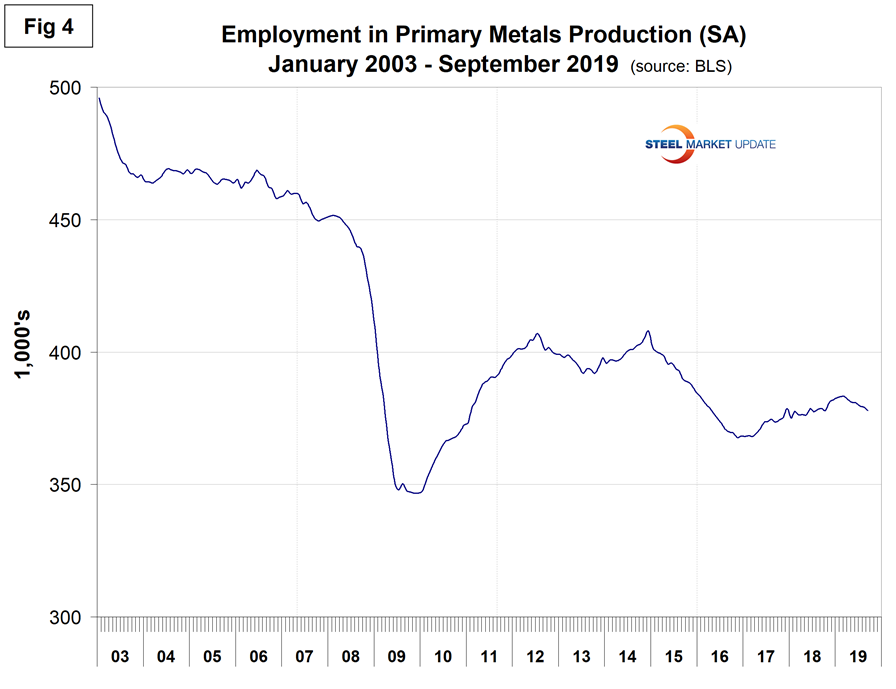
Table 1 shows that primary metals lost 1,200 jobs in September and in the last 12 and 24 months has performed worse than manufacturing as a whole. Figure 4 shows the history of primary metals employment since January 2003. There has been a decline of 5,300 in the last six months.
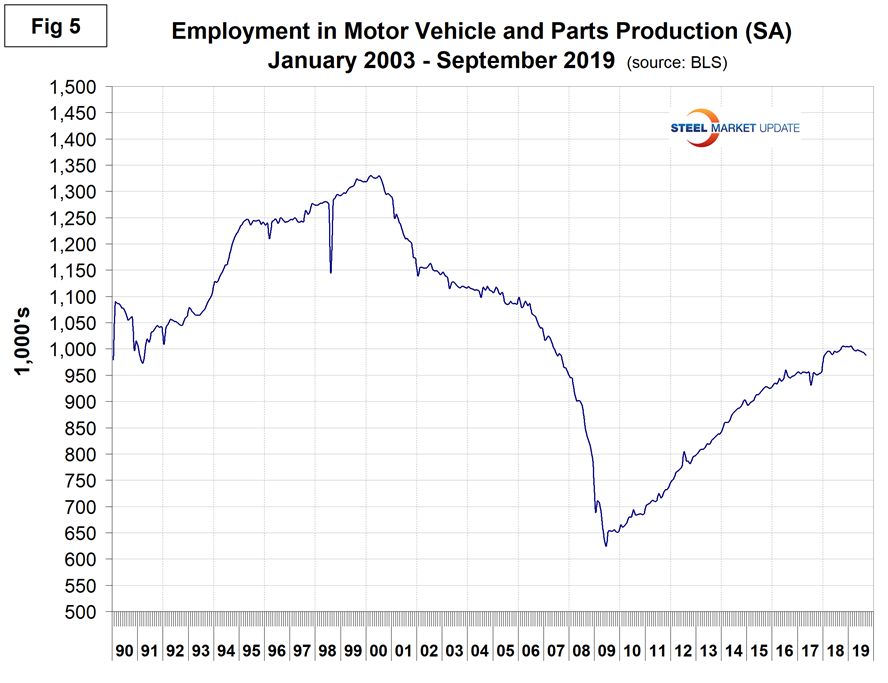
Motor vehicles and parts industries were reported to have lost 4,100 jobs in September. Figure 5 shows the history of motor vehicles and parts job creation. The magnitude of the effect of the GM strike is not known at this time.
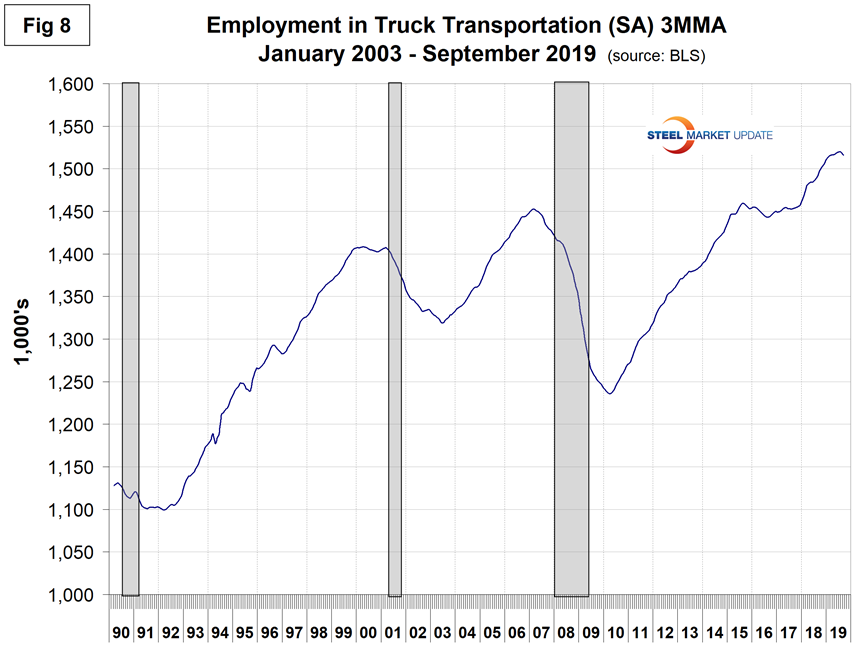
Trucking lost 4,200 jobs in September following a loss of 5,100 in August. Employment in truck driving is one of SMU’s recession monitors and Figure 8 suggests that the economy is strong, but a couple more months of losses similar to August and September would be a cause for concern.
SMU Comment: The rate of job creation is slowing, and manufacturing lost 2,000 jobs in September. Primary metals industries have lost jobs in each of the last six months. This is not a panic moment, but it is clear that this important economic indicator is signaling a slowdown in steel consumption.
Explanation: On the first or second Friday of each month, the Bureau of Labor Statistics releases the employment data for the previous month. Data is available at www.bls.gov. The BLS employment database is a reality check for other economic data streams such as manufacturing and construction. It is easy to drill down into the BLS database to obtain employment data for many subsectors of the economy. The important point about all these data streams is the direction in which they are headed.


