Prices

September 3, 2019
CRU: Lower Byproduct Credits Hit Zinc Miners’ Margins
Written by Tim Triplett
By CRU Senior Analyst Paul Wiggers de Vries
Lessons learned from the mining boom saw zinc miners cut back site costs over 2015, 2016 and 2017 in the face of lower zinc prices. However, in 2018, cost controls were relaxed and cost inflation returned. In 2019, cost inflation will remain, but miners will reduce site costs to combat higher treatment charges and lower byproduct revenues. The reduction in site costs will not offset the rise in TCs or drop in metal prices, meaning costs for the average miner are expected to rise 44 percent in 2019 to $950/t.
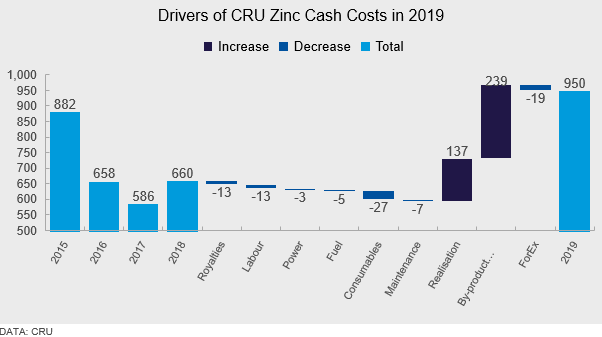
• When completing our analysis of zinc and lead mines, CRU forecast the 2019 LME 3M zinc price to average $2,569/t, a decline of 12 percent y/y. Thus, with royalties inherently tied to revenues, CRU has forecast royalties to drop 9.2 percent in 2019 to $125/t.
• Labor costs will come down $13/t on a global average in 2019. The 2.4 percent drop is the result of ongoing mechanization of operations, the rise in production from lower labor cost areas (South Africa), and the increase in production from productive areas (Australia).
• Similarly, power prices in Australia coupled with the rise in production has seen global average power costs retract 1.8 percent to $153/t. CRU has forecast the Australian base case power price to average U.S.$101 /MWh in 2019, 14 percent lower y/y. The decline in Australian power costs is coming on the back of lower natural gas prices and coal prices and the change in the U.S./AUD exchange rate.
• Crude oil prices are forecast to fall in 2019. This reduction is expected to reduce site fuel costs for zinc by 5.7 percent to $77/t. Consumables, the most expensive site cost, will also fall 3.3 percent to $794/t in 2019 due to a rise in productivity at major operations and a drop in consumable costs such as steel grinding media/balls.
• With producer margins being squeezed, maintenance is expected to be deferred in 2019 where possible. CRU has forecast maintenance costs to fall 6.4 percent to $108/t.
• All the cost reductions made to site cost drivers are outweighed by the rise in realization costs. Realization costs are expected to rise 11 percent to 1,386/t. The key driver behind the rise is the increase in the zinc treatment charge (TC) benchmark. The 2019 zinc TC was set at $245/t, 67 percent higher than 2018. Lead treatment charges have also been set higher, albeit not as drastically, at $105/t, +6 percent y/y. The increases in TCs are expected to be slightly offset by a fall in sea freight costs.
• The biggest y/y change for zinc cash costs is byproduct credits. The decline in metal prices over 2019 is expected to reduce byproduct credits for zinc miners by 10 percent to $1,386/t. At the time of analysis, CRU had forecast the LME 3M lead and copper price to fall 13.4 percent and 2.3 percent, respectively, to $1,950/t and $6,388/t. One upside to byproduct credits is the increase in gold and silver prices over the year.
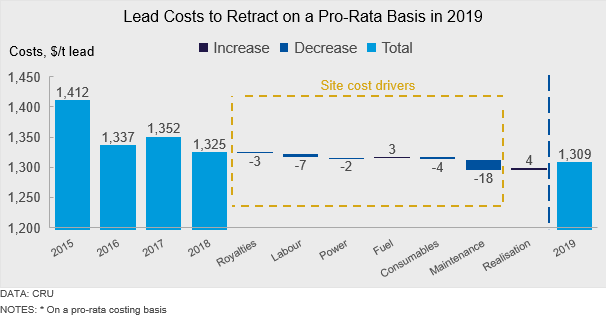
Lead costs on a pro-rata basis will retract marginally in 2019 by 1.2 percent to $1,309/t. Most changes in the site costs will net each other out. The largest change is to maintenance costs, which as previously mentioned will decline in 2019 as producers defer upkeep costs in a lower price environment.
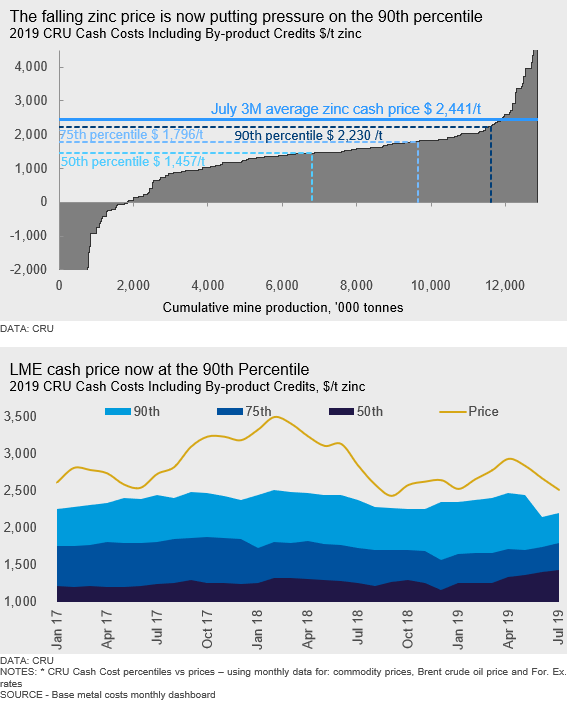
Deteriorating Zinc Price Now Pressuring the 90th Percentile
LME cash prices in 2019 have declined from over $2,940/t to now trade in the $2,200-2,300/t range. This decline in price is now putting pressure on the highest cost producers. Based on our analysis, a price of $2,200/t would mean 10.8 percent of production would be underwater, which equates to 1.38Mt of zinc. Approximately 33 percent of this production is in China. Major operations outside of China that would be losing money at this price include Trafigura’s Middle Tennessee, Industrias Peñoles Madero and Independence Group’s Jaguar.
This is a shift from 2017 and 2018 where only 4 percent and 2 percent of producers lost money at the yearly LME cash averages. Unfortunately for zinc producers, margins are not expected to improve. Based on our cost data from the 2019 Lead and Zinc Cost Model, and its associated LME 3M zinc price forecast for 2020 ($2,263/t) and 2021 ($1,950/t), we expect 10 percent and 19 percent of producers to have no margin, respectively. However, we could see a drastic shift in the curve over these years as producers choose to shutter operations rather than face losses.
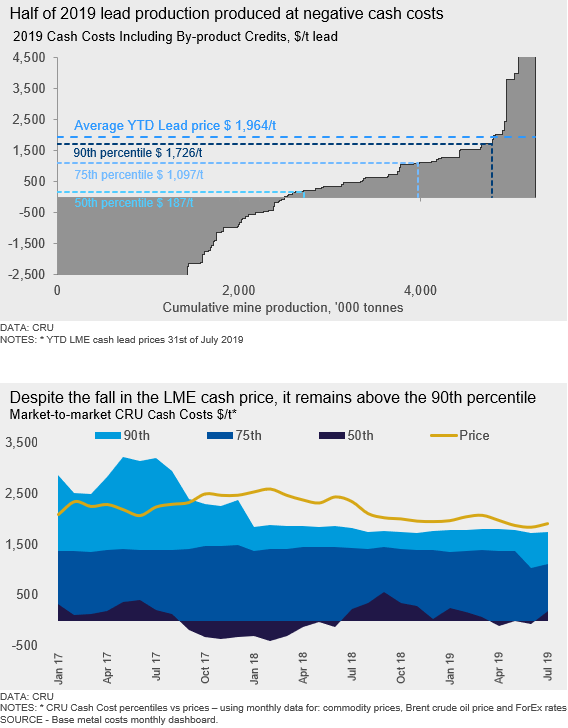
In 2019, almost half of the lead mining production (up to the 48th percentile) will be produced at negative cash costs. The average miner is estimated to capture margins of approximately $3,760/t based on an average YTD lead price of $1,964/t (end of July). However, lead is mined almost exclusively as a byproduct, meaning that the relative byproduct credits can vary significantly period-on-period purely due to the relative metal price movement. This means that CRU cash costs can fluctuate sharply on either a pro-rata or net of byproduct costing approach. For example, the average lead miner is forecast to have a pro-rata CRU cash cost of $1,309/t of lead in 2019, securing margins of $655/t. The 90th percentile producer is estimated to have a CRU cash cost of $1,786/t, capturing a margin of approximately $180 per tonne of lead produced.
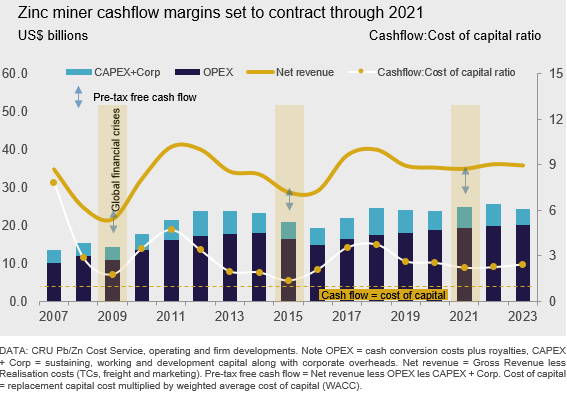
Zinc Loses its Shine
For copper miners, margins will contract this year before increasing in the 2020s. While after some difficult years for the nickel mining industry, solid demand from the traditional stainless-steel sector has kept the market in modest deficit, and with the rapid growth projections for electric vehicles (EVs), prices are finding support. Unfortunately for zinc miners, 2017 and 2018 were the best years in this part of the cycle, and we expect it will be a testing period from now through 2021, after which margins should begin to recover.
Zinc LME 3M prices peaked at above $3,500/t in 2018 Q1, but they have now fallen to just over $2,200/t. Over the same period, treatment charges (TCs) have risen from $147/t to $247/t (for benchmark ex-Chinese terms) and from sub $20/t to nearly $300/t for CIF China spot terms. Worse, as the concentrate market has continued to move into surplus, differentials have opened for sub-par concentrate qualities, placing strain on some of the newer entrants to the market.
Other metals such as lead, silver, copper and gold tend to make up nearly half of the revenue streams for zinc miners. Despite the better relative price performance of these metals when compared to zinc, reduced output of these byproduct metals relative to zinc output has led to shrinking overall byproduct credits. This, along with rising TCs, has led to marked cost inflation and margin contraction.