

Market Data

August 28, 2019
SMU Energy Analysis: Rig Count Declines
Written by Peter Wright
Oil production in the U.S. set another all-time record in May (latest data available) and the forecast for the rest of 2019 and 2020 is a continuation of this trend.
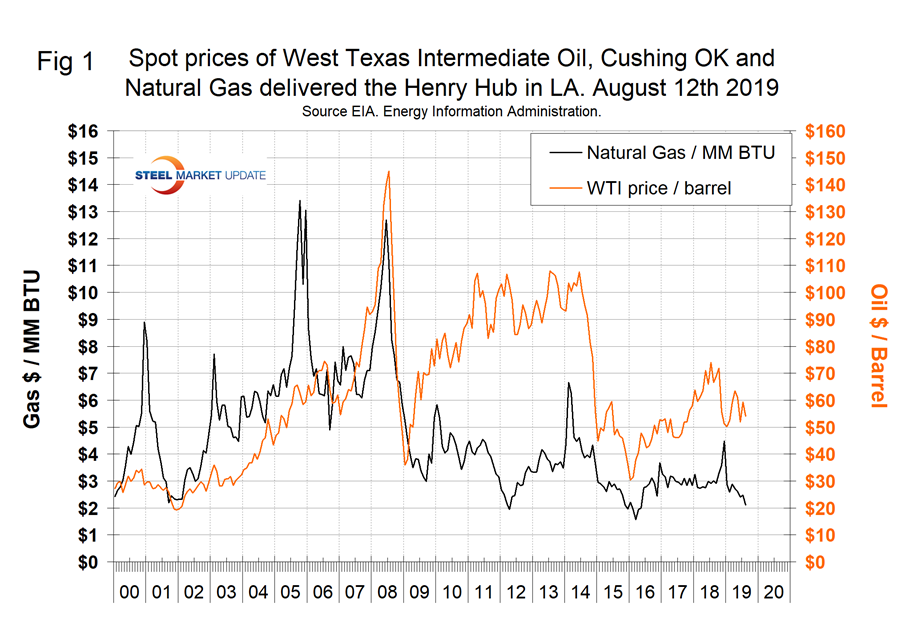
The spot price of West Texas Intermediate (WTI) FOB Cushing, Okla., exceeded $60 per barrel for one day on July 10 before falling back to $51.14 on Aug. 7 and recovering to $54.08 on Aug. 12. The total number of operating rigs exploring for oil has declined by 148 since the end of last year.
![]()
The prices of oil and natural gas drive the consumption of energy-related steel products including oil country tubular goods, pipe fittings and well head equipment, among others. Welded tubular goods (not including OCTG) consumed about 5.5 million tons of hot rolled sheet in 2018.
Figure 1 shows historical oil and gas prices from January 2000 through Aug. 12, 2019. WTI had a recent low of $51.14 on Aug. 7 when Brent was $55.03. Our price and inventory data come from the Energy Information Administration. On Aug. 9, natural gas at the Henry Hub in Oklahoma was priced at $2.11 per MMBtu (million British Thermal Units), down 36 cents on the month. Natural gas continues to make inroads against coal as an electric power generator.
The EIA short-term energy forecast of Aug. 6 stated that Brent crude oil spot prices averaged $64 per barrel (b) in July, almost unchanged from the average in June, but $10/b lower than the price in July of last year. EIA forecasts Brent spot prices will average $64/b in the second half of 2019 and $65/b in 2020. The forecast of stable crude oil prices is the result of EIA’s expectations of a relatively balanced global oil market. EIA forecasts global oil inventories will increase by 0.1 million barrels per day (b/d) in 2019 and 0.3 million b/d in 2020. EIA expects West Texas Intermediate (WTI) crude oil prices will average $5.50/b less than Brent prices during the fourth quarter of 2019 and in 2020, narrowing from the $6.60/b spread during July. The narrowing spread reflects EIA’s assumption that crude oil pipeline transportation constraints from the Permian Basin to refineries and export terminals on the U.S. Gulf Coast will ease in the coming months.
On Aug. 9, the EIA reported that U.S. commercial crude oil inventories (excluding those in the Strategic Petroleum Reserve) increased slightly in the previous two weeks after falling for eight straight weeks. Figure 2 shows the inventory level, including the strategic petroleum reserve and the year-over-year change.
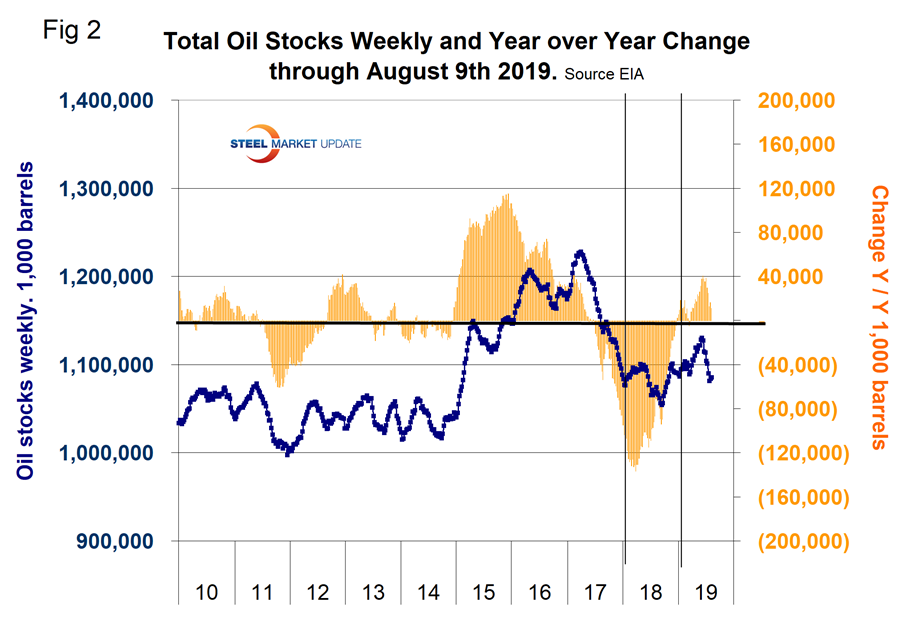
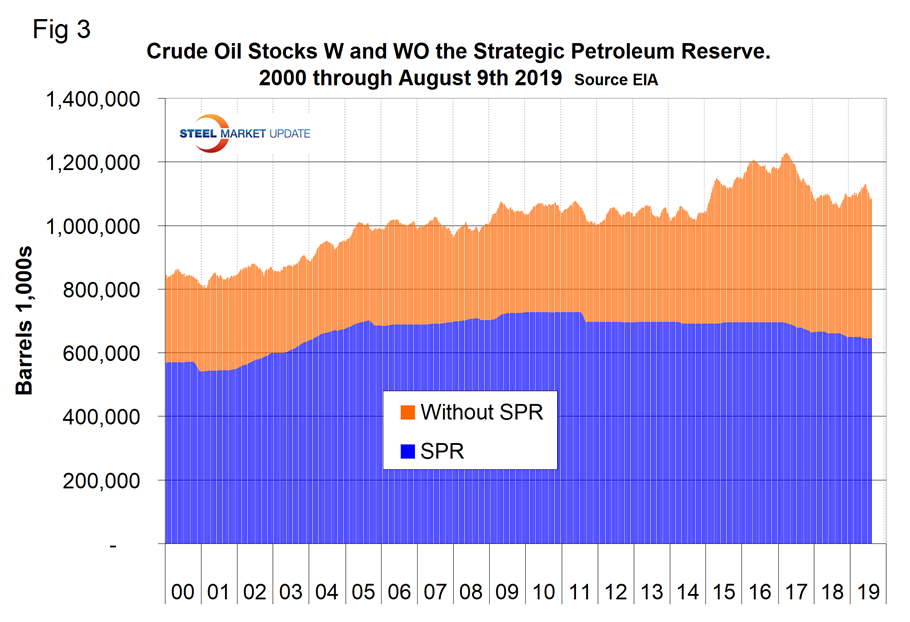
Figure 3 breaks total crude inventory into the working portion and the strategic petroleum reserve.
The total number of operating rigs in the U.S. on Aug. 16 was 935, down by 148 since the end of last year. Oil rigs were down by 115 and gas by 33. Figure 4 shows the total number of operating rigs in the U.S. and the weekly change.
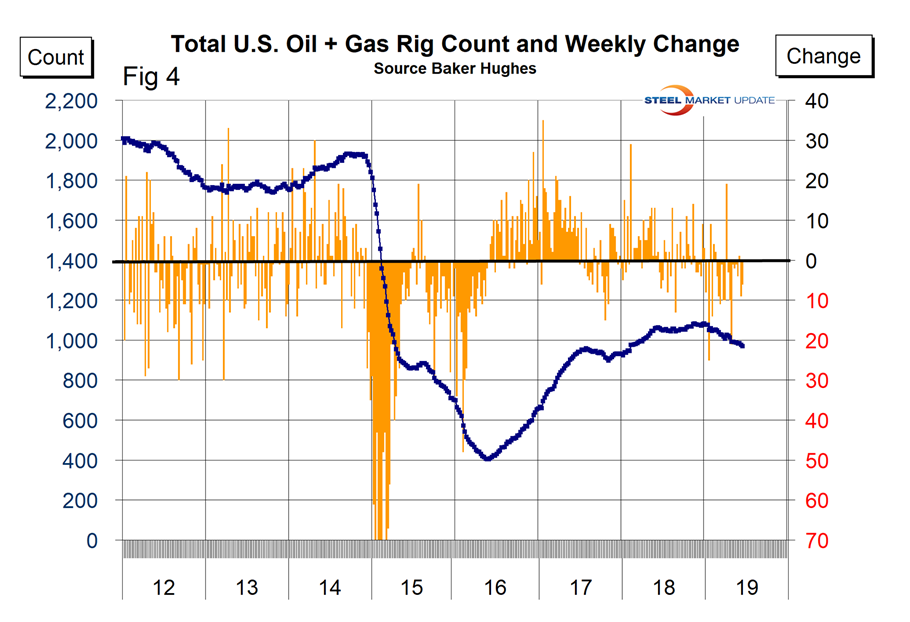
The oil rig count had a low point of 316 on June 27, 2016, and stood at 770 on Aug. 16, 2019.
The U.S. gas rig count rose from its low point of 81 on Aug. 5, 2016, to 202 on Jan. 11, 2019, before falling back to 165 on Aug. 16, 2019. The year-over-year growth rate of total U.S. operating rigs was negative 11.5 percent in the latest data with oil down by 11.6 percent and gas down by 11.3 percent. Figure 5 shows the Baker Hughes U.S. Rotary Rig Counts for oil and gas equipment in the U.S. (explanation below).

On a regional basis in the U.S., the big three states for operating rigs are Texas, Oklahoma and North Dakota. Figure 6 shows the land rig count in those states since 2000.
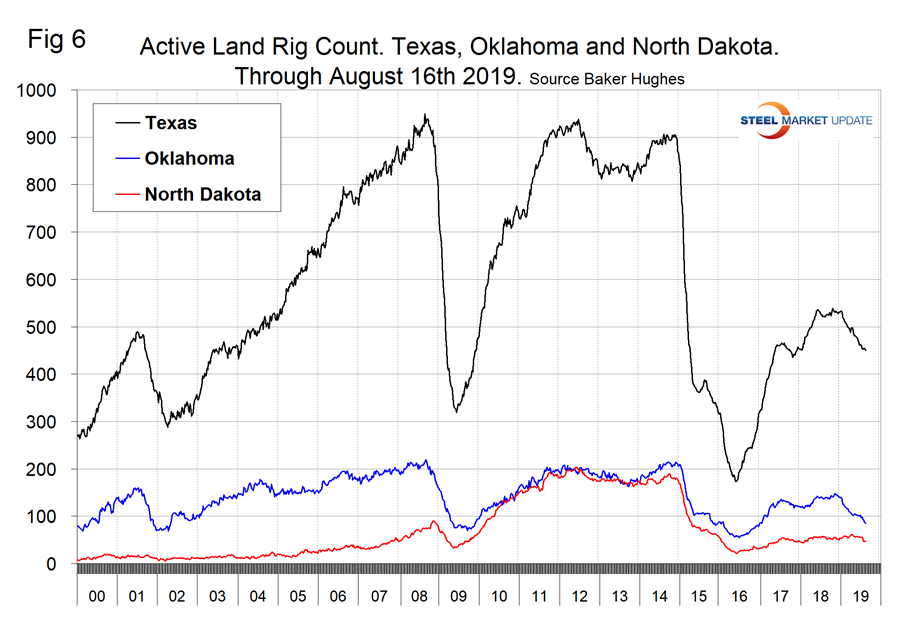
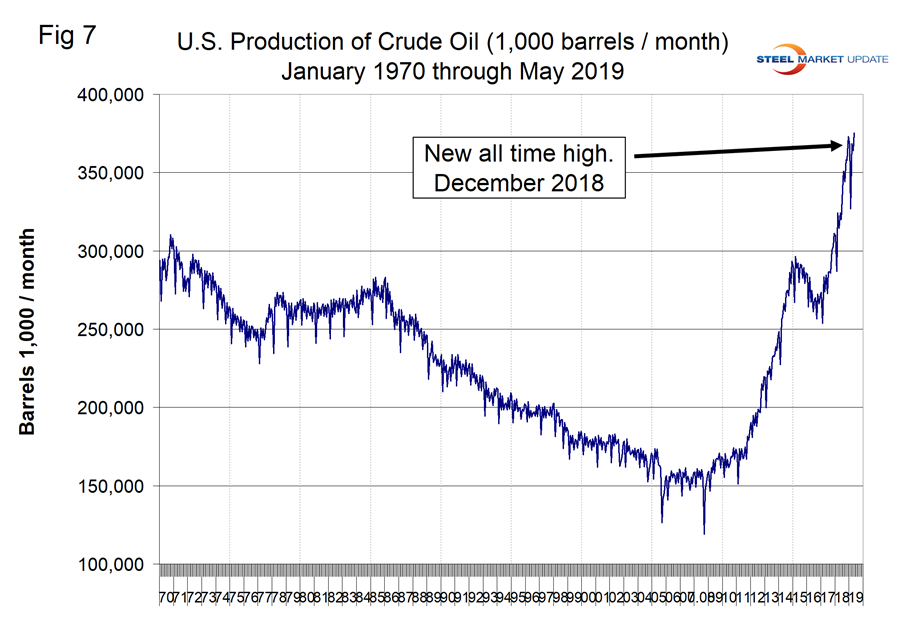
Figure 7 illustrates the monthly U.S. oilfield production of crude from January 1970 through May 2019 (latest data available) in thousands of barrels per month. The historical high was October 1970 at 310.4 million barrels. Production steadily declined to half that level in the late 2000s before the fracking revolution. December 2017 broke the record that had stood for 47 years with 311.2 million barrels produced, and the latest data for May 2019 indicated another record of 375.4 million barrels.
EIA estimates that U.S. crude oil production averaged 11.7 million b/d in July, down by 0.3 million b/d from the June level. The declines were mostly in the Federal Gulf of Mexico (GOM), where operators shut platforms for several days in mid-July because of Hurricane Barry. Those declines were partially offset by the Lower 48 States onshore region, which is mostly tight oil production, where supply rose by more than 0.1 million b/d. EIA expects monthly growth in Lower 48 onshore production to slow during the rest of the forecast period, averaging 50,000 b/d per month from the fourth quarter of 2019 through the end of 2020, down from an average of 110,000 b/d per month from August 2018 through July 2019. EIA forecasts U.S. crude oil production will average 12.3 million b/d in 2019 and 13.3 million b/d in 2020, both of which would be record levels.
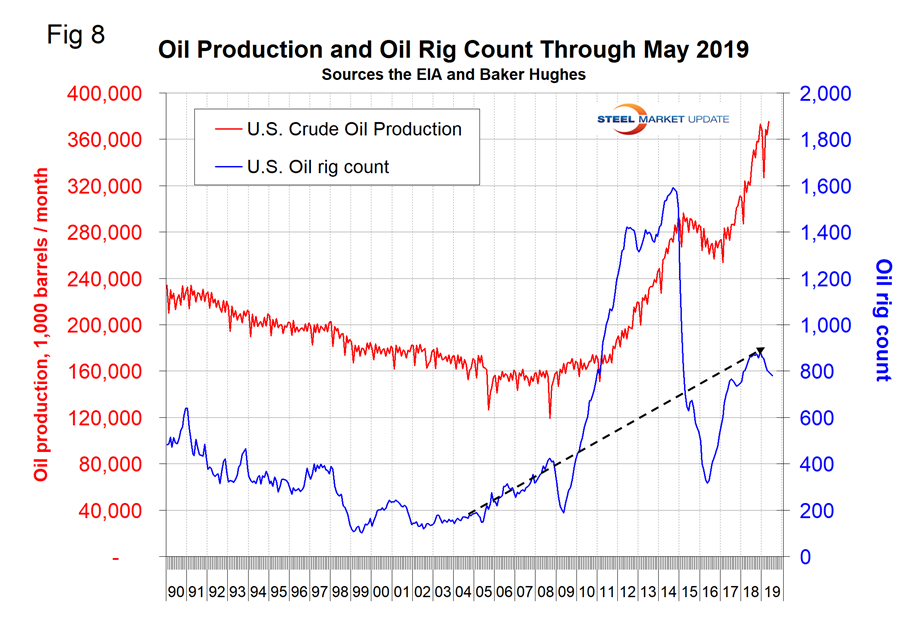
Figure 8 compares oil production and the oil rig count and shows how the increase in exploratory wells drove production from 2009 through late 2014 when the oil price collapsed.
Baker Hughes Rotary Rig Count: This is a weekly census of the number of drilling rigs actively exploring for or developing oil or natural gas in the United States. Rigs are considered active from the time they break ground until the time they reach their target depth and may be establishing a new well or sidetracking an existing one. The Baker Hughes Rotary Rig count includes only those rigs that are significant consumers of oilfield services and supplies.