Market Data

August 20, 2019
China’s Economy "Faces External Headwinds"
Written by Peter Wright
The official economic statistics out of China showed a decline in industrial production in July. But in June, China’s share of global steel production was 55.1 percent.
Once each quarter we publish the official statistics for Chinese GDP, industrial production, consumer price inflation and fixed asset investment. We don’t know the accuracy of these numbers, but we include them in our reports because of the importance of China in the global steel scene.
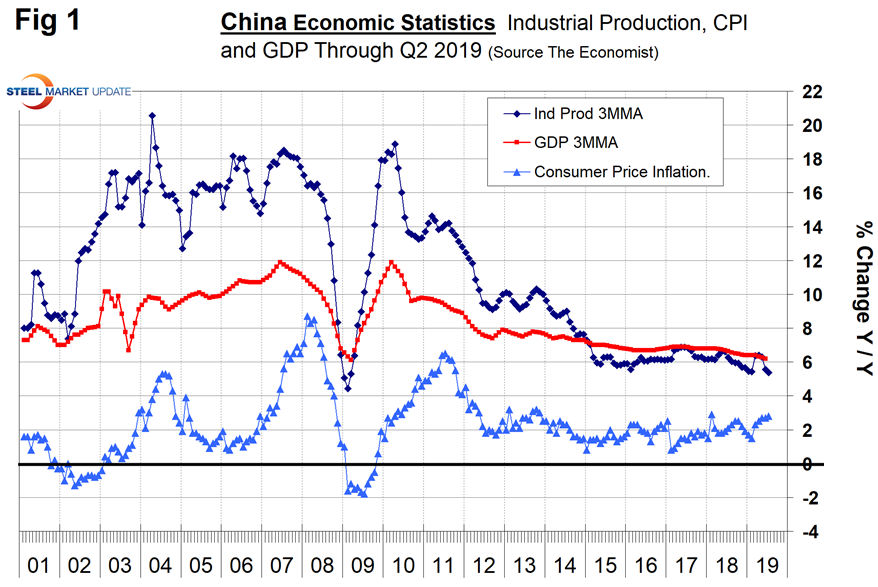
China’s economic statistics are never revised, which makes analysts suspicious considering the U.S. routinely makes revisions back decades. Figure 1 shows published data for the second quarter of 2019. The GDP and industrial production portions of this graph are three-month moving averages. China’s GDP grew at a rate of 6.2 percent in the second quarter of 2019, down from 6.8 percent in the first quarter of 2018. Growth has gradually slowed from 9.7 percent in the first quarter of 2011.

On Aug.9, the IMF published its Article IV Consultation with the People’s Republic of China, summarized as follows: “The Chinese economy is facing external headwinds and an uncertain environment. GDP growth slowed to 6.6 percent in 2018, driven by necessary financial regulatory reforms and softening external demand. Growth is projected to moderate to 6.2 percent in 2019 as the planned policy stimulus partially offsets the negative impact from the U.S. tariff hike on U.S.$200 billion of Chinese exports. Headline inflation rose due to rising food prices and is expected to remain around 2½ percent. Reforms progressed in several key areas. The strengthening of financial regulations and control over off-budget local government investment has reduced the pace of debt accumulation, helping contain the build-up of risks in the financial sector. Opening up continued, with decreases in tariffs, passage of a new foreign investment law, and revisions to the negative list for foreign investment entry. Progress on SOE reforms, however, was mixed. Credit growth slowed through 2018, but began to pick up in 2019. While the corporate deleveraging partially offset government and household debt accumulation, total nonfinancial sector debt still rose faster than nominal GDP growth. The deficit of the general government sector (including estimated off-budget investment spending) was estimated to be around 11 percent of GDP in 2018. The current account surplus fell by around 1 percentage point, to 0.4 percent of GDP in 2018 and it is projected to remain contained at 0.5 percent of GDP in 2019. The external position in 2018 was assessed to be broadly in line with the level consistent with medium-term fundamentals and desirable policies. Net capital outflows declined sharply from around $650 billion in 2015 and 2016 to $30 billion in 2018.”
On May 22, the Independent Trader, an equity analyst, wrote: “Chinese policy after the financial crisis of 2008 led to a return of the economic growth. However, with the passage of time, increasing debt became a significant problem for the second largest economy in the world. Weakness is already affecting related countries. This can be seen in the number of companies that in 2018 announced earnings worse than expected, as well as anticipated changes in 2019 profitability. To better understand how problems within China have developed let’s go back in time a few years. In the aftermath of the financial crisis in 2008, economic growth sharply decreased. As a result, the Communist Party decided to massively pump investments using debt. Party leaders assumed that economic growth should remain at a minimum level of 8% per annum. GDP growth in China managed to stay above 8% only until 2012. We can observe the decreasing economic growth rate in China for a long time now, which is currently only 6.2% (the same as it was at the bottom of financial crisis 10 years ago). It should be emphasized that all data releases in China are only for a point of reference (even Chinese officials admit it), and in reality economic growth is much lower. Nevertheless, as a result of the policy applied by the Communist Party after the crisis, China has experienced several years of economic recovery, which resulted in a gigantic increase in debt. Total debt to GDP is currently around 270%. This means that debt since the crisis has almost doubled!”
The growth of China’s industrial production increased from 5.0 percent in May, which was the slowest since February 2009, to 6.3 percent in June, but fell back to 4.8 percent in July with a three-month moving average (3MMA) of 5.37 percent. On Aug. 13, Economy.com wrote: “China’s industrial production grew at its slowest rate in more than 17 years in July at 4.8% y/y, down from 6.3% in June. This is a clear sign that China’s manufacturing sector is buckling under the pressure of continued escalations in the trade war, which is creating mass uncertainty and depressing demand despite the postponement of the new 10% tariff schedule that was set for the beginning of September; this has provided only slight relief. The export-facing sectors are expected to remain under pressure with global demand cooling and without an end to the trade war in sight, increasing the urgency for Beijing to employ fiscal and monetary stimulus measures to support internal growth.
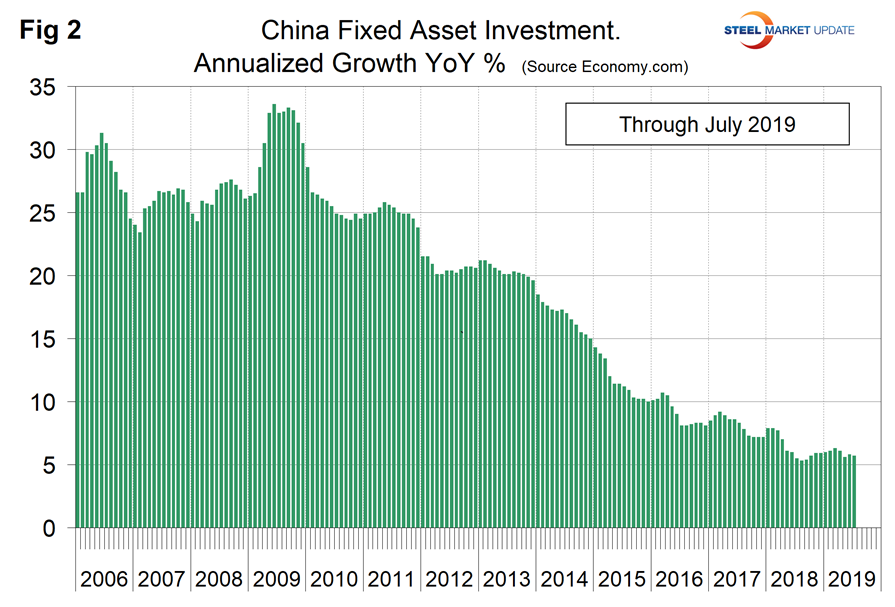
Figure 2 shows the growth of fixed asset investment year over year. In July, FAI grew at 5.7 percent, down from 7.7 percent in March. Based on the rule of 72, a 5.7 percent growth rate results in a doubling of investment in 12.6 years.

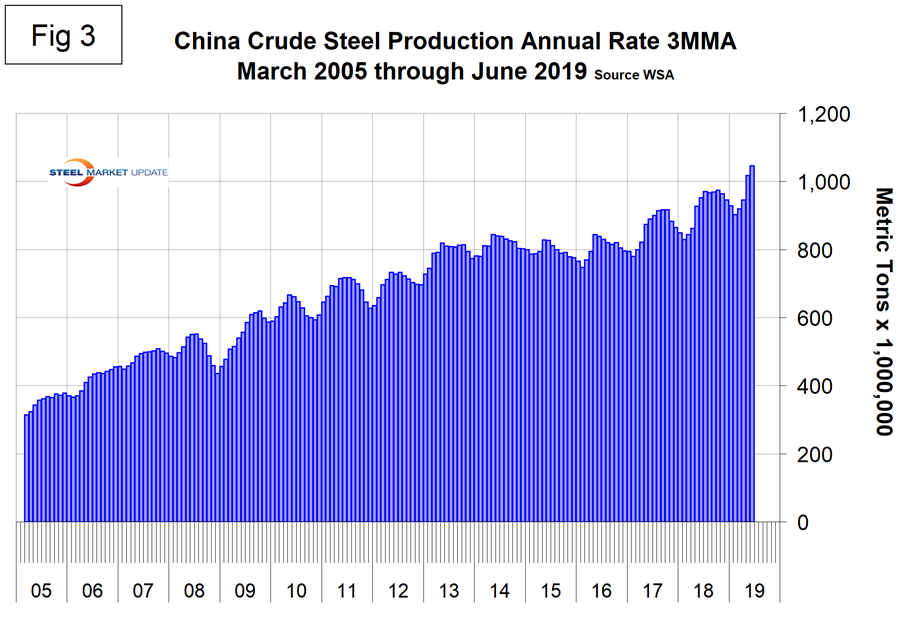
Figure 3 shows the 3MMA of China’s crude steel production through June when it accounted for 55.1 percent of global production. The WSA is forecasting a highly improbable deceleration in China’s steel production growth in 2019.

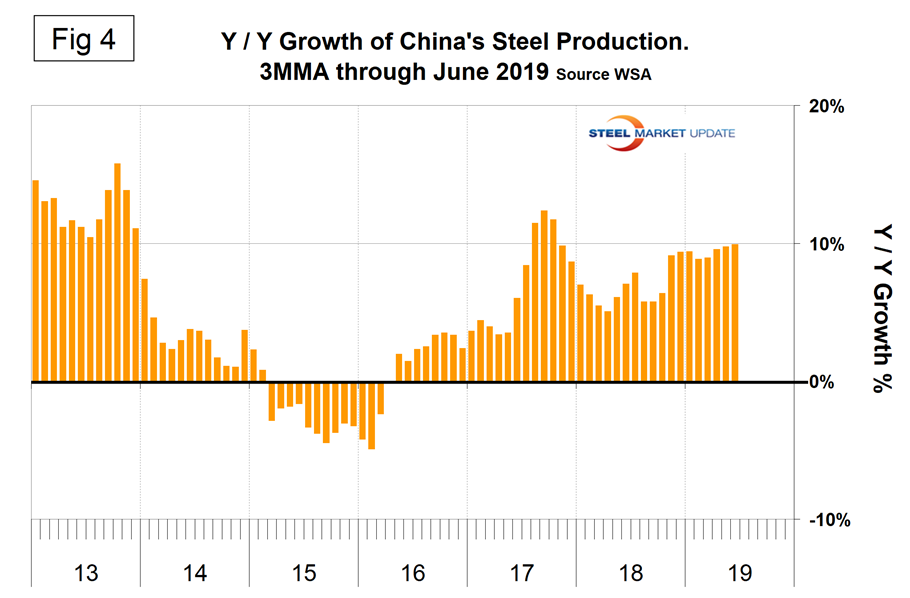
Figure 4 shows the year-over-year growth of China’s steel production. China’s production returned to positive growth each month since April 2016 and accelerated each month March through June 2019. The rest of the world had negative growth in January, February and June 2019.


