Market Data

August 2, 2019
Global Steel Production: China's Share Tops 55 Percent in June
Written by Peter Wright
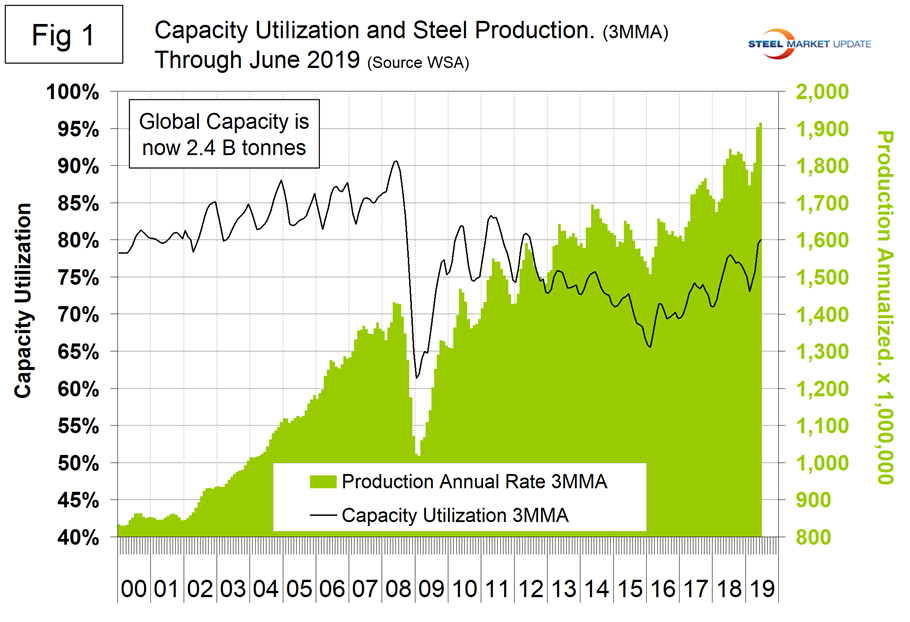
In June, China’s share of global steel production exceeded 55 percent for the first time. In May and June, the annual rate of global steel production exceeded 1.9 billion metric tons. Capacity is calculated to be 2.4 billion metric tons and capacity utilization in June was 80.0 percent, according to the latest Steel Market Update analysis of World Steel Association data. In the months of April, May and June, Chinese production exceeded an annual rate of one billion metric tons for the first time, and in June China produced an all-time high global share of 55.1 percent.
![]()
On July 23, the IMF Blog had this to say: “In our July update of the World Economic Outlook, we are revising downward our projection for global growth to 3.2 percent in 2019 and 3.5 percent in 2020. While this is a modest revision of 0.1 percentage points for both years relative to our projections in April, it comes on top of previous significant downward revisions. Global growth is sluggish and precarious, but it does not have to be this way because some of this is self-inflicted. Dynamism in the global economy is being weighed down by prolonged policy uncertainty as trade tensions remain heightened despite the recent U.S.-China trade truce, technology tensions have erupted threatening global technology supply chains, and the prospects of a no-deal Brexit have increased. The negative consequences of policy uncertainty are visible in the diverging trends between the manufacturing and services sector, and the significant weakness in global trade. Manufacturing purchasing manager indices continue to decline alongside worsening business sentiment as businesses hold off on investment in the face of high uncertainty. Global trade growth, which moves closely with investment, has slowed significantly to 0.5 percent (year-on-year) in the first quarter of 2019, which is its slowest pace since 2012. On the other hand, the services sector is holding up and consumer sentiment is strong, as unemployment rates touch record lows and wage incomes rise in several countries.”
Figure 1 shows annualized monthly production on a three-month moving average (3MMA) basis and capacity utilization since January 2000. On a tons-per-day basis, production in June was 5.299 million metric tons, another all-time high.
On average, global production in tons per day peaked in the early summer in the years 2010 through 2016, but in 2017 and 2018 the second half downtrend was delayed until the fourth quarter. Figure 2 shows the average tons per day of production for each month since 2008. On average, June increased by 0.58 percent. This year, June increased by 0.82 percent.
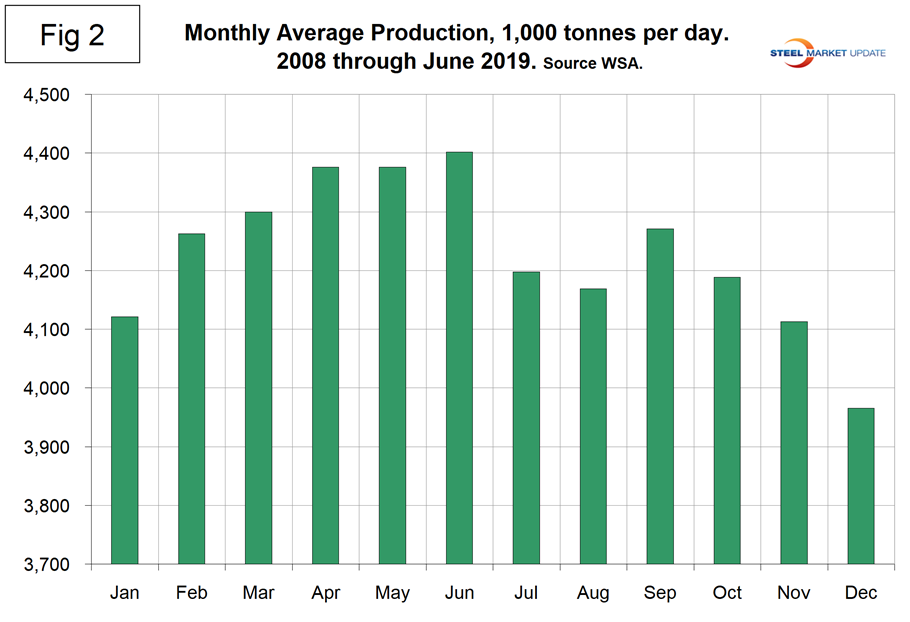
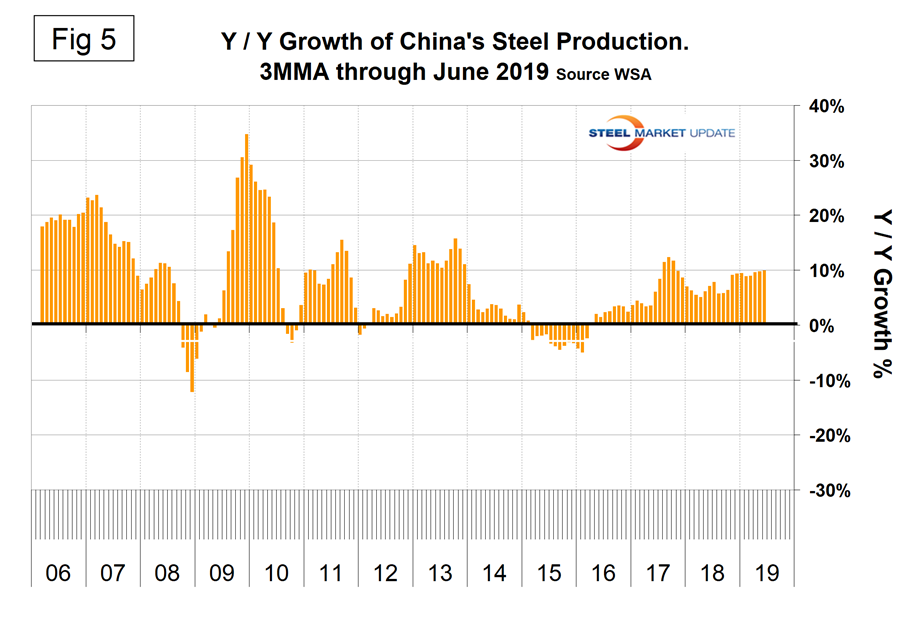
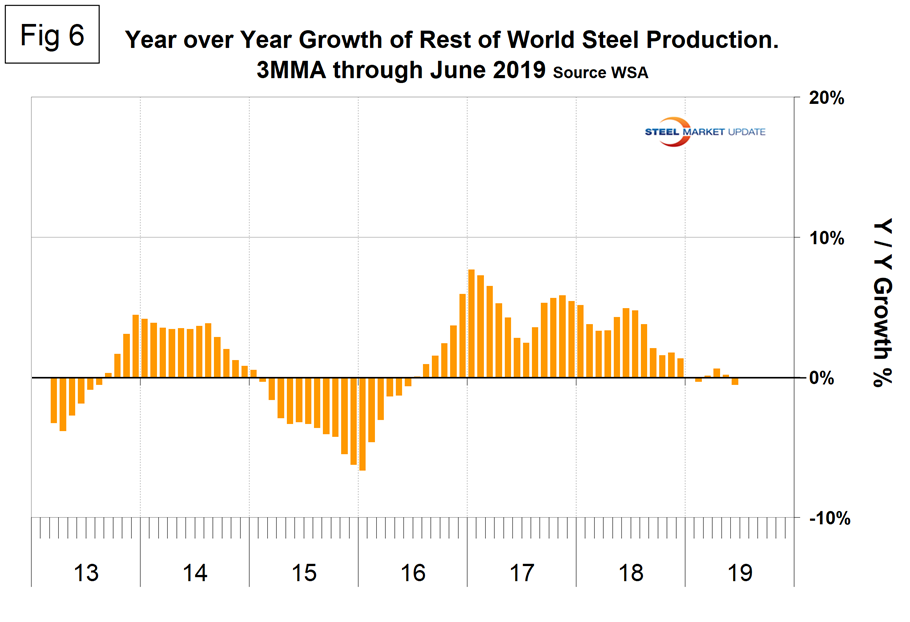
Figure 3 shows the year-over-year growth rate of global production since January 2005. Growth in three months through June was 5.4 percent, down from 5.7 percent in April and 5.6 percent in May. All of this growth occurred in China. The rest of the world growth of steel production was negative 0.5 percent in three months through June.
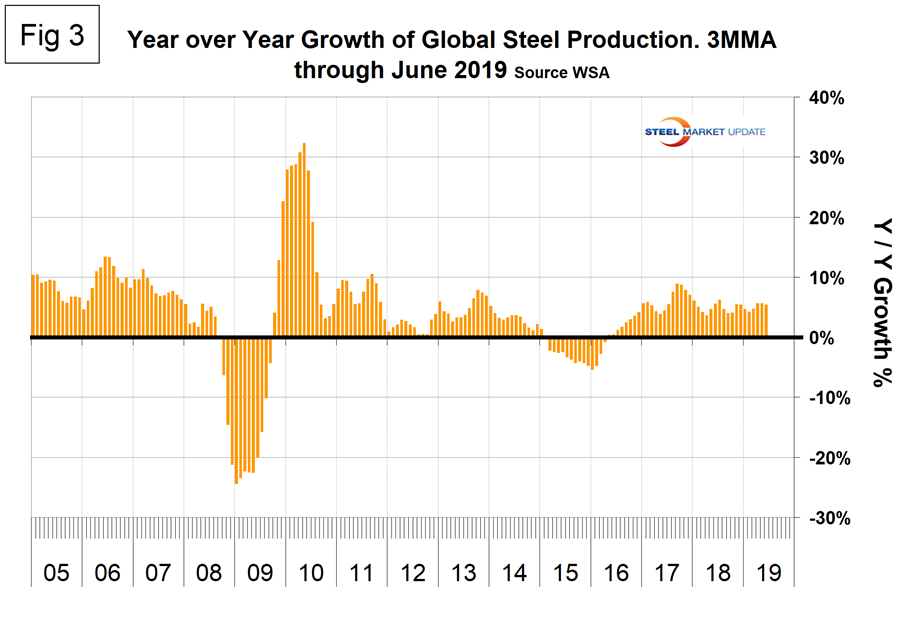
Table 1 shows global production broken down into regions, the production of the top 10 nations in the single month of June, and their share of the global total. It also shows the latest three months and 12 months of production through June with year-over-year growth rates for each period. Regions are shown in white font and individual nations in beige. The world overall had positive growth of 5.4 percent in three months and 4.9 percent in 12 months through June. When the three-month growth rate is higher than the 12-month growth rate, as it was in June, we interpret this to be a sign of positive momentum. On the same basis in June, China grew by 10.8 percent and 8.9 percent, and therefore also had positive momentum. All regions except North America and Asia had negative growth in three months through June year-over-year. Table 1 shows that North America was up by 1.0 percent in three months. Within North America, production was up by 4.4 percent in the U.S. and down by 7.7 percent in both Canada and Mexico. (Canada and Mexico are not shown in Table 1.)
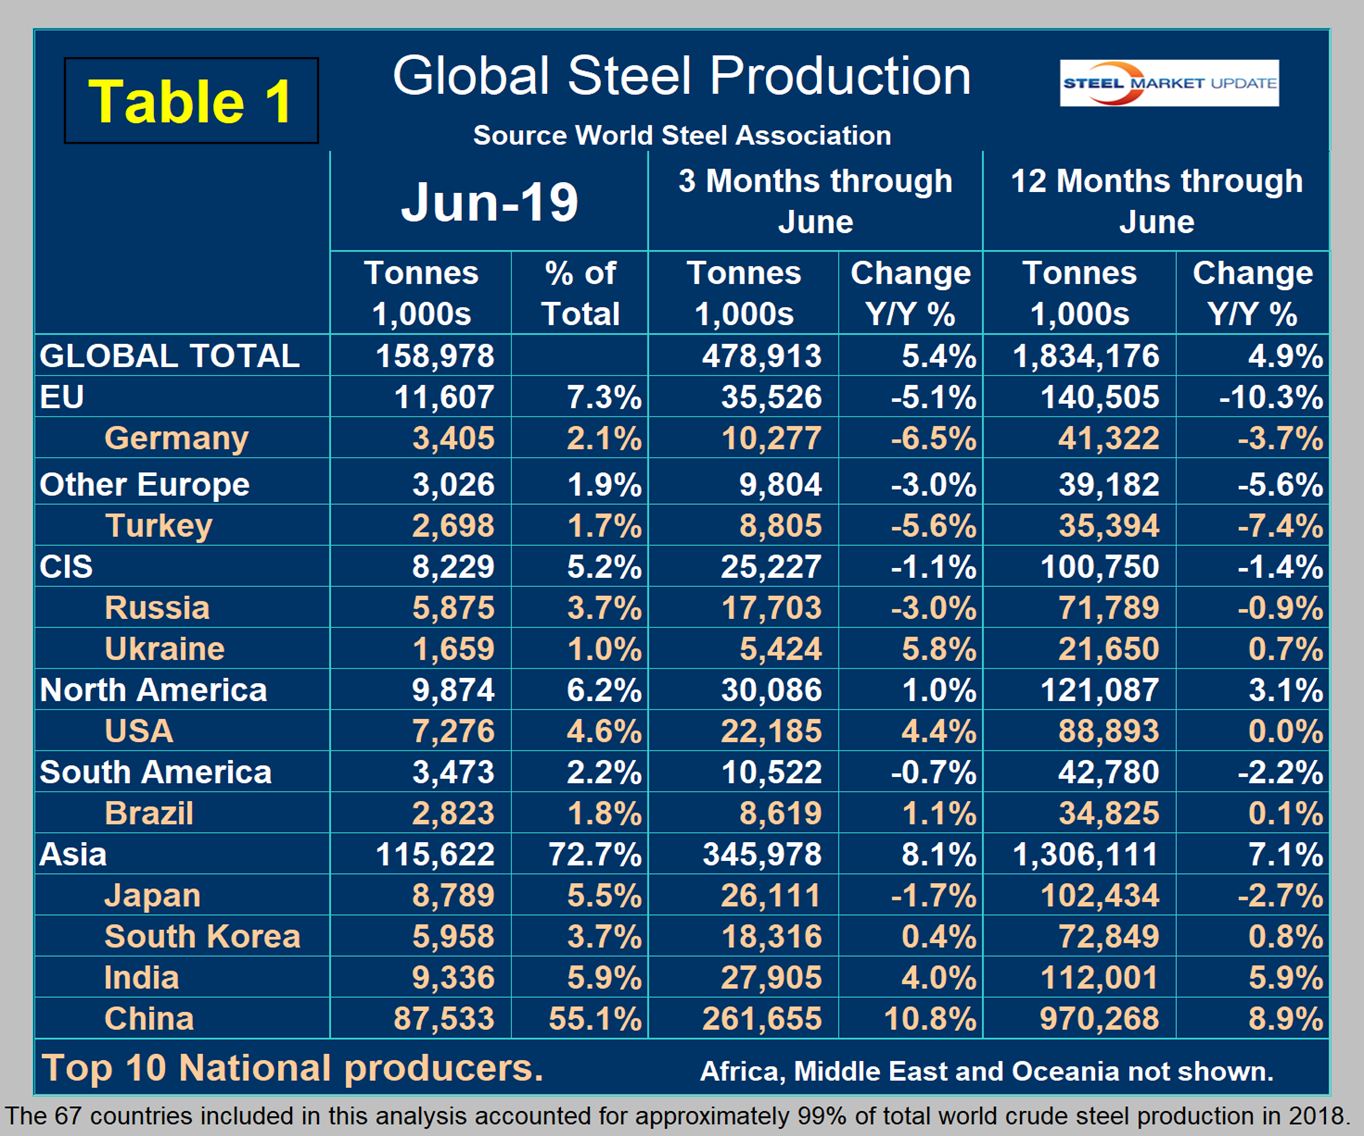
In the 12 months of 2018, 119.9 million metric tons were produced in North America of which 72.3 percent was produced in the U.S., 10.9 percent in Canada and 16.8 percent in Mexico.
Figure 4 shows China’s production since 2005. As just stated, global steel production was up by 5.4 percent in three months through June year-over-year and China was up by 10.8 percent, both with positive momentum. In the three months April through June, world steel production excluding China contracted by 0.5 percent.
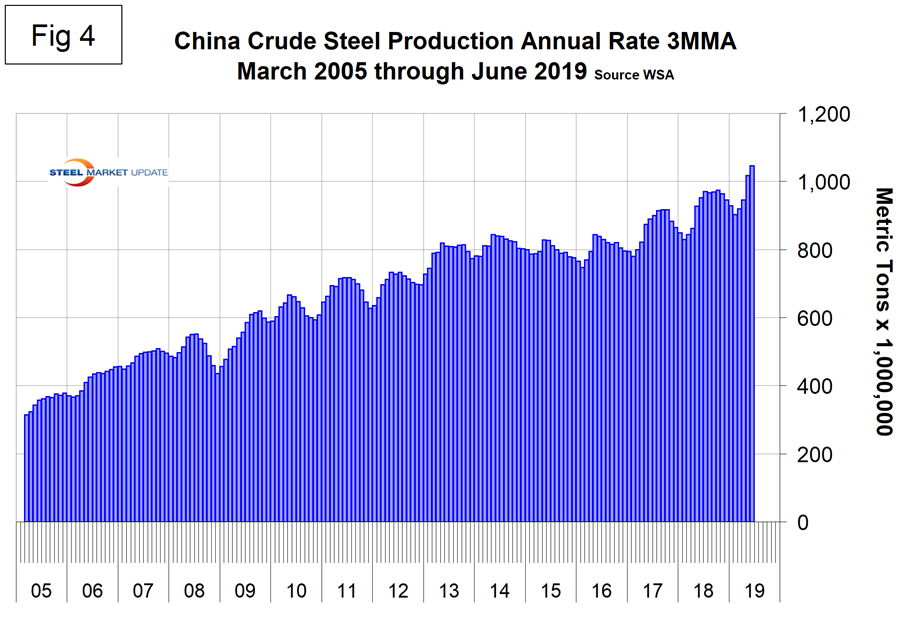
Figure 5 shows the growth of China’s steel production since January 2013 and Figure 6 shows the growth of global steel excluding China. China’s domination of the global steel market is increasing and in each month April, May and June for the first time had an annualized production rate of over one billion metric tons. The WSA is forecasting a deceleration in China’s steel production growth in 2019. The chairman of the World Steel economics committee stated recently that China is expected to experience zero growth in 2019, down from 6 percent in 2018. This is partly a result of trade tensions with the U.S. Five months into 2019, it is now obvious that this was an extraordinarily bad conclusion.
We have developed a new chart this month, presented as Figure 7. This shows the growth of China’s share of global steel production, which in June exceeded 55.0 percent for the first time in history.
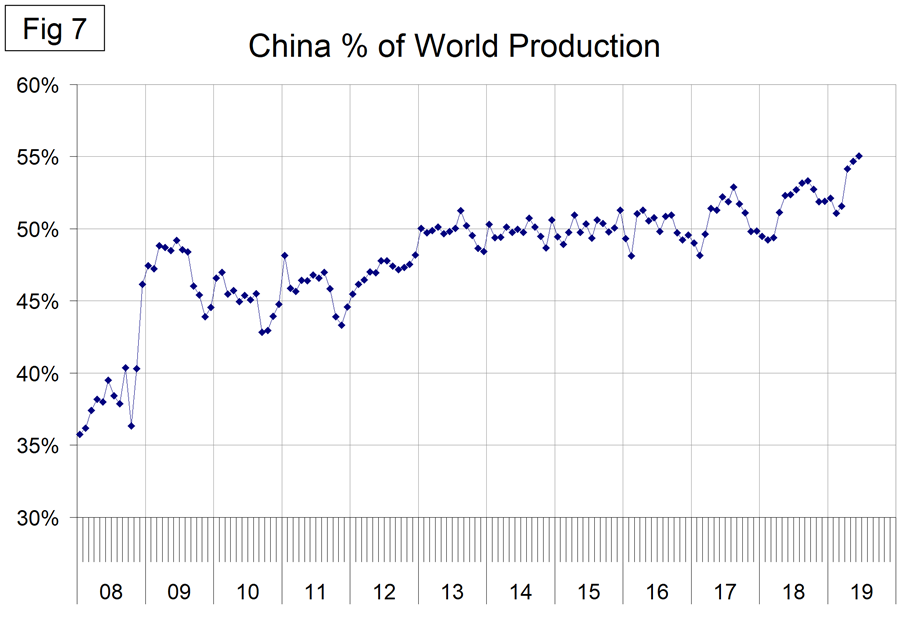
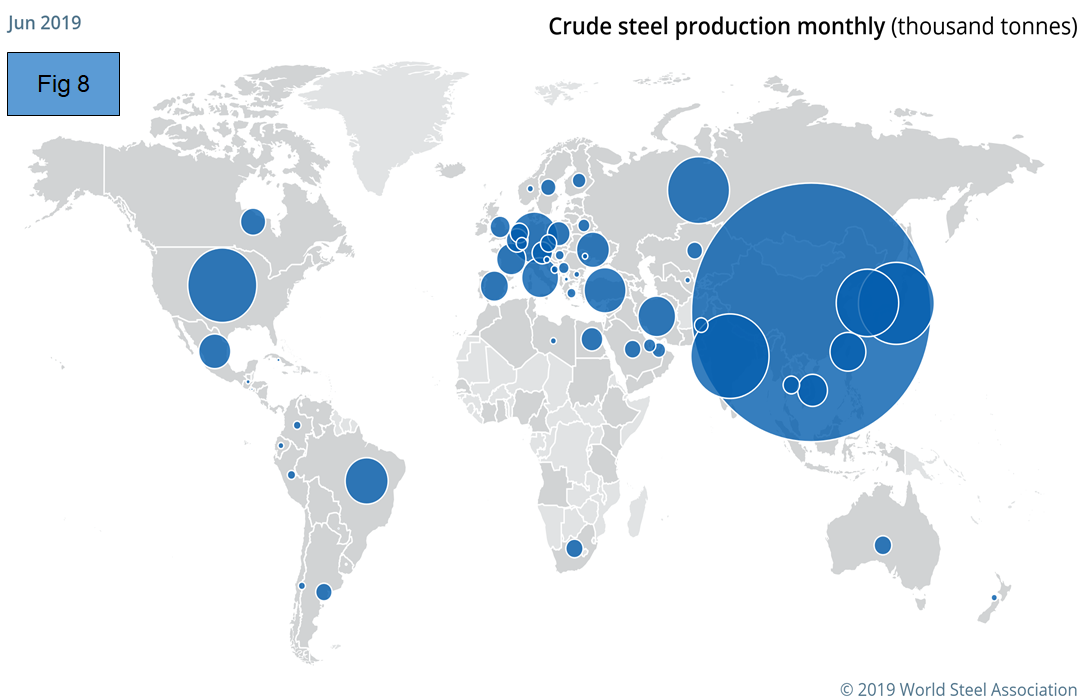
Figure 8 is a visual from the WSA showing the relative size of production in various countries.
The April 2019 WSA Short Range Outlook (SRO) for apparent steel consumption in 2018 and 2019 is shown by region in Figure 9. The WSA forecasts global steel demand will reach 1,735 billion Mt in 2019, an increase of 1.3 percent over 2018. (Note, the essence of this piece is crude steel production, therefore the numbers are greater than for steel consumption which relates to rolled products.)
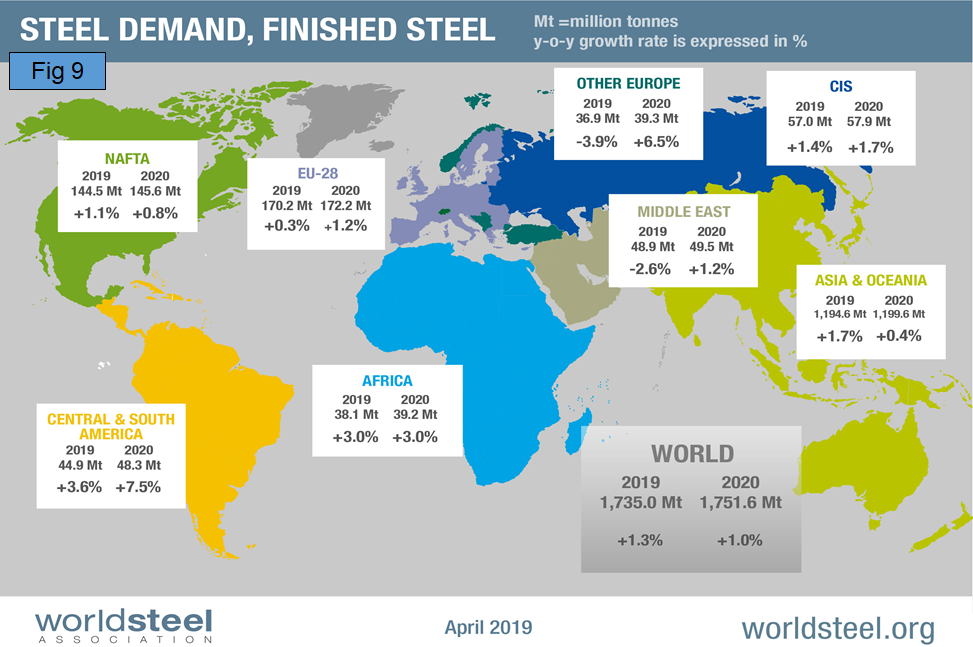
Commenting on the outlook, the chairman of the WSA economics committee said, “In 2017-18, steel demand in the U.S. benefitted from the strong growth of the economy driven by government-led fiscal stimulus, leading to high confidence and a robust job market. In 2019, the U.S. growth pattern is expected to slow with the waning effect of fiscal stimulus and a monetary policy normalization. Therefore, both construction and manufacturing growth is expected to moderate. Investment in oil and gas exploration is also expected to decelerate.”
SMU Comment: If the IMF update of the World Economic Outlook is accurate, global steel production will be negatively impacted in the coming months. The IMF went on to say: “Risks to the forecast are mainly to the downside. They include further trade and technology tensions that dent sentiment and slow investment; a protracted increase in risk aversion that exposes the financial vulnerabilities continuing to accumulate after years of low interest rates; and mounting disinflationary pressures that increase debt service difficulties, constrain monetary policy space to counter downturns, and make adverse shocks more persistent than normal.”
This analysis is based on data made public monthly by the World Steel Association. The WSA is one of the largest industry associations in the world. Members represent approximately 85 percent of the world’s steel production, including over 160 steel producers, national and regional steel industry associations and steel research institutes.


