

Market Data

July 26, 2019
SMU Energy Analysis: Oil Prices Not High Enough Yet to Boost Rig Count
Written by Peter Wright
The price of West Texas Intermediate crude oil briefly exceeded $60 per barrel for one week in July, but the rig count continues to decline, according to Steel Market Update’s analysis of data from the Energy Information Administration (EIA).
The spot price of West Texas Intermediate (WTI) FOB Cushing, Okla., exceeded $60 per barrel for one day on July 10 before falling back to $59.30 on July 15. The total number of operating rigs exploring for oil has declined by 129 since the end of last year. The prices of oil and natural gas drive the consumption of energy-related steel products including oil country tubular goods, pipe fittings and well head equipment, among others. Welded tubular goods (not including OCTG) consumed about 5.5 million tons of hot rolled sheet in 2018.
![]()
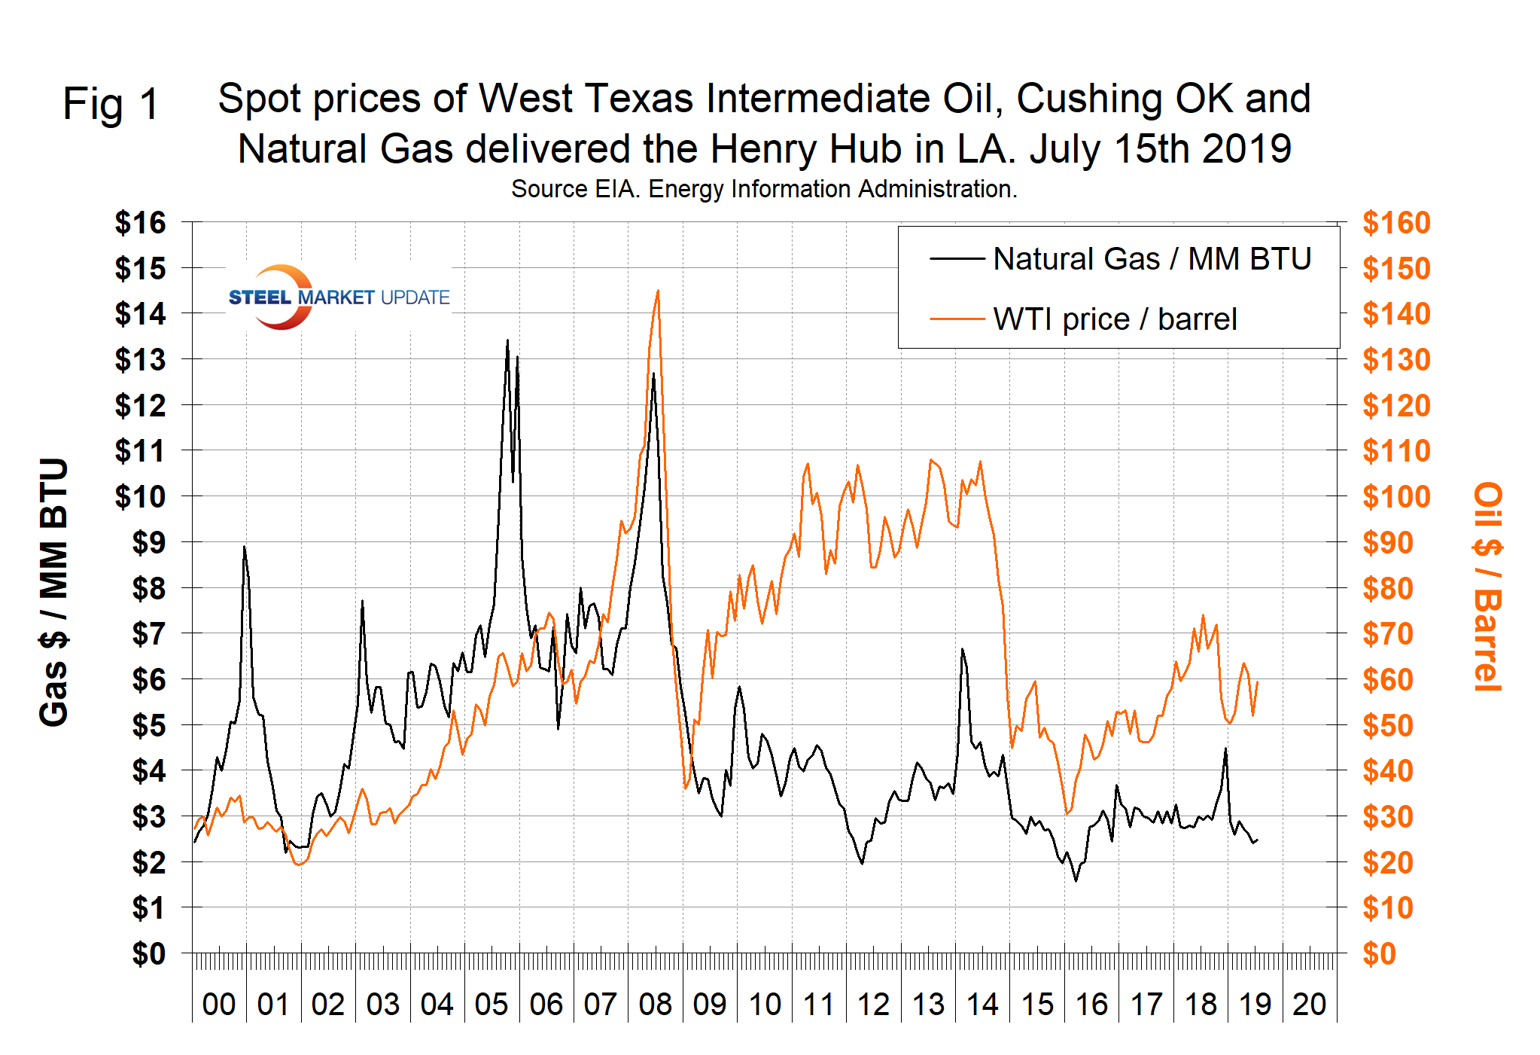
Figure 1 shows historical oil and gas prices from January 2000 through July 15, 2019. On July 12 (latest data available), natural gas at the Henry Hub in Oklahoma was priced at $2.47 per MMBtu (million British Thermal Units), up six cents on the month. Natural gas continues to make inroads against coal as a power generator. On June 27, Mining.com reported: “Since peaking in 2008, U.S. coal consumption has fallen 39% to the lowest level in 40 years. A Federal Energy Regulatory Commission report shows the total available installed generating capacity of coal stood at 257.5 gigawatts, slightly less than renewable energy sources. According to Bloomberg another 41GW are slated for retirement and a further 105GW of capacity is deemed at risk of closure. We project natural gas prices to remain within a band of $2.50 to $3.50/MMBtu and more likely on the lower end because of the abundant U.S. supplies of natural gas from shale, along with rapidly increasing associated gas from shale oil production. Additionally, coal-fired generation faces substitution risk from renewables such as wind, solar and battery storage as technology improvements have dramatically increased their cost competitiveness.”
The EIA short-term energy forecast of July 9 stated that West Texas Intermediate (WTI) crude oil prices will average $62 per barrel in the second half of 2019 and $63/b in 2020. EIA’s forecast WTI price of $63/b for December 2019 should be considered in the context of NYMEX WTI futures and options contract values for December 2019 delivery that traded during the five-day period ending July 3, 2019. These contracts suggest a range of $40/b to $84/b encompasses the market expectation for December NYMEX WTI prices at the 95% confidence level.
On June 14, the EIA reported that U.S. commercial crude oil inventories (excluding those in the Strategic Petroleum Reserve) fell for five straight weeks through the week ending July 12 for a total decline of 29.6 million barrels, but coincidentally stocks were up by the same amount year over year. Figure 2 shows the inventory level, including the strategic petroleum reserve and the year-over-year change.
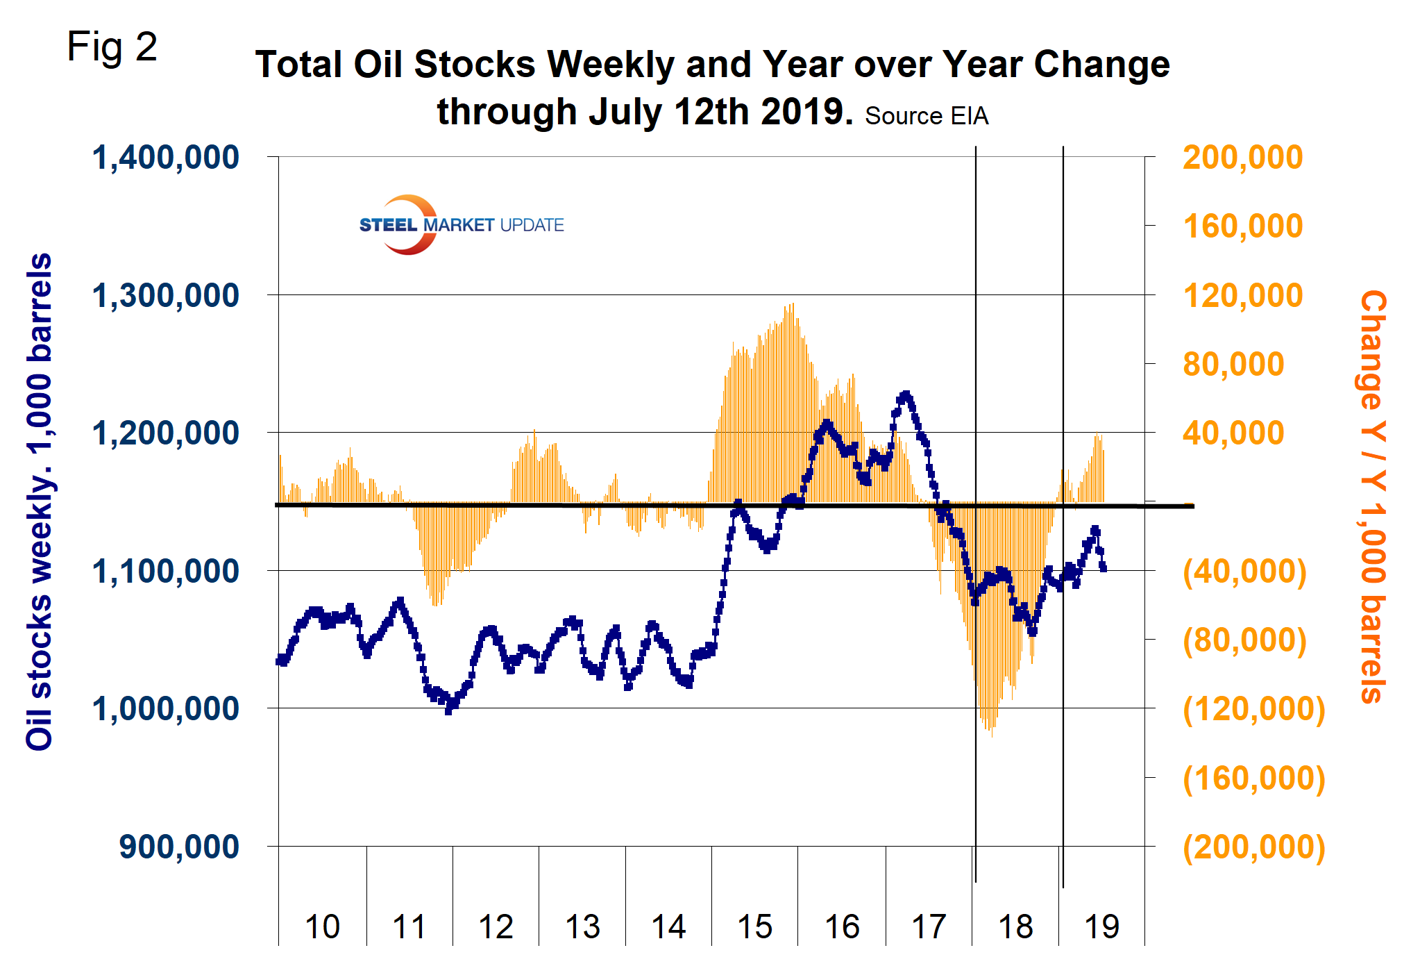
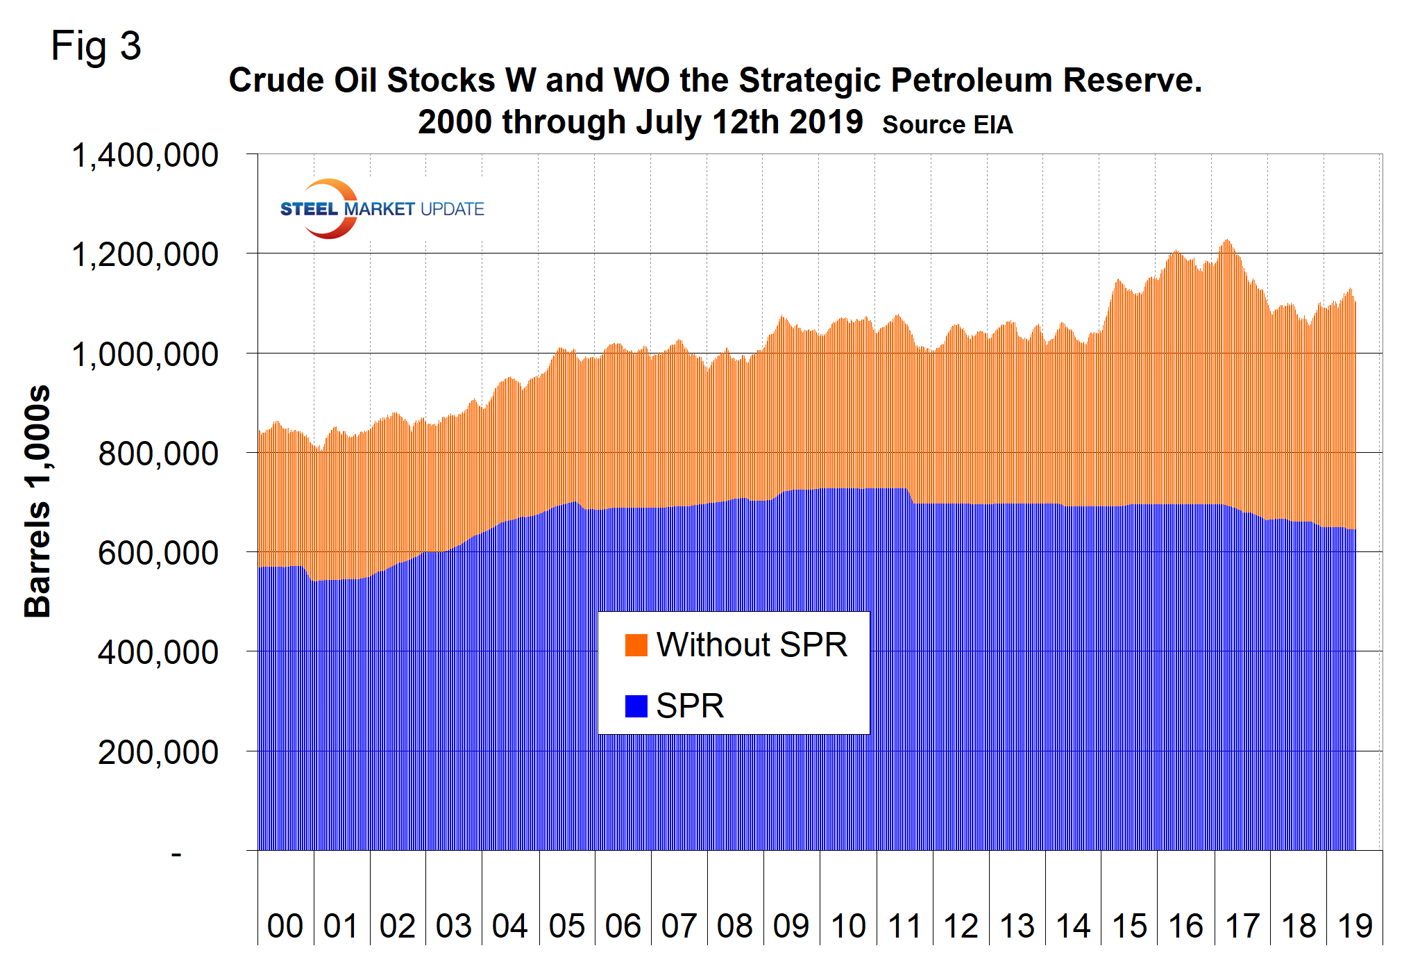
Figure 3 breaks total crude inventory into the working portion and the strategic petroleum reserve.
The total number of operating rigs in the U.S. on July 19 was 954, down by 129 since the end of last year. Oil rigs were down by 106 and gas by 23. Figure 4 shows the total number of operating rigs in the U.S. and the weekly change.
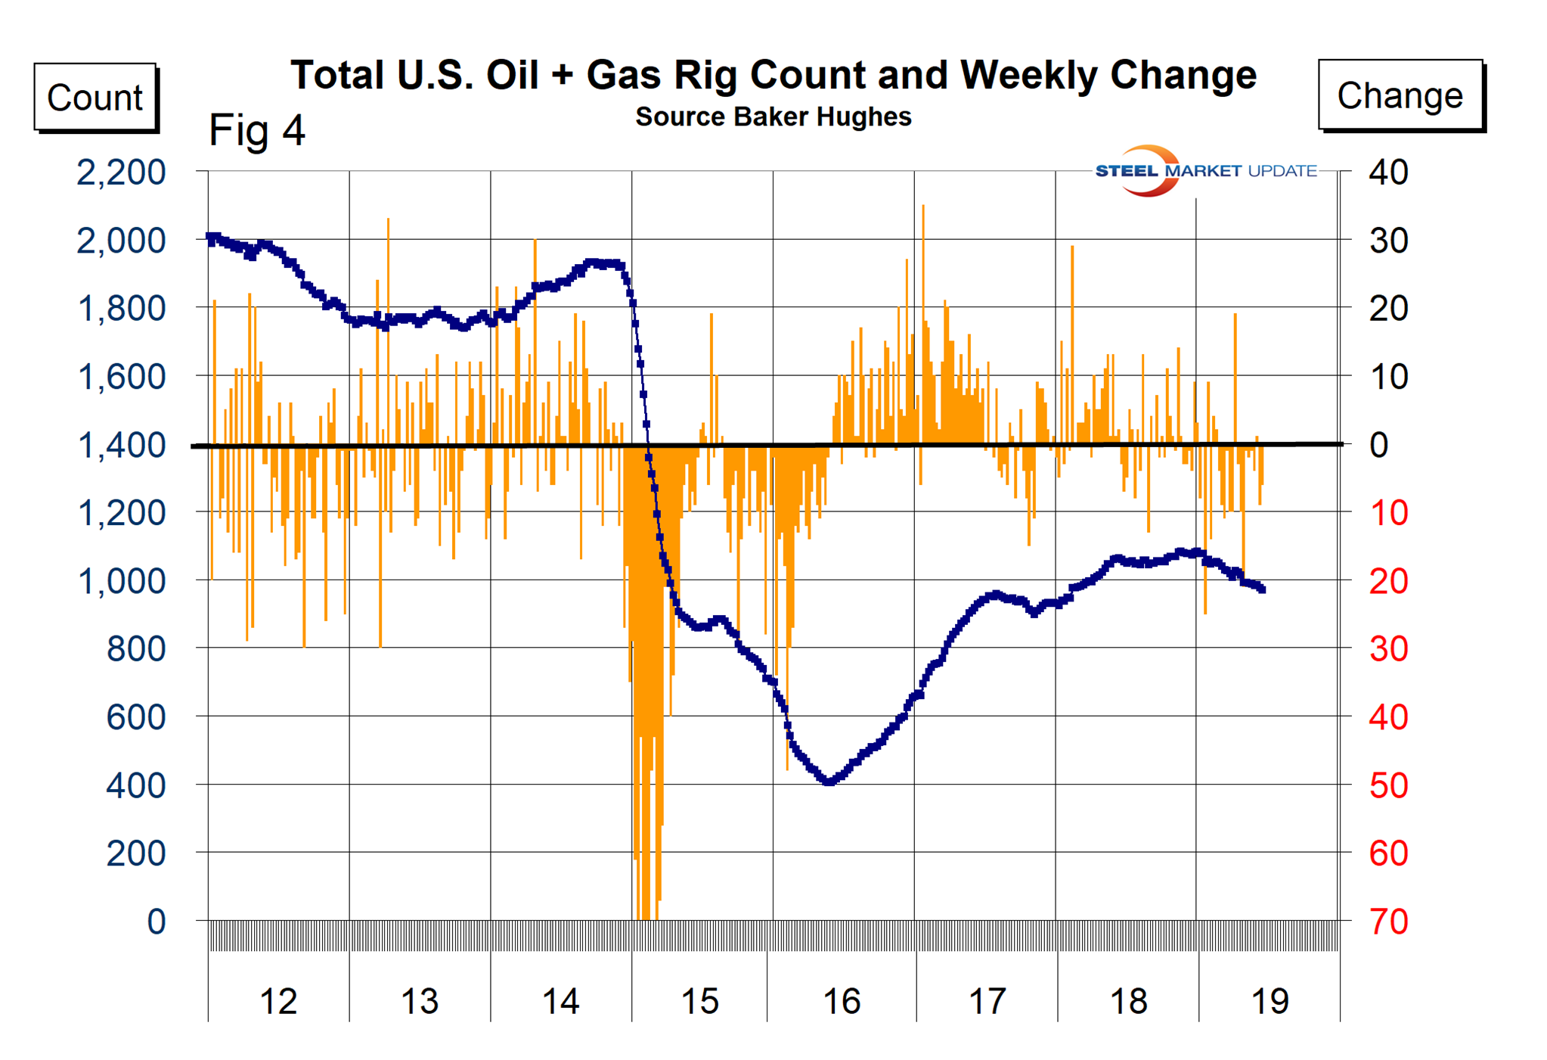
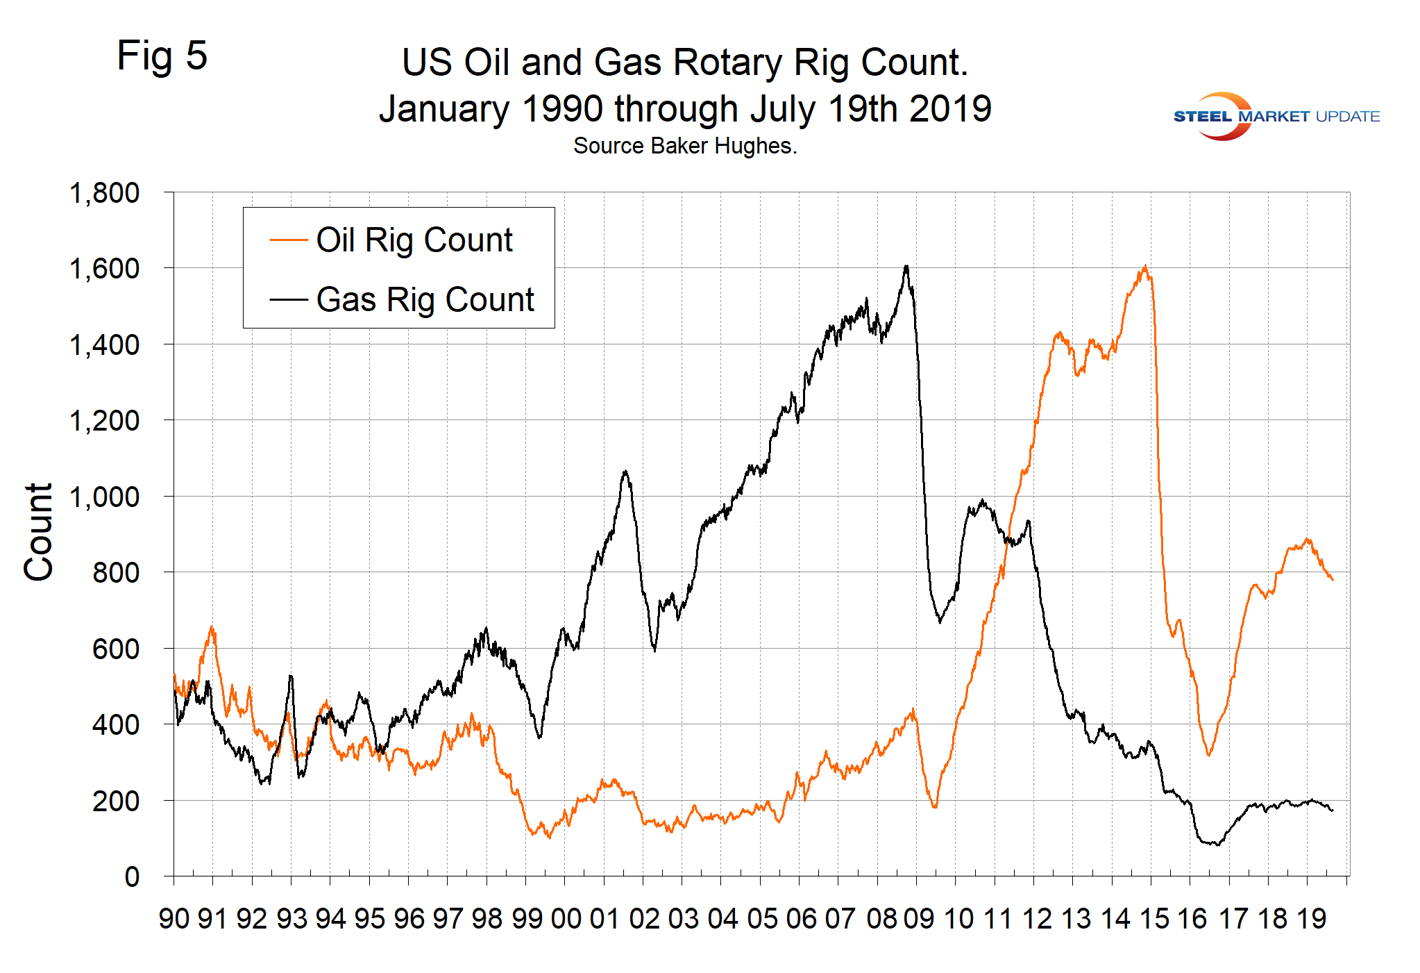
The oil rig count had a low point of 316 on June 27, 2016, and stood at 779 on July 19, 2019. The U.S. gas rig count rose from its low point of 81 on Aug. 5, 2016, to 202 on Jan. 11, 2019 before falling back to 174 on July 19, 2019. The year-over-year growth rate of total U.S. operating rigs was negative 8.8 percent in the latest data with oil down by 9.2 percent and gas down by 7.0 percent. Figure 5 shows the Baker Hughes U.S. Rotary Rig Counts for oil and gas equipment in the U.S. (explanation below).
On a regional basis in the U.S., the big three states for operating rigs are Texas, Oklahoma and North Dakota. Figure 6 shows the land rig count in those states since 2000.
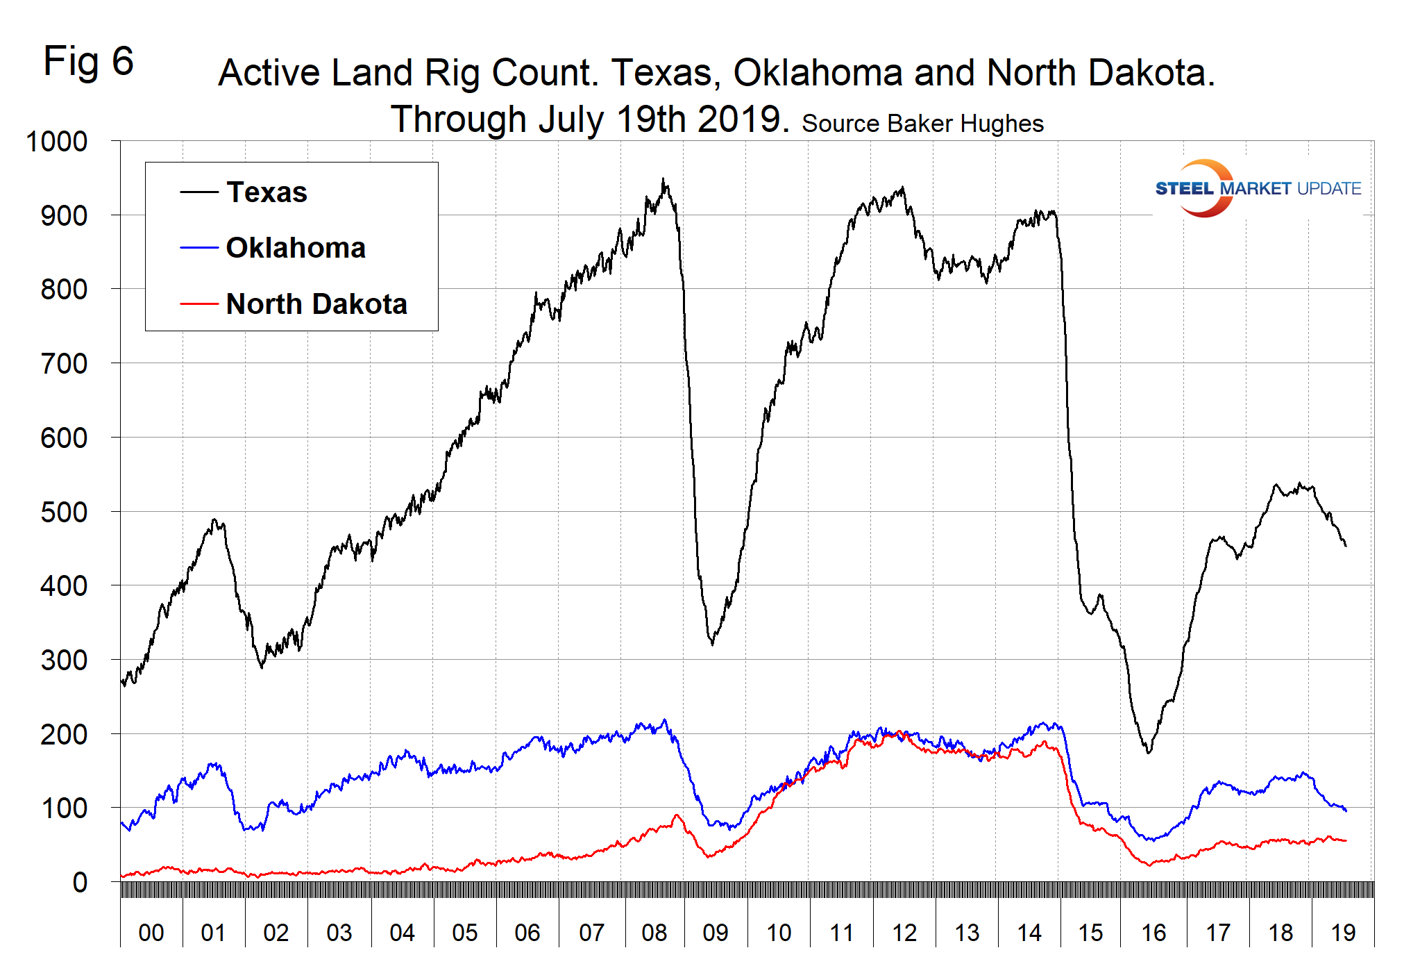
Figure 7 illustrates the monthly U.S. oilfield production of crude from January 1970 through April 2019, (latest data available) in thousands of barrels per month. The historical high was October 1970 at 310.4 million barrels. Production steadily declined to half that level in the late 2000s before the fracking revolution. December 2017 broke the record that had stood for 47 years with 310.7 million barrels produced, and December 2018 set a new record at 370.8 million barrels. April 2019 production was at 365 million barrels, almost the same as March and a recovery from the 327 million barrels produced in February.
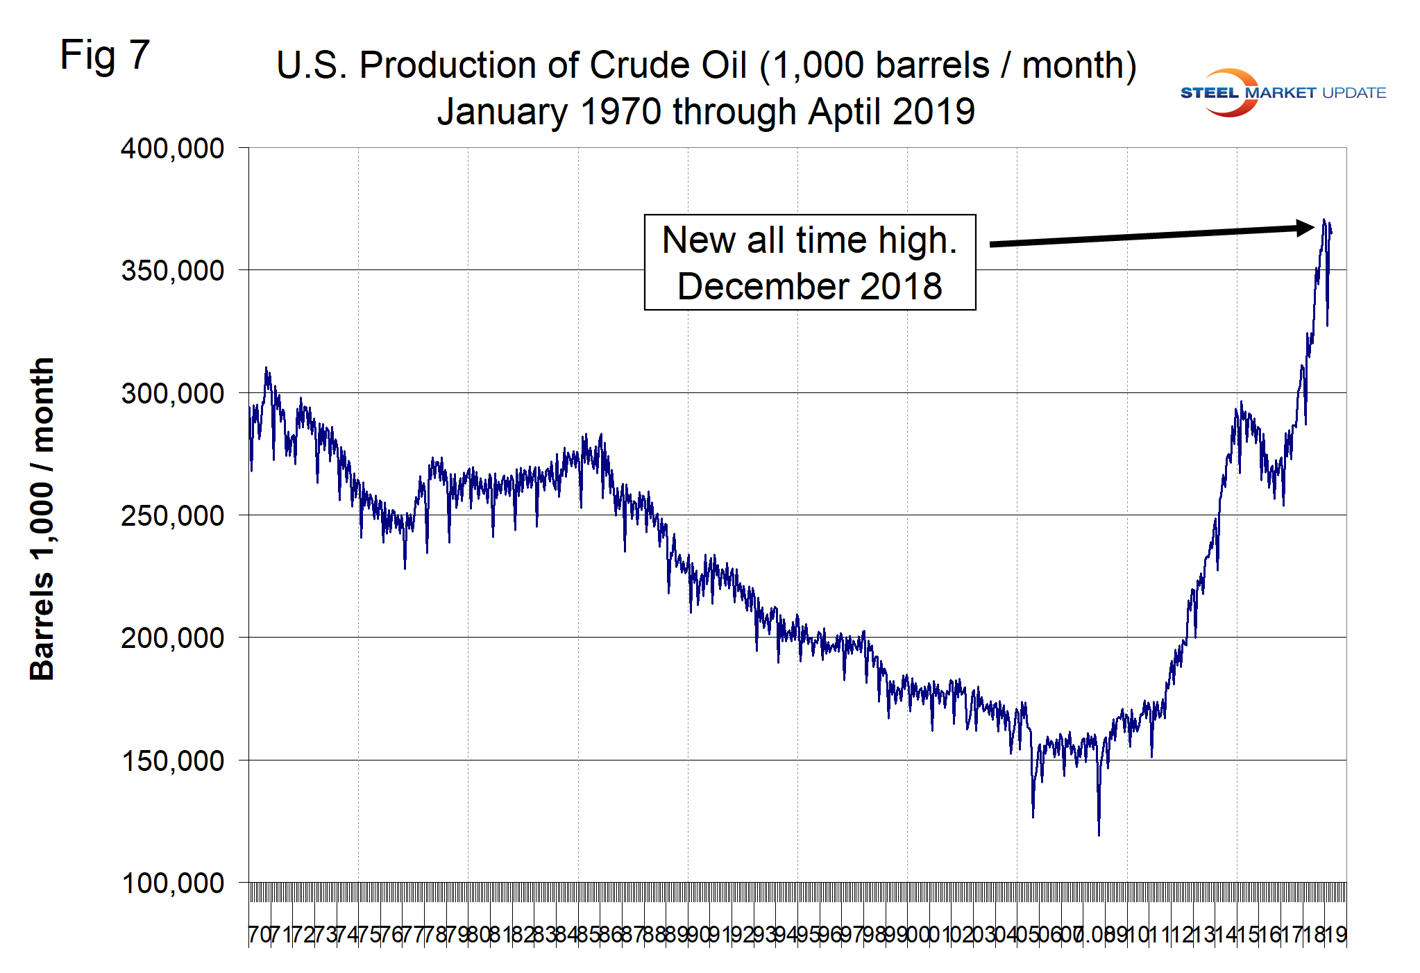
EIA estimates that U.S. crude oil production averaged 11.0 million b/d in 2018, up 1.6 million b/d from 2017, achieving a record high for total production and year-over-year growth. EIA forecasts U.S. crude oil production will average 12.4 million b/d in 2019 and 13.3 million b/d in 2020, with most of the growth coming from the Permian region of Texas and New Mexico.
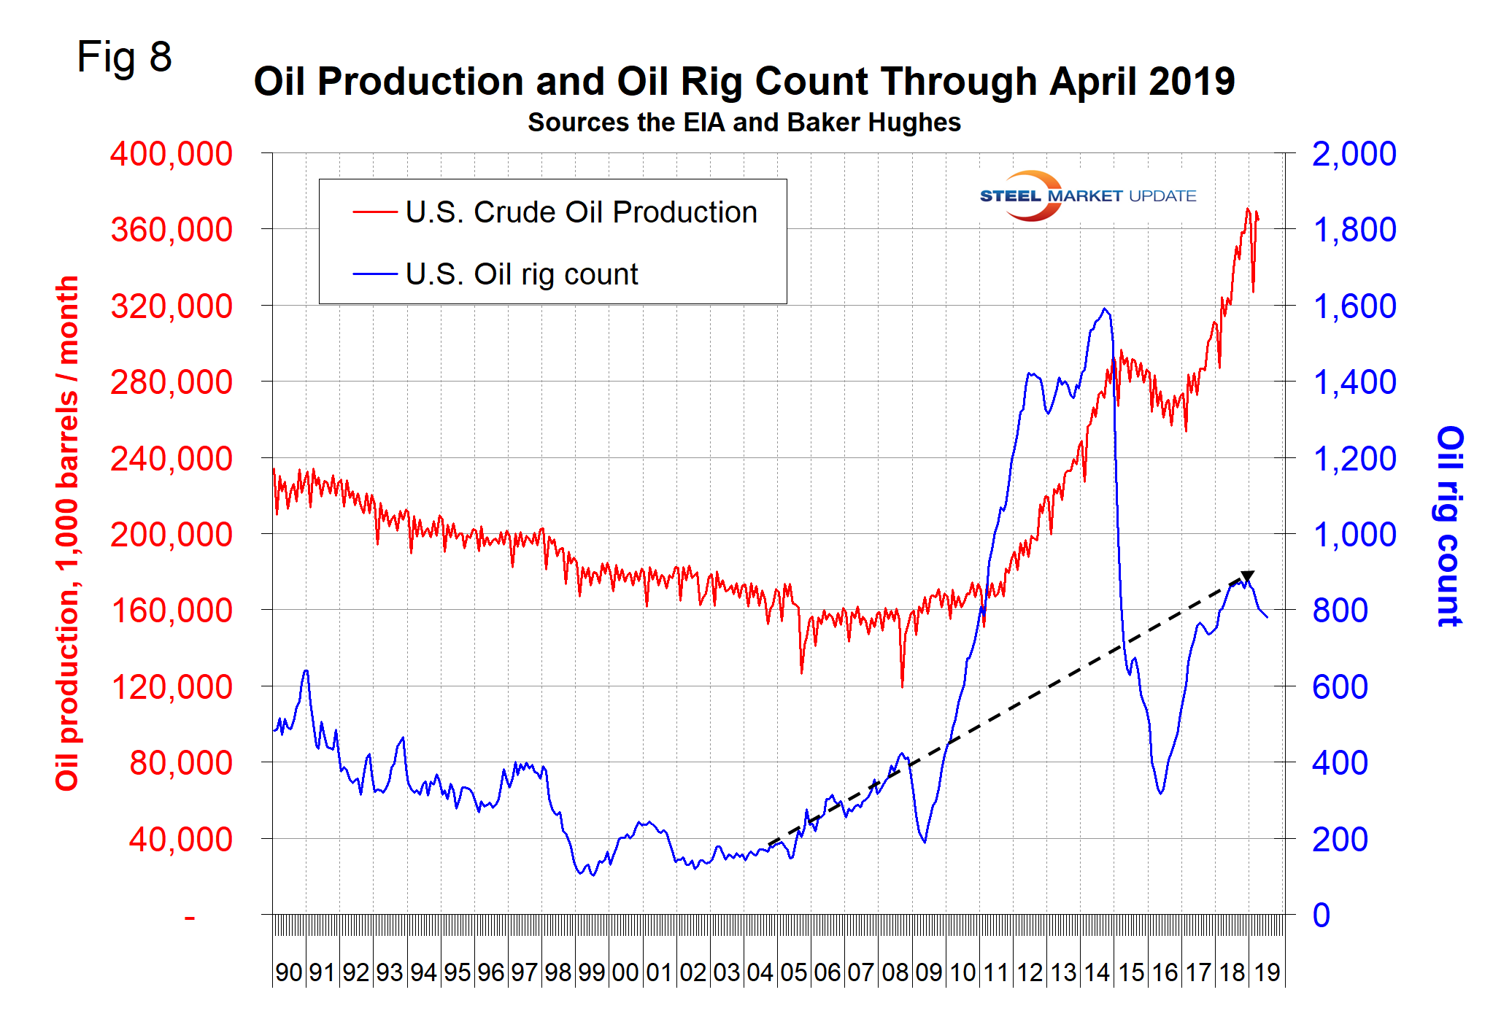
Figure 8 compares oil production and the oil rig count and shows how the increase in exploratory wells drove production from 2009 through late 2014 when the oil price collapsed.
Baker Hughes Rotary Rig Count: This is a weekly census of the number of drilling rigs actively exploring for or developing oil or natural gas in the United States. Rigs are considered active from the time they break ground until the time they reach their target depth and may be establishing a new well or sidetracking an existing one. The Baker Hughes Rotary Rig count includes only those rigs that are significant consumers of oilfield services and supplies.


