

Market Data

May 7, 2019
BLS: Employment by Industry for April
Written by Peter Wright
Job creation in manufacturing has slowed dramatically in the last three months, but construction employment is still expanding rapidly.
In April, 236,000 jobs were created in the private sector and government added 27,000. Table 1 breaks total employment down into service and goods-producing industries and then into private and government employees. Most of the goods-producing employees work in manufacturing and construction, and the components of these two sectors of most relevance to steel people are broken out in Table 1.
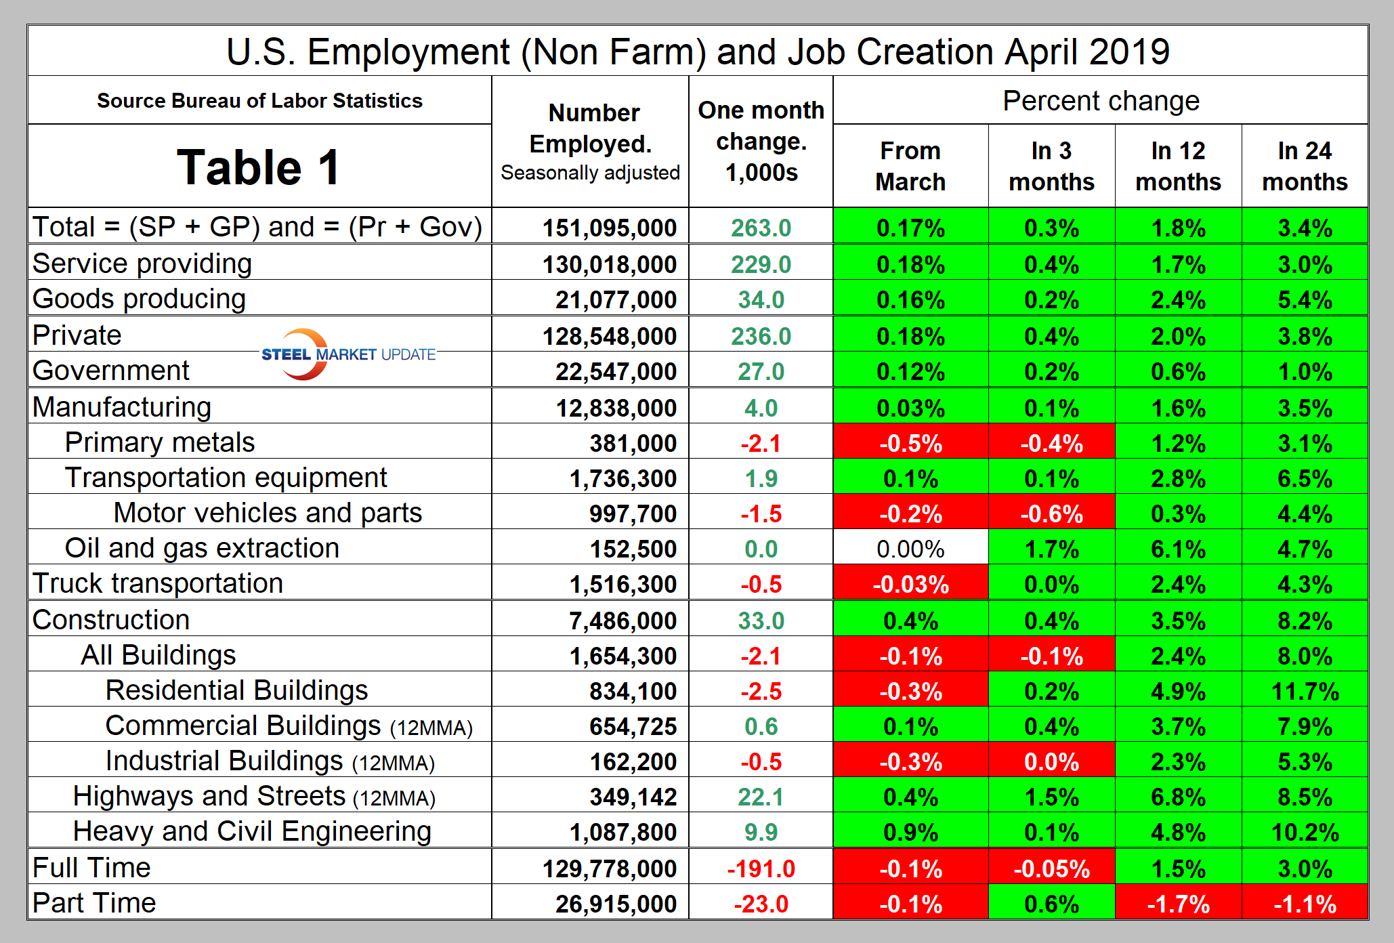
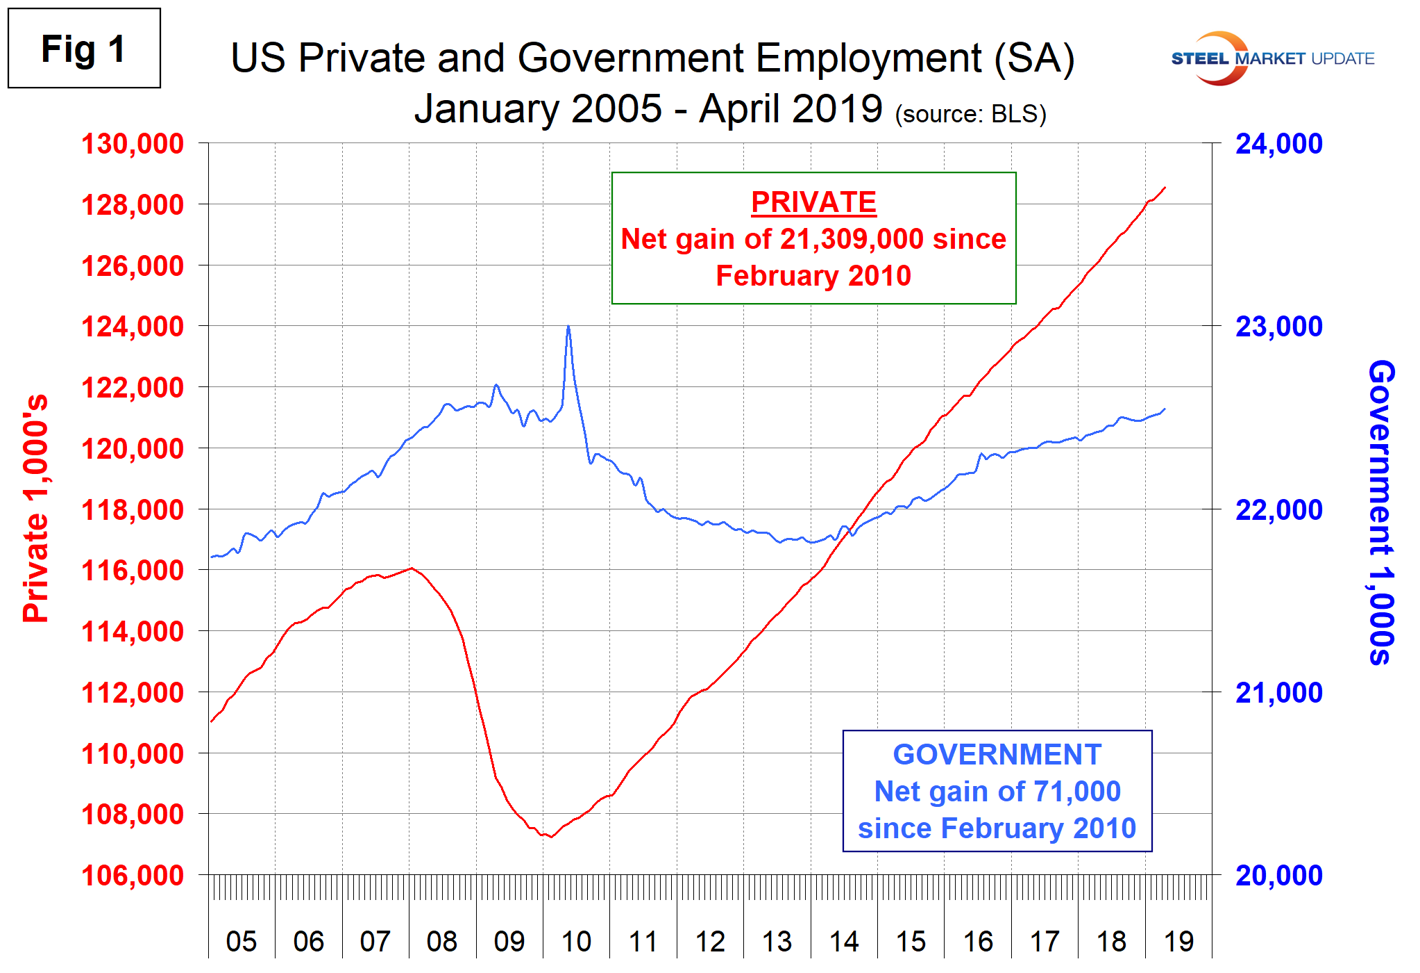
In April, the number employed by the federal government increased by 11,000. State governments cut 11,000 and the local level gained 27,000. Since April 2010, the low point of total nonfarm payrolls, private employers have added 21,309,000 jobs as government has gained 71,000 (Figure 1).
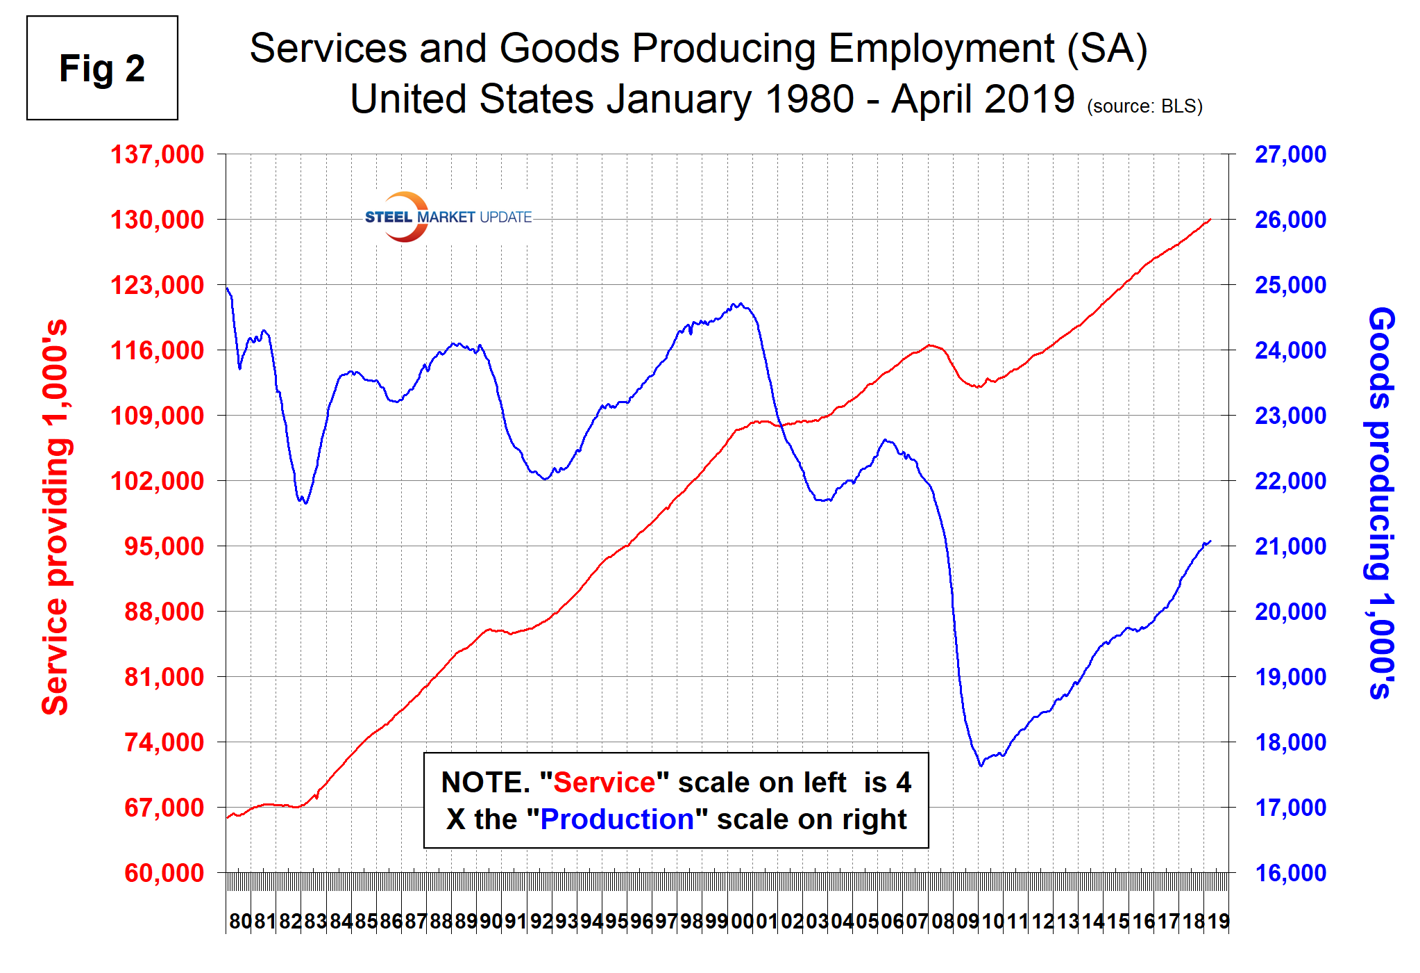
In April, service industries expanded by 229,000 as goods-producing industries, driven by construction and manufacturing, gained 34,000 (Figure 2). Since February 2010, service industries have added 17,930,000 and goods-producing 3,450,000 positions. This has been a drag on wage growth since the recession as service industries on average pay less than goods-producing industries such as manufacturing. The good news is that in the last 24 months the rate of job creation in goods-producing industries on a percentage basis has been half as much again as in service industries.
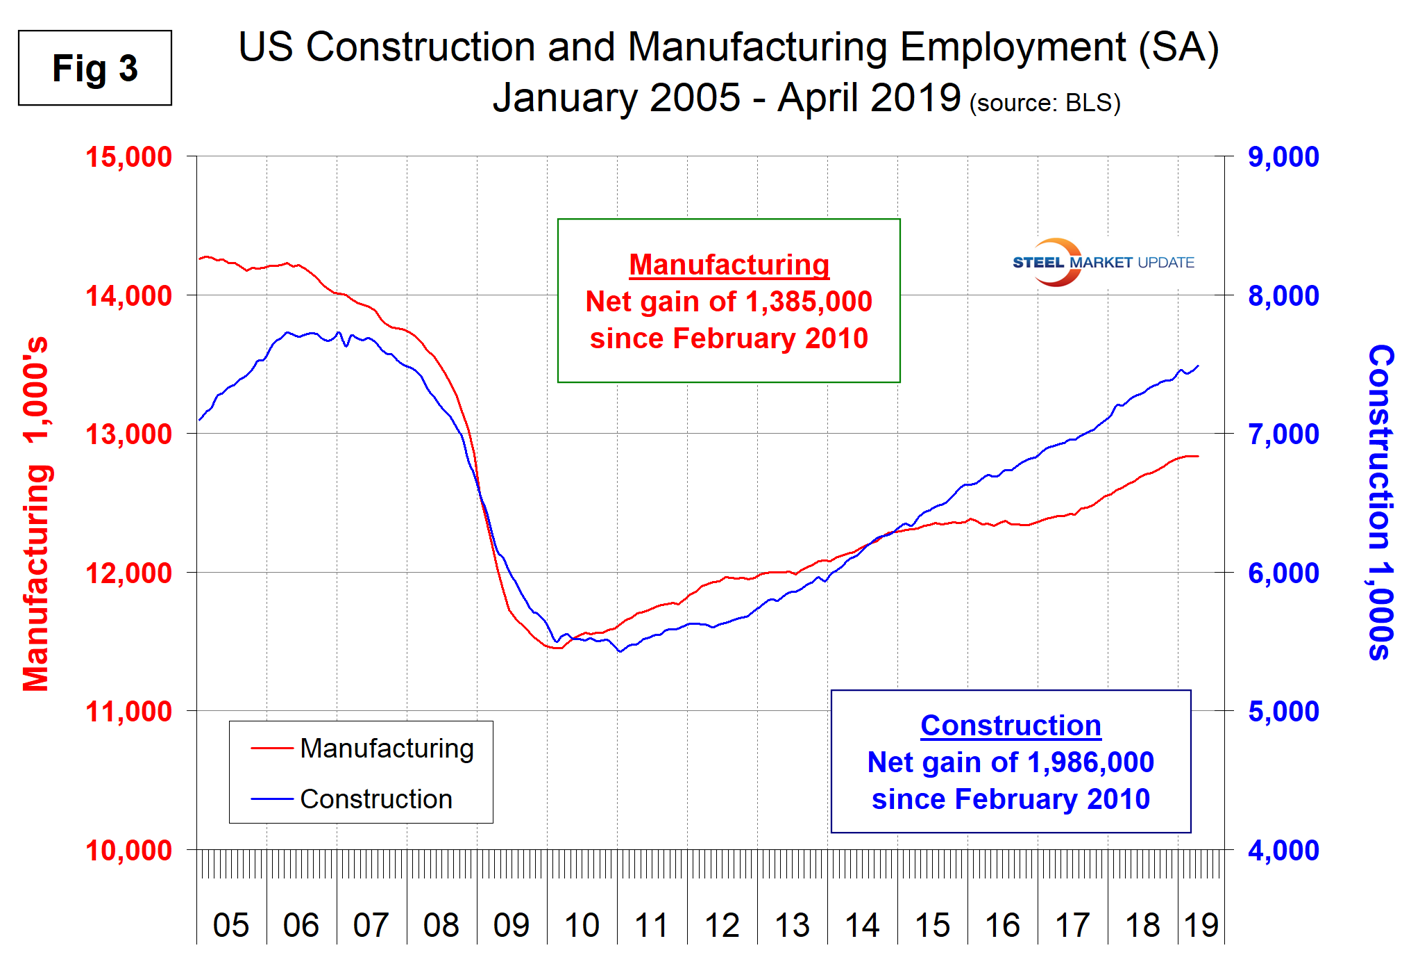
Construction was reported to have gained 33,000 jobs in April as manufacturing gained 4,000. Since and including January 2018, construction has added 194,000 and manufacturing 142,000 jobs Manufacturing productivity improved by 1.2 percent in Q1 2019. Figure 3 shows the history of construction and manufacturing employment since April 2005. Construction has added 1,947,000 jobs and manufacturing 1,368,000 since the recessionary employment low point in February 2010.
Note, the subcomponents of both manufacturing and construction shown in Table 1 don’t add up to the total because we have only included those with the most relevance to the steel industry.
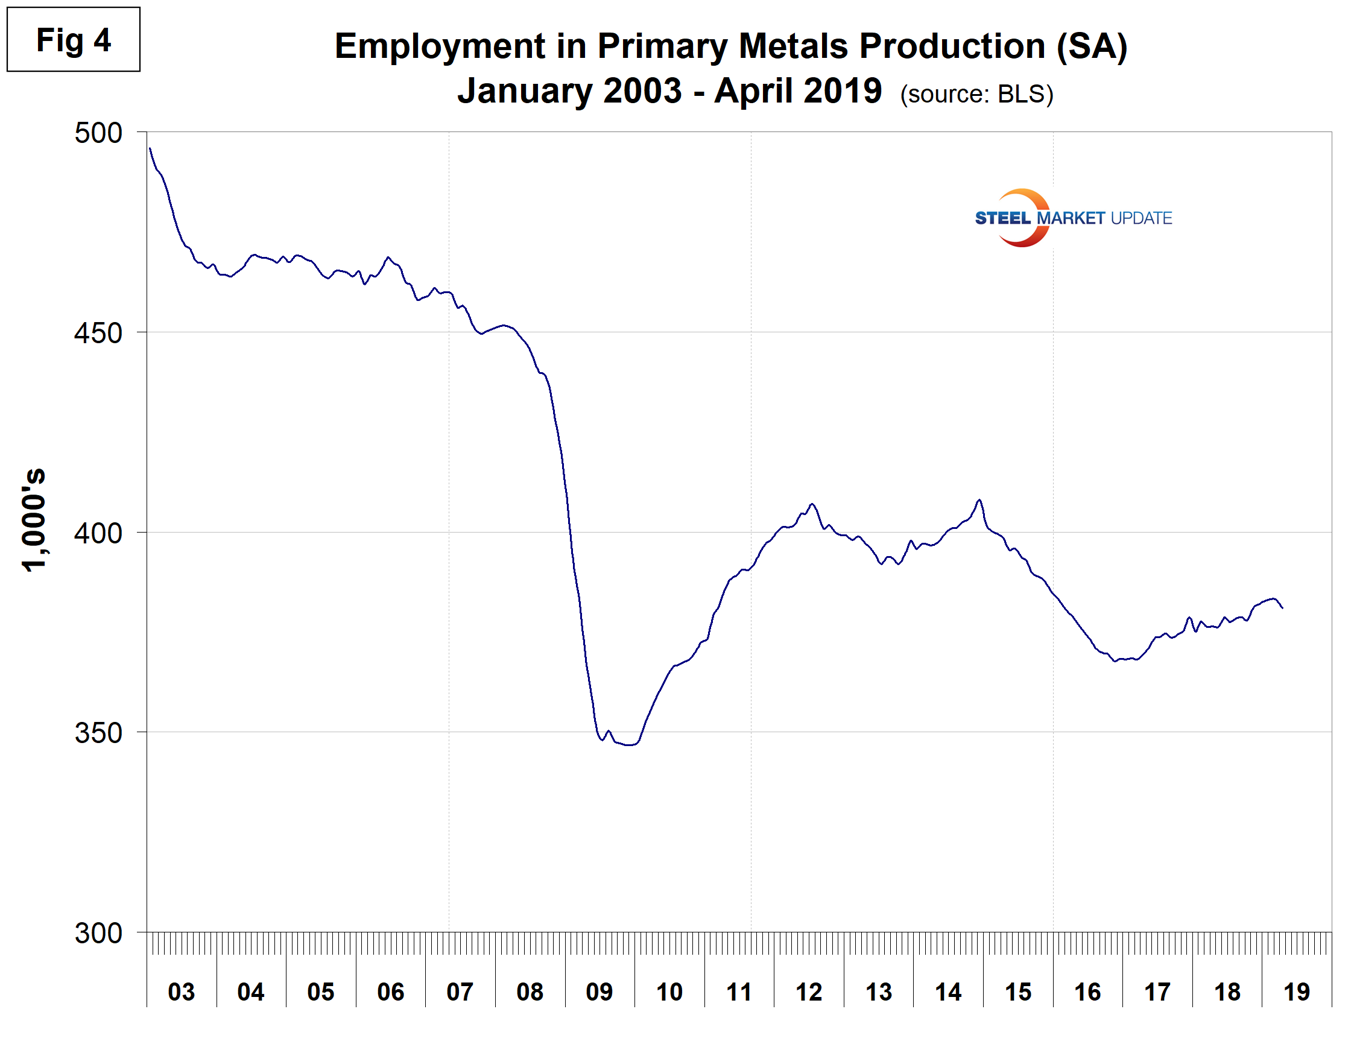
Table 1 shows that primary metals lost 2,100 jobs in April, and in the last 12 and 24 months has gained on a percentage basis less than manufacturing as a whole. Figure 4 shows the history of primary metals employment since January 2003.
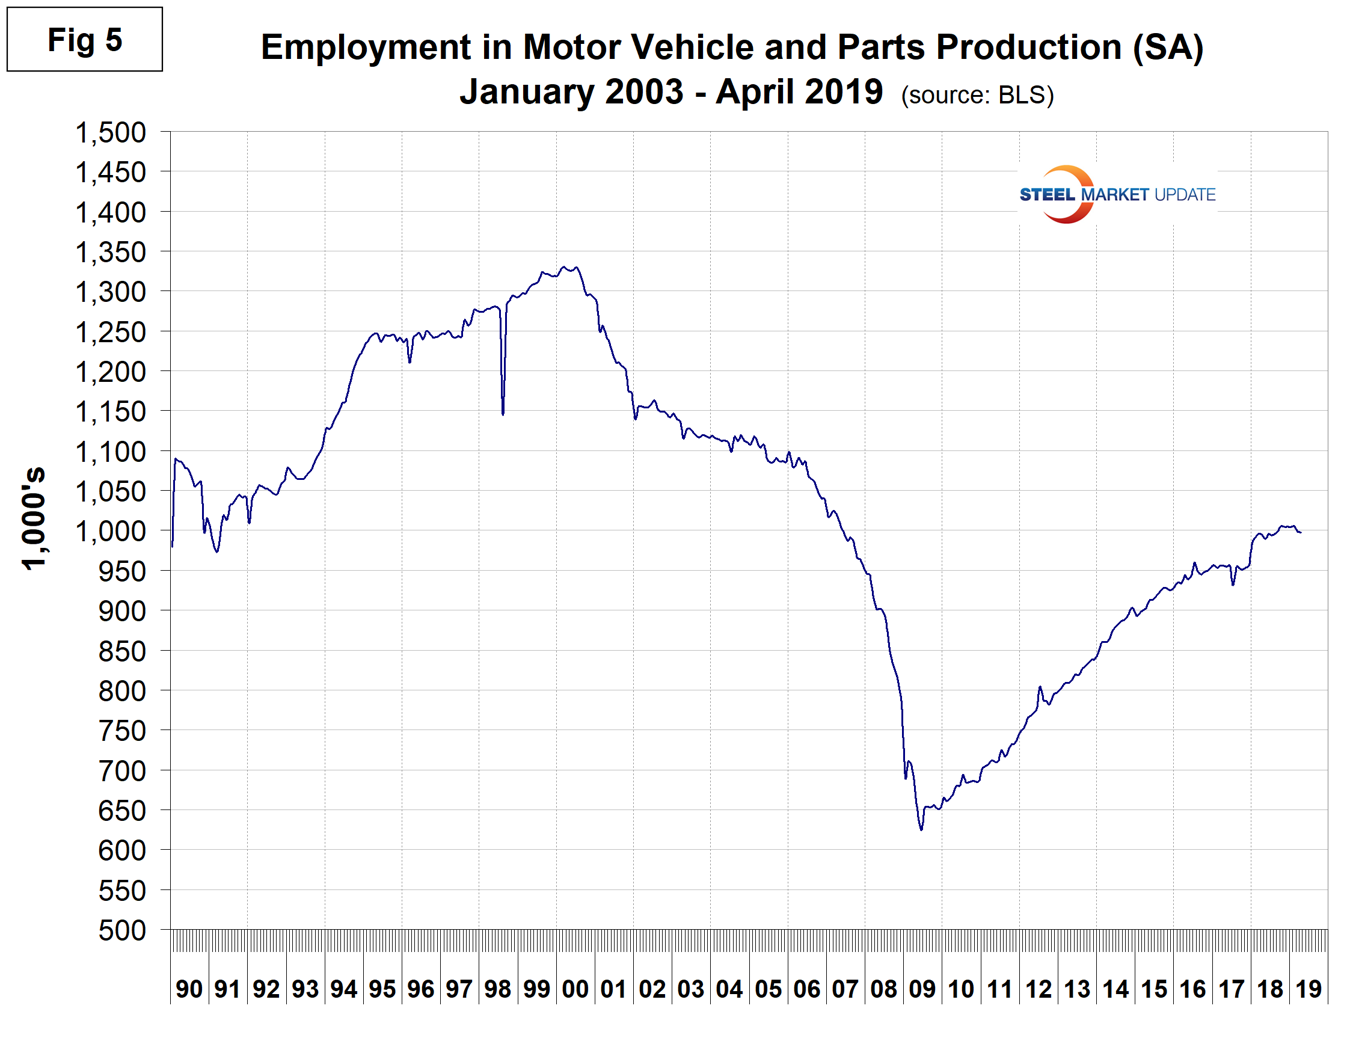
Motor vehicles and parts industries were reported to have lost 1,500 jobs in April, reducing the 12-month gain to only 3,000. Figure 5 shows the history of motor vehicles and parts employment.
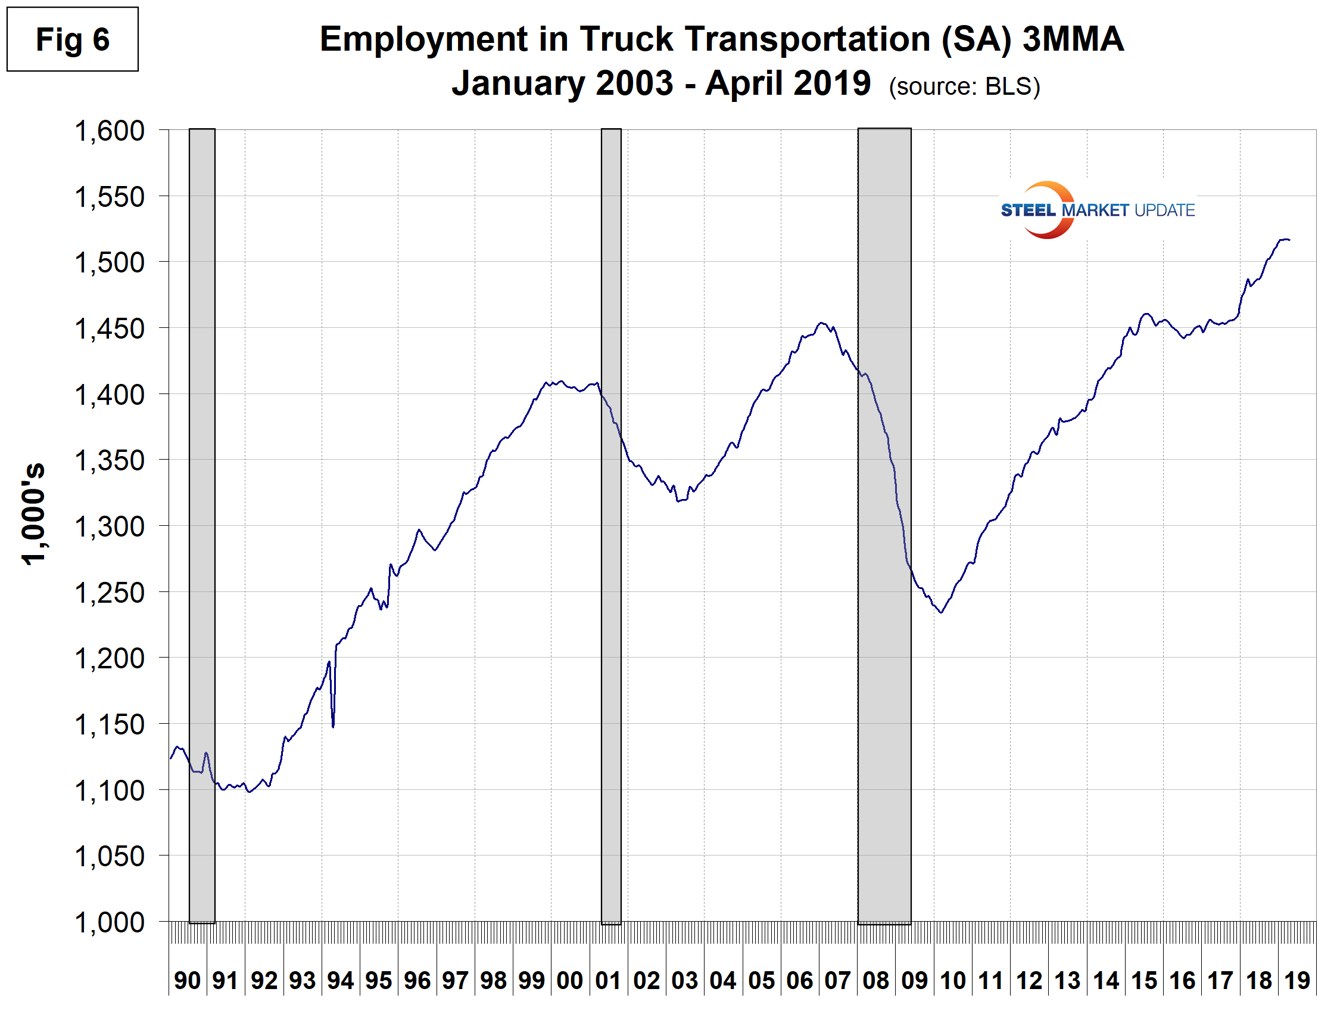
Trucking lost 500 jobs in April, resulting in a 12-month gain of 34,900. Employment in truck driving is one of SMU’s recession monitors and Figure 6 suggests that at the present time the economy is still on a roll.
SMU Comment: The April employment report showed the February result to be a statistical anomaly. Manufacturing has slowed dramatically as a job creator in the last three months, but construction is expanding rapidly.
Explanation: On the first or second Friday of each month, the Bureau of Labor Statistics releases the employment data for the previous month. Data is available at www.bls.gov. The BLS employment database is a reality check for other economic data streams such as manufacturing and construction. It is easy to drill down into the BLS database to obtain employment data for many subsectors of the economy. The important point about all these data streams is the direction in which they are headed.


