Market Data

April 23, 2019
China Stimulus in 2018-19: Q1 Growth Stabilization in Four Charts
Written by Tim Triplett
By CRU Chief Economist Jumana Saleheen
The latest Chinese data surprised on the upside. It suggests that the China stimulus is working. But some of the strength is also likely due to one-off factors. As a result, we see the latest data as an indication that the economy is stabilizing rather than accelerating.
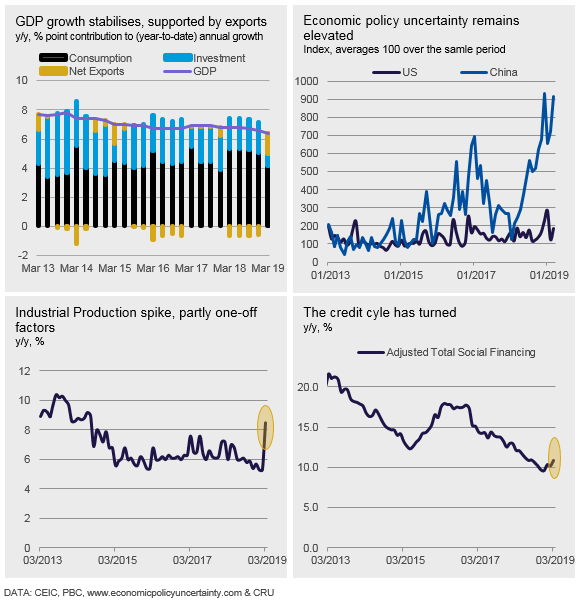
Recent data suggests that the stimulus measures introduced in 2018-2019 are working to stabilize the Chinese economy, both directly and through restoring confidence. Growth in Q1 rose by 6.4 percent, the same rate as the previous quarter. This is a shade above our expectations and the market consensus of 6.3 percent.

The first chart above shows that growth in Q1 was supported by a rebound in net exports, and solid consumption—investment contributed less to growth than it did last year. The strength in exports is likely to reflect the trade truce with the U.S., where tariffs on Chinese goods have remained at 10 percent—and not increased to 25 percent. The positive signals from the U.S.-China trade talks, and the new stimulus announced by China at the National People’s Congress (NPC) in March, is likely to have boosted confidence.
In contrast, the second chart shows that measures of economic policy uncertainty remained elevated in March. Uncertainty had reached an all-time high in December when trade tensions were rife, but fell back in January and February, as trade talks progressed well. We think the rise in January reflects concerns that the trade deal is taking longer than had been originally planned.
The third chart—bottom left—shows the much-discussed pickup in Industrial Production (IP). IP grew by 8.5 percent in March, up from 5.3 percent in February, which was a nine-year low. The strong IP figure for March also sits at odds with the weak contribution to growth from investment noted above. But it is consistent with an improvement in the property market, with real estate sales growth turning positive in March, and construction starts coming in at a punchy 18 percent on a year ago. Given these mixed signals, we are interpreting part of the strength in March IP as a blip rather than the hallmarks of a new upward trend. In part, this strength reflects a bounce back from the lows in February, which arose due to the earlier timing of the Chinese New Year holidays.
Credit growth has picked up at the turn of the year—fourth chart. Our measure of adjusted total social financing rose to 10.8 percent in March, up from 9.5 percent in December. This rise came mainly through banks’ lending more to companies, as had been asked by the government. But in addition, bond market issuance has also been solid. Local authorities have responded to the special permission granted to them this year to fund new projects through the issuance of special bonds as early as January. In previous years, these bonds were not allowed to be issued until after the NPC in March.
Overall, the latest Chinese data suggest that the economy is stabilizing faster and quicker than anticipated. And that the stimulus is working. This is good news for global growth prospects and for commodities markets. But we remain cautious as to whether the better-than-expected Q1 data is a flash in the pan or here to stay.


