

Market Data
April 15, 2019
IMF Global Economic Outlook & Forecast
Written by Peter Wright
The International Monetary Fund has reduced its estimate of U.S. GDP growth for 2019, but increased it in each year 2020 through 2024.
![]()
The IMF updates its World Economic Outlook (WEO) in April and October each year. On April 9, the following was published in the IMF blog:
“After strong growth in 2017 and early 2018, global economic activity slowed notably in the second half of last year, reflecting a confluence of factors affecting major economies. China’s growth declined following a combination of needed regulatory tightening to rein in shadow banking and an increase in trade tensions with the United States. The euro area economy lost more momentum than expected as consumer and business confidence weakened and car production in Germany was disrupted by the introduction of new emission standards; investment dropped in Italy as sovereign spreads widened; and external demand, especially from emerging Asia, softened. Elsewhere, natural disasters hurt activity in Japan. Trade tensions increasingly took a toll on business confidence and, so, financial market sentiment worsened, with financial conditions tightening for vulnerable emerging markets in the spring of 2018 and then in advanced economies later in the year, weighing on global demand. Conditions have eased in 2019 as the U.S. Federal Reserve signaled a more accommodative monetary policy stance and markets became more optimistic about a U.S.–China trade deal.”
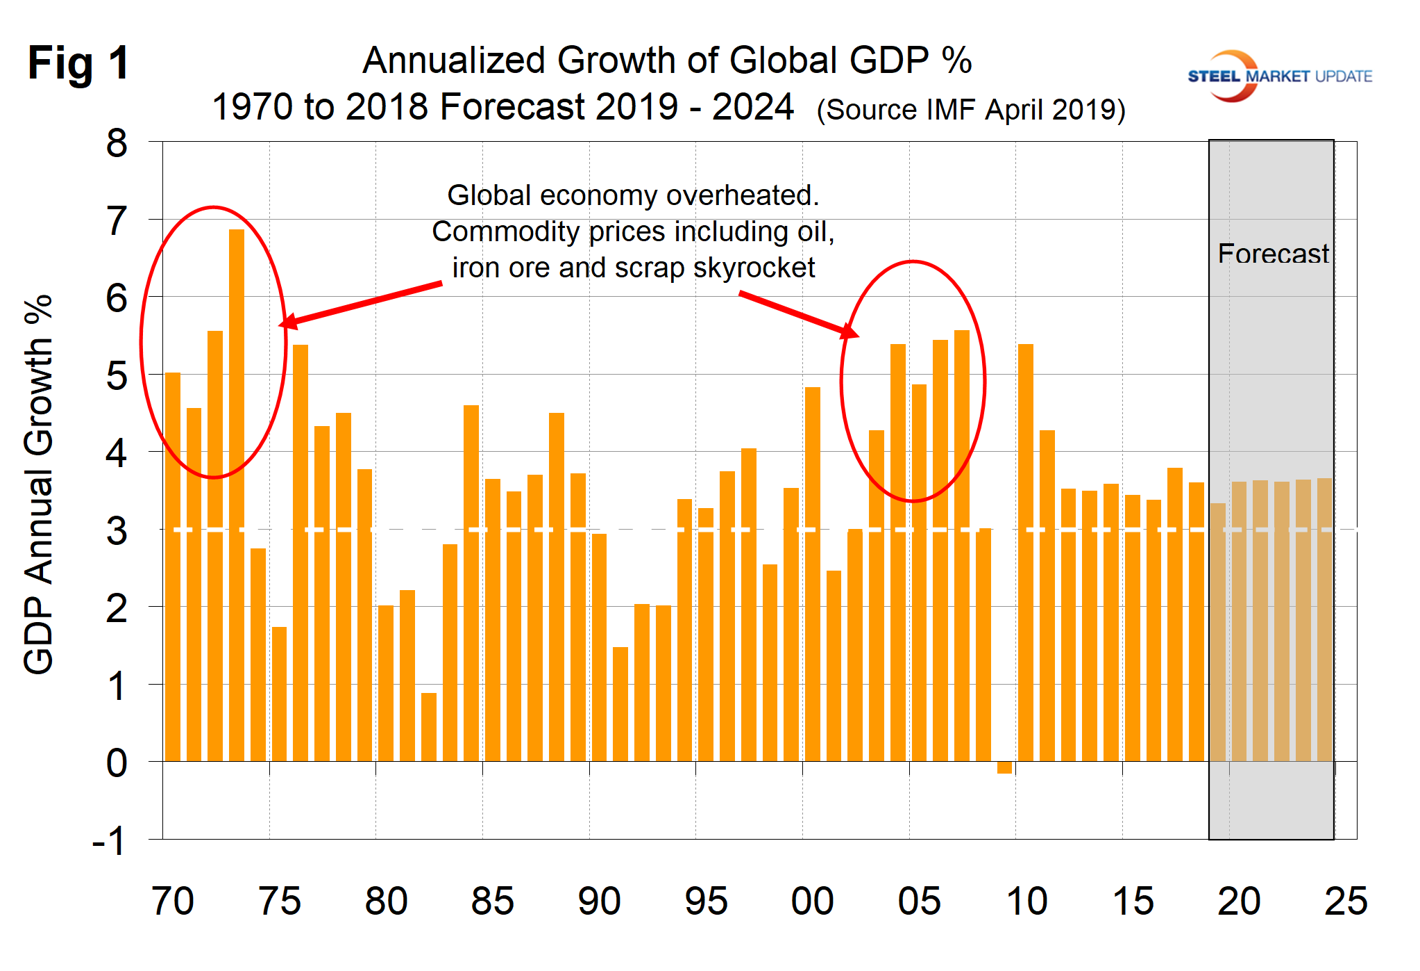
SMU Data Analysis: Figure 1 shows the growth of global GDP since 1970 with this month’s IMF forecast through 2024. We have highlighted the periods of the early 1970s and the mid-2000s when the commodity bubbles prevalent at those times were driven by unusually high and sustained global growth. The collapse of the commodity bubble in the last decade coincided with the U.S. banking and housing crisis, setting up the perfect storm. After the rebound in 2010, global growth declined through 2016 and is now forecast to expand at 3.3 percent this year and then stabilize at 3.6 percent through 2024.
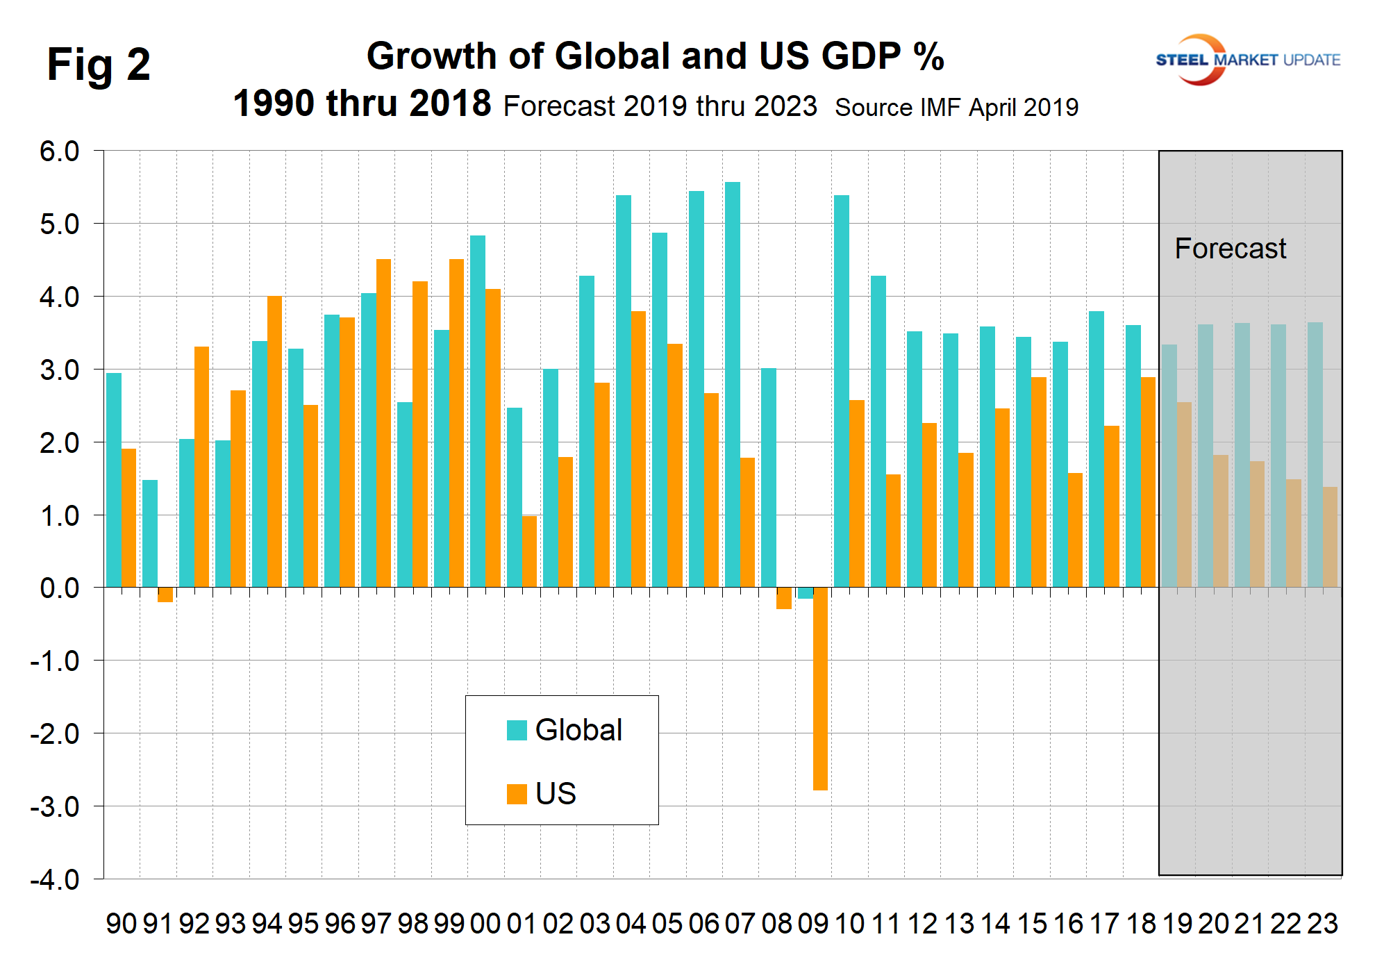
Prior to the 2001 recession, the U.S. held its own in the economic growth stakes, but between 2001 and 2008 growth in the U.S. averaged 1.84 percent less per year than the growth of the global economy as a whole (Figure 2). In the years 2011 through 2018, the gap narrowed to 0.74 percent. The difference is forecast to widen to 2.09 percent in 2024.
With the exception of 2016, the U.S. has outperformed the Eurozone since 2010 and in the April forecast will continue that trend though 2021 (Figure 3).
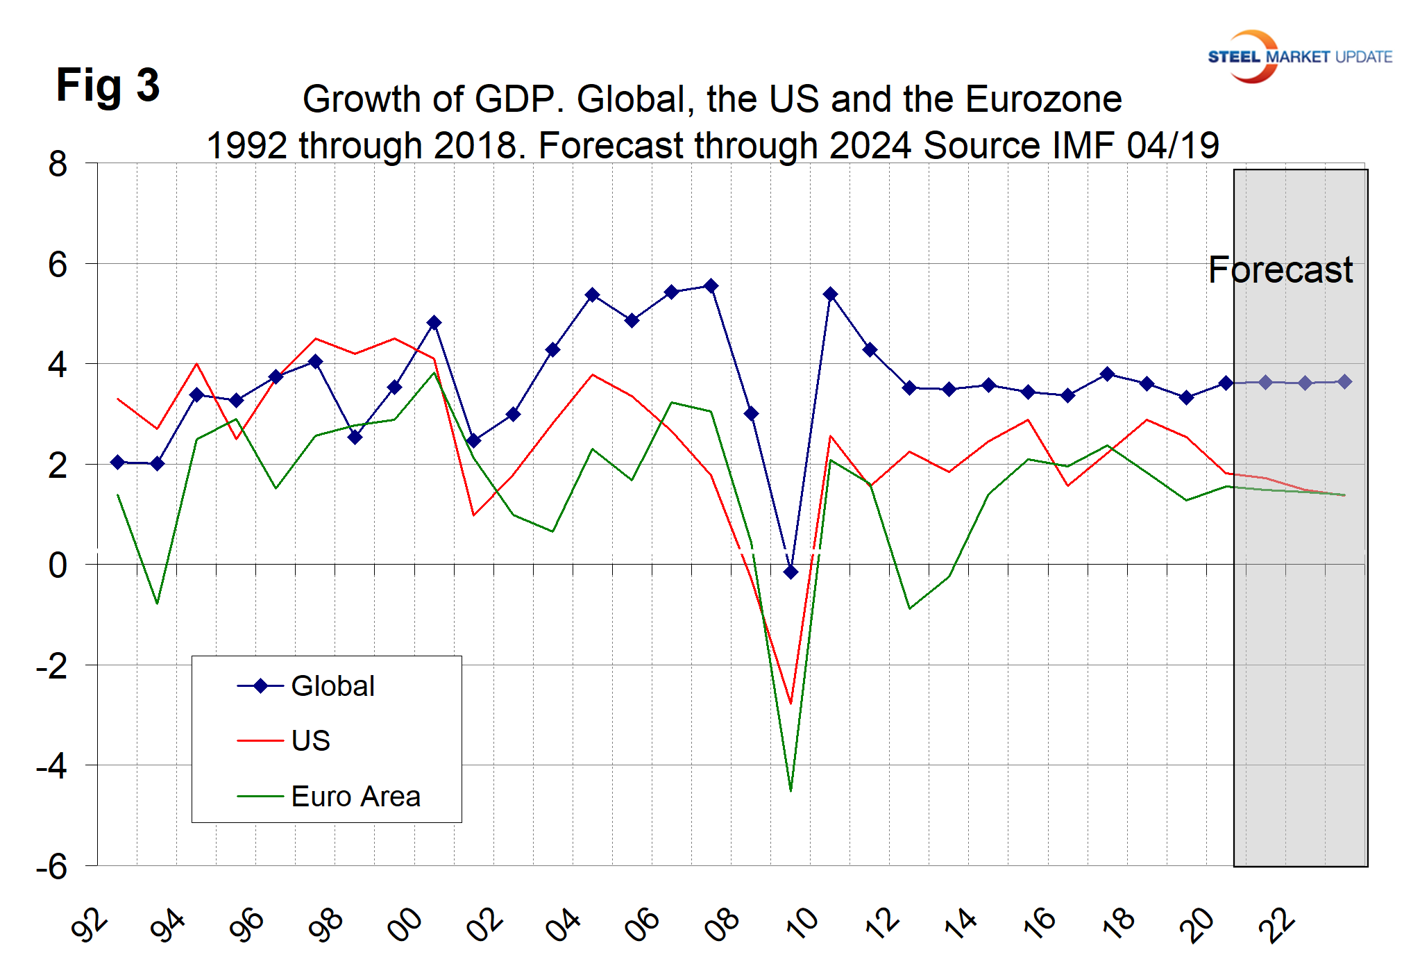
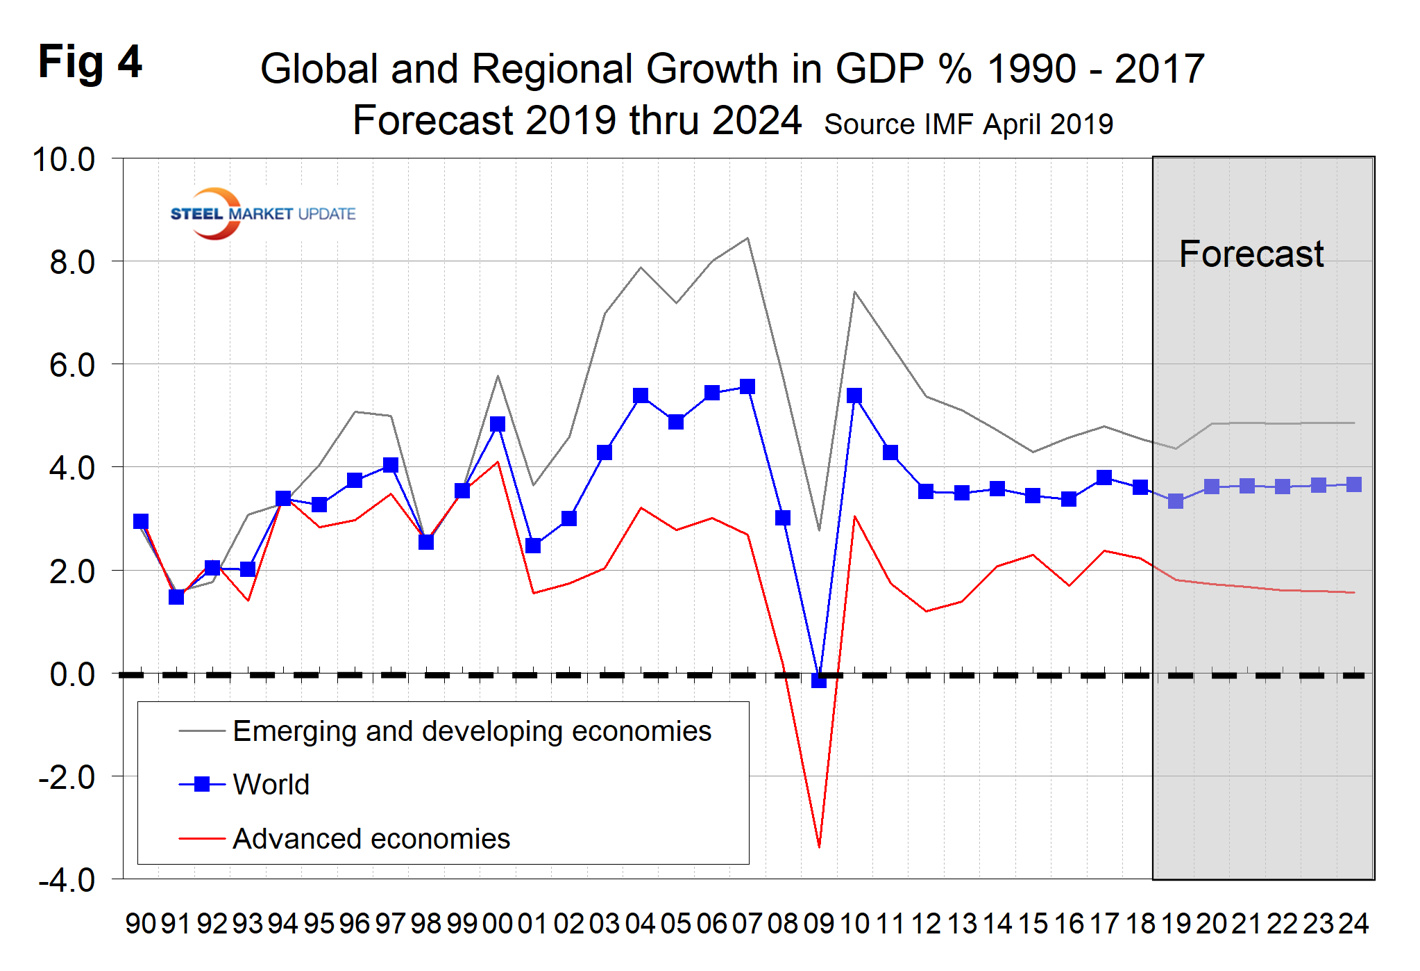
Figure 4 shows the growth comparison between emerging and developing economies and the advanced economies. The gap is projected to widen through 2024.
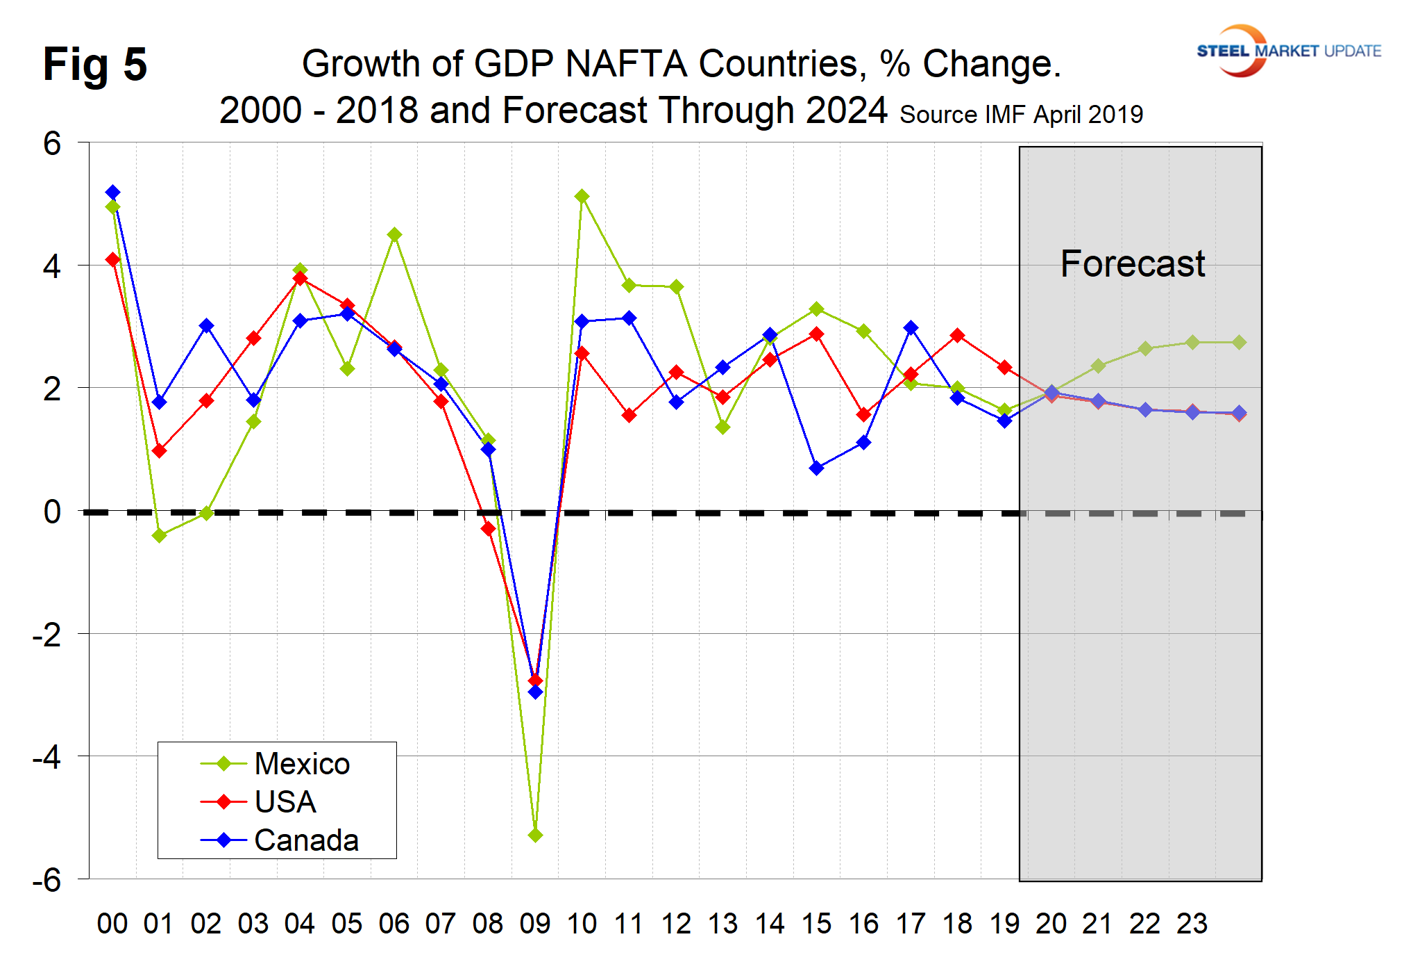
Within NAFTA, the U.S. had the highest growth rate in 2018, which is forecast to continue through 2019. In 2020, the three countries are forecast to have equal growth, then in 2021 Mexico will regain the lead and hold it through 2024 (Figure 5).
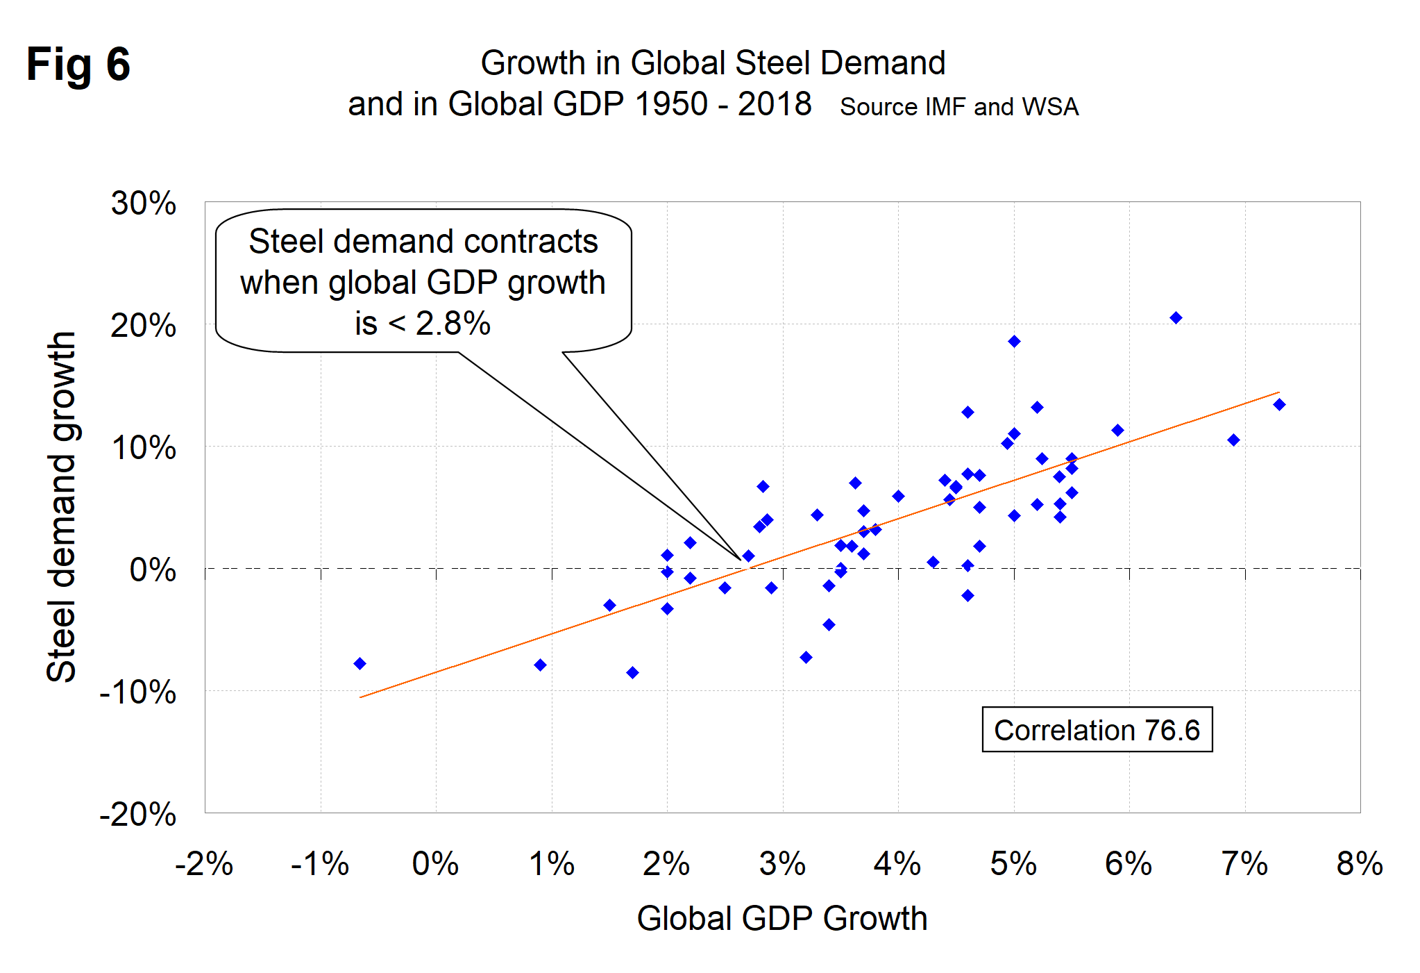
There is a relationship between the growth of GDP and steel demand at both the international and national levels, which also extends to other commodities such as cement. There are two interesting aspects to this relationship. First, the cyclical change in steel demand is vastly more volatile than the change in GDP, which we attribute to manufacturing industries in general being more fragile than service industries, and the inventory response throughout the steel supply chain causes a snowball effect. Second, as discovered by our friends at “Steel Guru,” 1 percent growth in GDP does not result in 1 percent growth in steel demand. At the global level it takes a 2.8 percent increase in GDP to get any increase in steel demand (Figure 6). This is a long-term average over a period of 65 years and based on the added volatility of steel can be a predictor of the immediate future. For example, after the disastrous decline in steel demand in 2009, there was no doubt that a huge cyclical rebound would occur as inventory managers throughout the world began to react to the economic recovery. If the IMF forecast proves to be correct, then the growth in global steel demand will average around 3 percent annually through 2024.
In the U.S. steel market, it requires about 2.2 percent growth in GDP to generate growth in steel demand. Therefore, if current forecasts are accurate, we can expect a growth of steel demand this year, then a decline through 2024.


