Market Data

April 11, 2019
CRU: China Stimulus 2018-19--Less Positive for Commodities Demand
Written by Tim Triplett
By CRU Chief Economist Jumana Saleheen
The market had hoped that China would unveil a large stimulus package at the March NPC, but any expectation of a large boost to world growth and commodities demand has not come, yet. The current stimulus package is smaller, less potent and less positive for commodities demand than previous episodes of stimulus. This is because two-thirds of the stimulus comes via tax cuts, and one-third from direct government spending. Tax cuts give companies money, which they may save, and will not translate into metals demand.
In March 2019, the National People’s Congress (NPC) set out its annual plans for China’s economic and fiscal policy. The meeting was closely watched, given growing concerns that the U.S.-China trade war has sparked an economic slowdown in China.
Most of CRU’s clients who responded to our annual economic survey said that a large stimulus package from China would be the most likely source of upside to global growth. This strategy was highly successful in propping up growth in China and the world more broadly following the Global Financial Crisis (GFC).
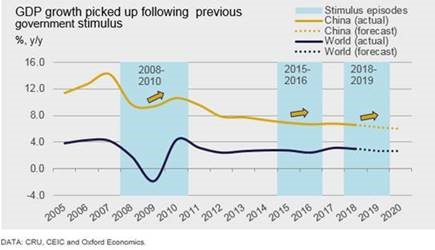
This Special Feature sets out our assessment of the latest stimulus package. Relative to past episodes, we judge it is: smaller in size (as a share of GDP); less potent for the macro economy in the short term (it has a larger share of tax cuts); and less positive for metals demand.
This modest stimulus is warranted given that the recent growth slowdown has been small. It is consistent with the authorities’ ambition for long-term growth that is sustainable from an environmental and financial stability perspective.
The Current Episode of Stimulus is Smaller Than the Past
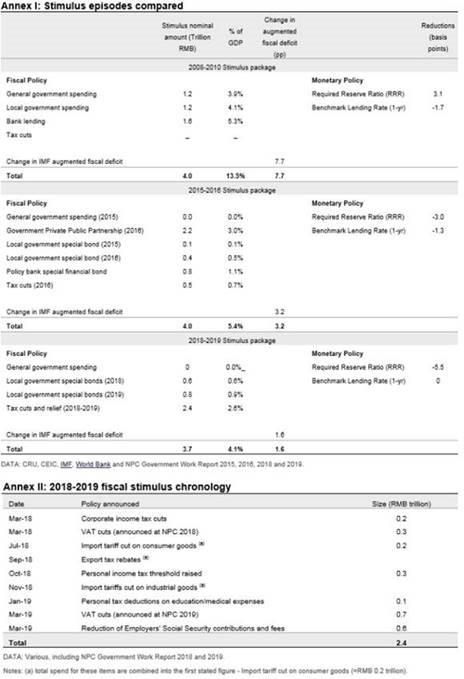
As the U.S.-China trade war unfolded in 2018, China announced a range of easing policies (for a comprehensive list see Annex II). Additional stimulus measures were announced at the NPC in March 2019. Two elements of the newly announced stimulus are worth noting:
• A higher local government special bond quota – up by RMB800 billion. This will enable the funding of additional infrastructure projects.
• Manufacturing sector VAT tax cuts of 3 percentage points, with a 1 percentage point cut in the construction and transport sectors. We estimate that this will lower corporate costs by RMB650 billion.
• The NPC’s headline stimulus figures include easing measures that were announced last year. That makes it hard to cleanly isolate the new stimulus from the old – the 2018 stimulus. We estimate that the new stimulus is around RMB2.1 trillion, and the total stimulus over 2018-19 is larger at RMB3.7 trillion. This is slightly smaller in absolute (nominal) value compared to earlier episodes. (see Annex I and II for additional details).
• The chart below shows two different gauges of fiscal easing. On both, the total size of the fiscal stimulus announced in 2018-19 is smaller than the previous two episodes.
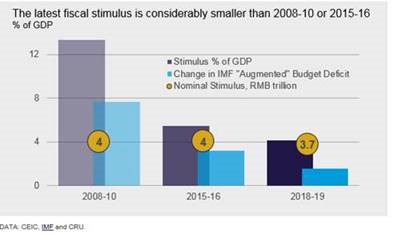
The first measure shows the value of stimulus as a share of GDP. During the 2008 GFC, China unleashed a large stimulus worth RMB4 trillion, or 13.5 percent of GDP. In 2015, the authorities also injected stimulus into the economy, but it was smaller than in 2008. The stimulus announced in 2018-19 is smaller in absolute value and as a share of GDP.
The second measure captures changes to an augmented measure of the government budget deficit. This takes the official deficit and adjusts it to include all off-budget funding – including local government financial vehicles and special bonds – which we know are heavily used in China. A rise in the budget deficit signals fiscal expansion.
The IMF calculated that during the GFC, the augmented fiscal deficit rose by nearly 8 percentage points. The rise was smaller at 3 percentage points in 2015-16, and CRU expects it to rise by 1-2 percentage points over the period 2018-19.
It is no surprise that the stimulus packages have become smaller over time. China, like most policy makers around the world, understood that there were risks that the large stimulus and ultra-loose monetary policy unleashed during the GFC may have medium-term unintended consequences. But, around the globe, the alternative was a catastrophic collapse in economic output and international trade. In China, the unintended consequences include an explosion of credit, with total non-financial sector debt rising to 253 percent of GDP in 2018.
The Current Stimulus is Less Potent (More T, Less G)
Economic theory explains that the mix of fiscal policy—whether it comes via a change in government spending or a change in taxes—matters. The chart below shows that the latest episode of stimulus has a much larger share of tax cuts relative to the other episodes. We argue that this form of stimulus is less potent for the macro economy.
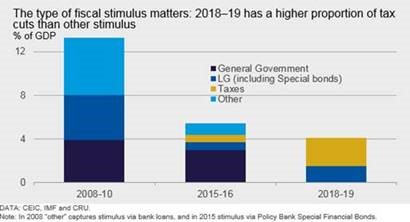
When fiscal stimulus comes via government spending (“G”), it tends to have a bigger impact on growth than if the stimulus came via an equivalent cut in taxation (“T”). This is because if the government spent an extra RMB1 trillion to build additional roads and towns, all those funds will be spent in raising the employment of construction workers and increasing the demand for steel and copper. On the other hand, tax cuts of RMB1 trillion will put that money in the hands of a company or a consumer, who will then have the choice of how much to save and how much to spend. The share that is spent will benefit the economy in the form of additional demand, but the share that is saved will not benefit demand; economists call this a “leakage.” As a result, stimulus in the form of tax cuts typically has a smaller impact on growth than government spending. That said, the precise impact of both government spending and tax cuts on the economy (the fiscal multipliers) is uncertain, because it can change over time and depends on the state of the economy.
The 2019 VAT cuts reduce the costs faced by corporates. They give companies the choice of how to spend their savings. In very competitive sectors, the cost saving could be passed on to consumers in the form of lower prices. This is likely to lead to a rise in the demand for goods and the metal inputs (the precise rise will depend on the price elasticity of demand). In less competitive sectors, companies may choose to absorb the VAT cost reductions into profits, particularly if corporate profitability has been under strain.
Use of tax cuts rather than government spending is consistent with China’s goal to transition to a more balanced growth model – away from investment-led growth to greater consumer spending. And an economy where market forces and prices—the invisible hand—plays a greater role in determining the allocation of resources.
The Current Episode of Stimulus is Less Metals Friendly
How positive the stimulus is for metals demand depends on the size of the stimulus, the form in which it is delivered (T vs. G), and the sectors that benefit from the easing. The current episode of stimulus is less positive for metals demand than the past on all three counts: it is smaller; delivered through VAT cuts, which have a higher degree of leakage; and targets less metal-intensive sectors of the economy.
The 2008 stimulus package was skewed towards large scale construction and infrastructure projects, including buildings, railways, roads and power and water distribution grids. The breakdown below shows that over 80 percent of the 2008 stimulus package was allocated to infrastructure, reconstruction and housing – all of which are metal intensive. Half of final steel demand, and 25-30 percent of aluminum and copper demand, come from these sectors.
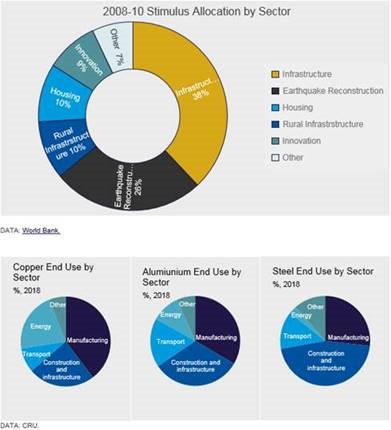
The 2015-16 stimulus episode brought with it a large rise in local government financing, which benefitted construction and infrastructure. Another high-profile part of this package was the car sales tax cut, which profited transport and aluminum and steel demand; annual car sales growth rose from 7 percent in 2015 to 15 percent in 2016.
The 2018-19 stimulus is going to be mildly positive for metals demand. Partly because the largest VAT cuts are in manufacturing, which accounts for 25-40 percent of metal demand, and partly because the higher quota for local government special bond issuance will raise metals demand in construction and infrastructure. We have revised up our outlook for construction sector output growth by 0.2 pp to 3.8 percent in 2019.
Monetary Policy: Conservative So Far, More Firepower Exists
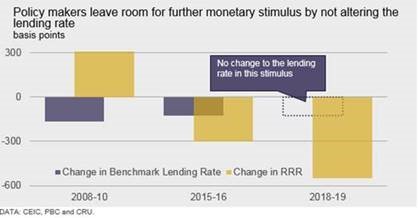
The People’s Bank of China (PBC) has at its disposal several monetary policy tools that it can use to encourage consumers and firms to borrow. The chart shows two such measures.
The first is the Required Reserve Ratio (RRR). It measures the amount of funds that a bank needs to hold with the central bank. When this rate is cut, banks need to hold less with the central bank as a proportion to loans and so banks can lend more to households and companies. The second is the Benchmark Lending Rate (1-year), the rate at which banks can lend to the private sector. A cut in this rate makes borrowing cheaper.
In 2018-19, all the monetary easing has come via RRR cuts, with no changes to the benchmark lending rate. Crucially, we interpret this as the PBC’s continued efforts to control credit growth, deleverage and support financial stability.
China Stimulus Will Not Support Global Commodity Demand
China’s economy has been slowing for a decade. A slowing that is consistent with the government’s goal of long-term sustainable growth – CRU has referred to this as “a policy-led managed slowdown.” The stimulus announced in 2018-19 is smaller than previous episodes, but it is appropriate given the smaller magnitude of the current economic deceleration in China.
The current stimulus will not provide substantial support to global commodity demand growth because the stimulus is smaller, but more importantly because most of the stimulus (two-thirds) comes in the form of tax cuts. In contrast, in 2008 and 2015, two-thirds came in the form of direct government spending. Tax cuts are a more indirect form of stimulus, which puts money in the pockets of households and companies, some of which will inevitably be saved, and therefore will not translate into metals demand.
Beijing has further policy space to stimulate the economy, should it be required. But it will only use it if growth falls below 6 percent—the minimum growth threshold we judge is required to honor the governments’ pledge to the people to double GDP between 2010 and 2020. For now, we do not expect growth to dip that low.
