Market Data

March 12, 2019
BLS: Employment by Industry for February
Written by Peter Wright
Construction employment was promoted by good weather in January with a reversal in February, according to the latest Bureau of Labor Statistics data.
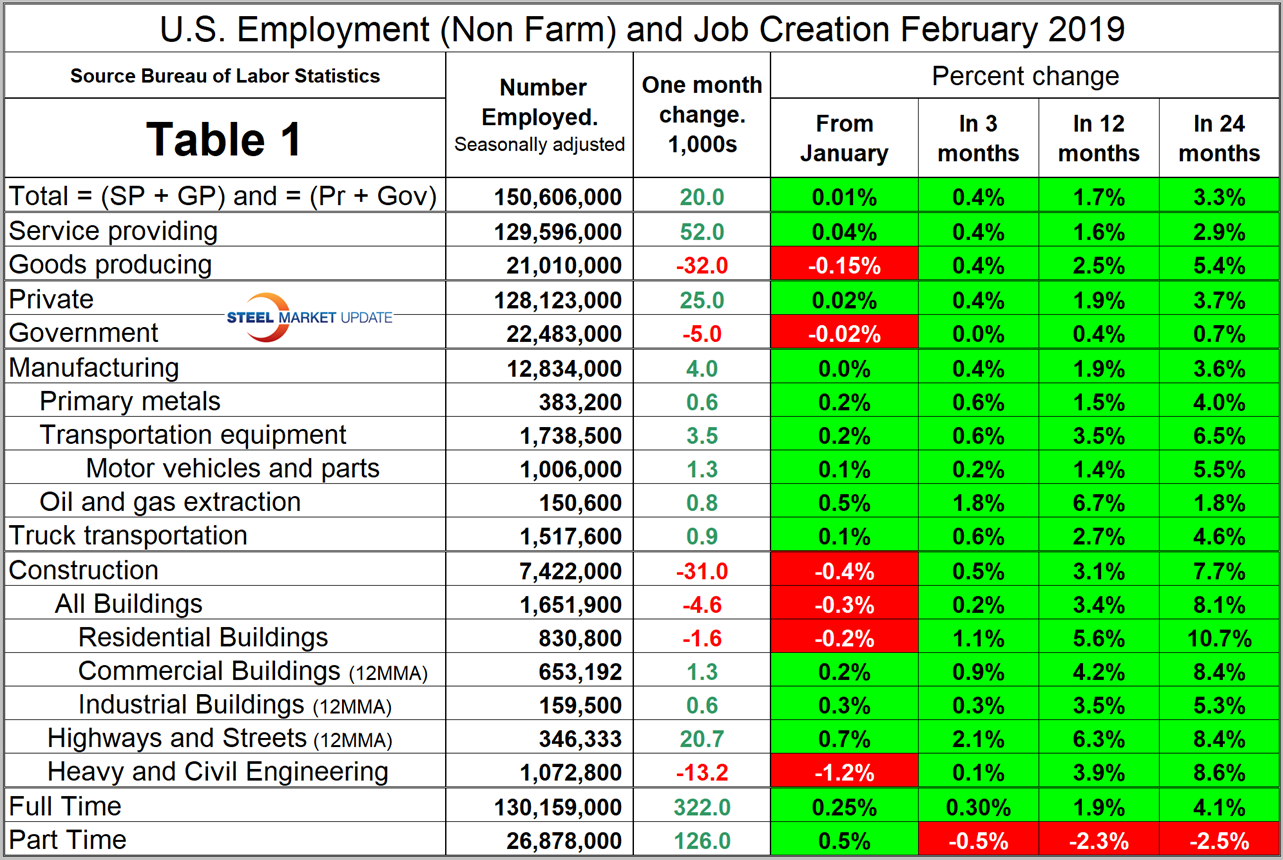
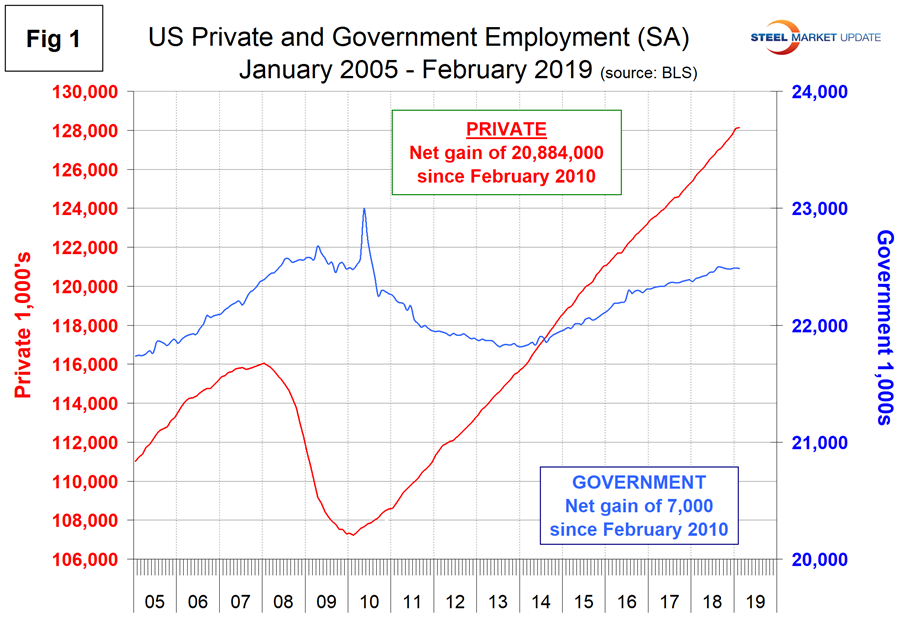
In February, 25,000 jobs were created in the private sector and government lost 5,000. Table 1 breaks total employment down into service and goods-producing industries and then into private and government employees. Most of the goods-producing employees work in manufacturing and construction, and the components of these two sectors of most relevance to steel people are broken out in Table 1.
In February, the number employed by the federal government was unchanged. State governments lost 1,000 and the local level lost 4,000. Since February 2010, the low point of total nonfarm payrolls, private employers have added 20,884,000 jobs as government has gained 7,000 (Figure 1).
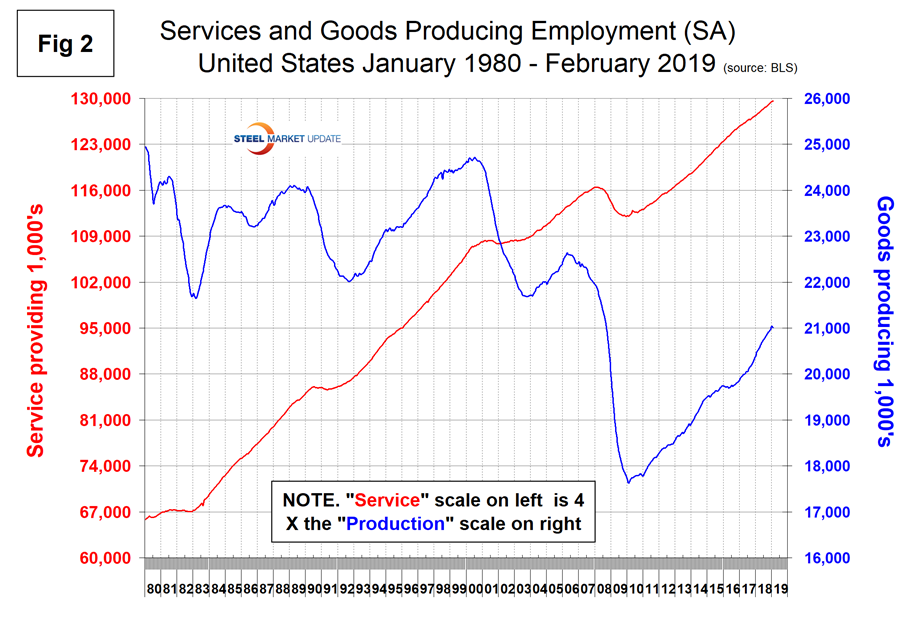
In February, service industries expanded by 52,000 as goods-producing industries, driven mainly by construction and manufacturing, lost 32,000 jobs (Figure 2). Since February 2010, service industries have added 17,508,000 and goods-producing 3,383,000 positions. This has been a drag on wage growth since the recession as service industries on average pay less than goods-producing industries such as manufacturing. The good news is that in the last 24 months the rate of job creation in goods-producing industries on a percentage basis has been half as much again as in service industries.
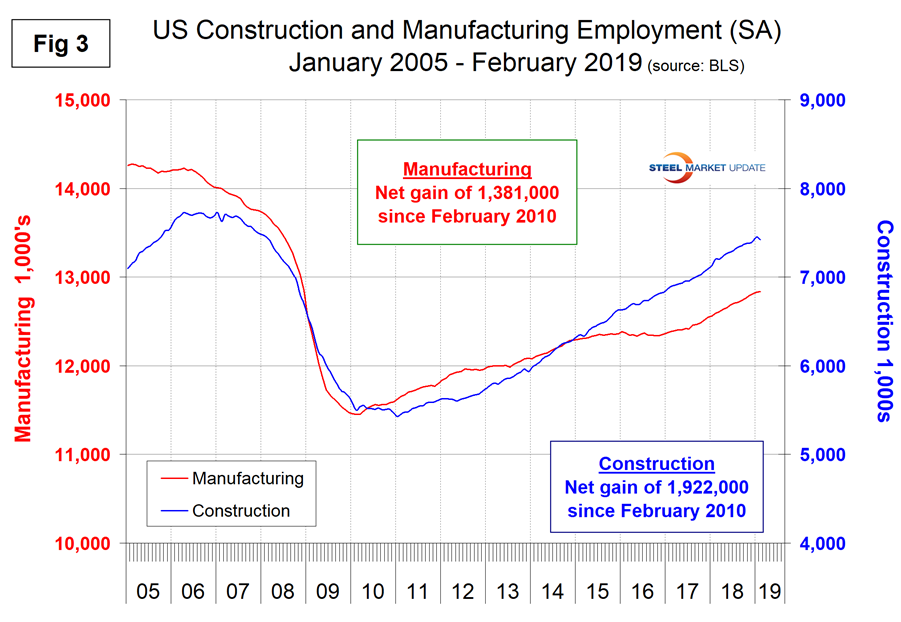
Construction was reported to have lost 32,000 jobs in February; the total gain was 319,000 in 2018 and 53,000 in January. The latest change was probably weather related. The Associated General Contractors of America expects most contractors to continue hiring in 2019, but these companies are having difficulty finding qualified workers. The number of unemployed workers who have construction experience is at the lowest February level in 19 years.
Manufacturing is trailing construction as a job creator, but did better in February. Manufacturing gained 4,000 jobs in February after a gain of 264,000 in 2018 and 21,000 in January. Figure 3 shows the history of construction and manufacturing employment since February 2005. Construction has added 1,922,000 jobs and manufacturing 1,381,000 since the recessionary employment low point in February 2010.
Note, the subcomponents of both manufacturing and construction shown in Table 1 don’t add up to the total because we have only included those with the most relevance to the steel industry.
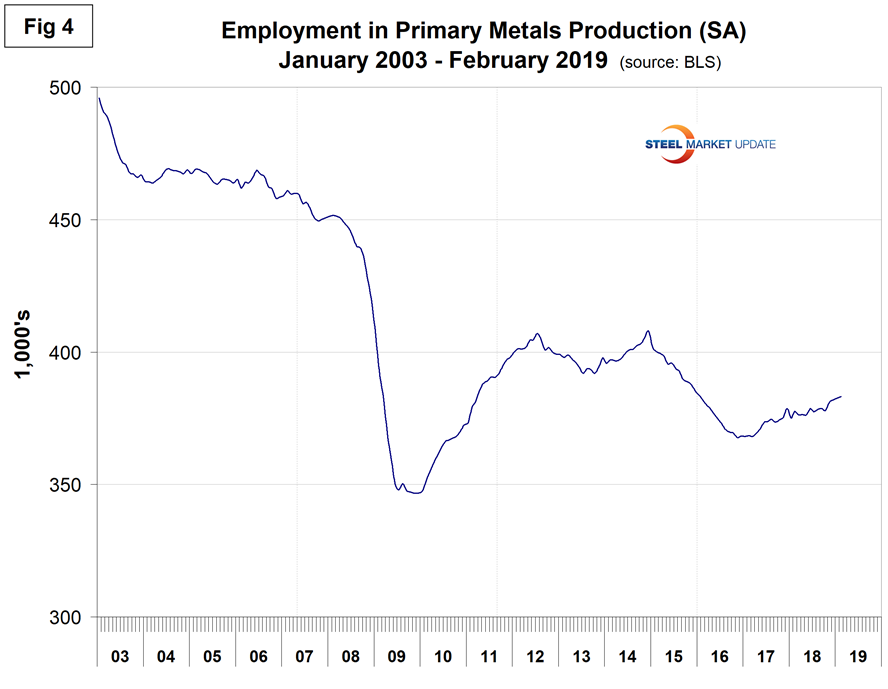
Table 1 shows that primary metals gained 600 jobs in February, and in the last 24 months, gains on a percentage basis were a little better than for total manufacturing. Figure 4 shows the history of primary metals employment since February 2003.
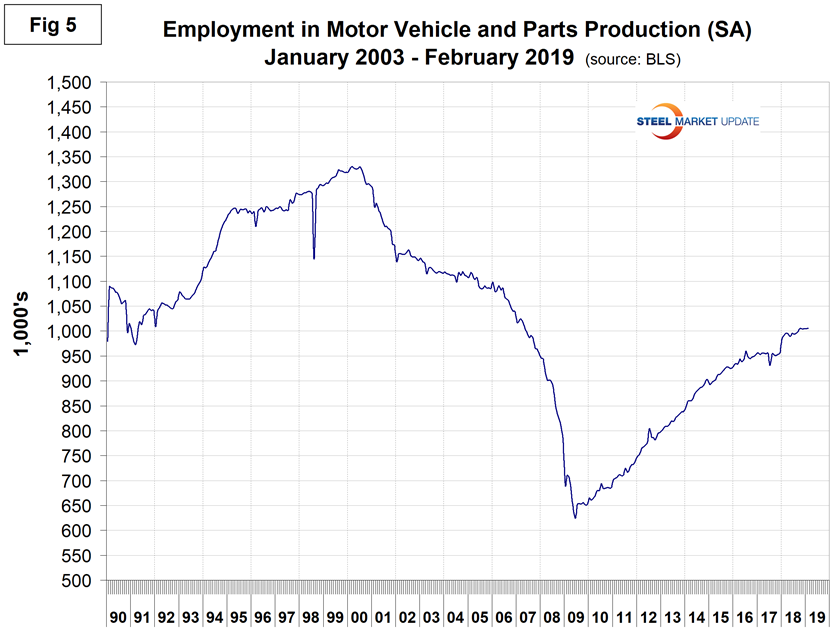
Motor vehicles and parts industries were reported to have gained 1,300 jobs in February after gaining 3,300 last year and 600 in January. Figure 5 shows the history of motor vehicles and parts employment.
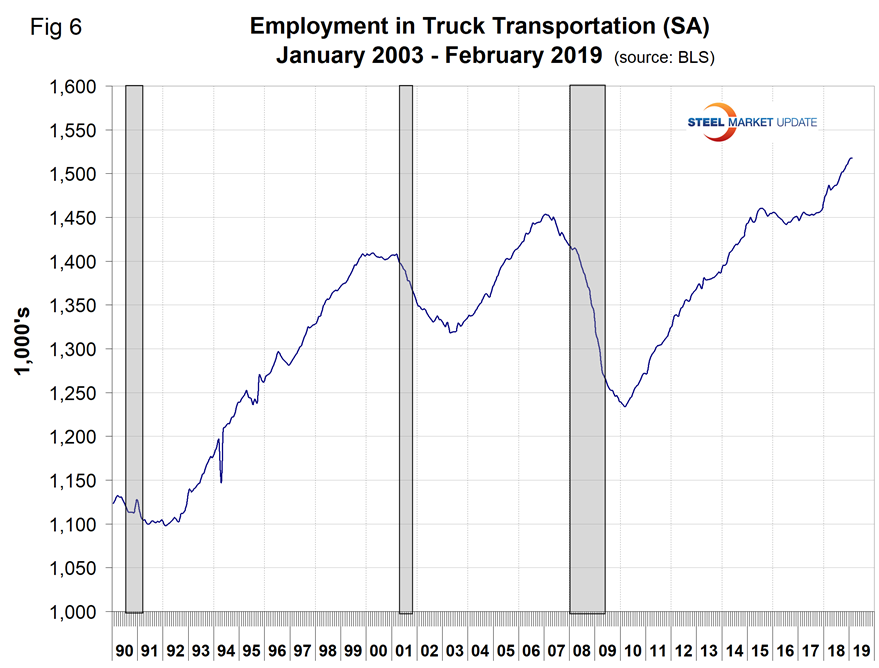
Trucking gained 900 jobs in February, 5,100 in January and 51,300 last year. Employment in truck driving is one of SMU’s recession monitors and Figure 6 suggests that at the present time the economy is still on a roll.
We don’t normally cover employment in retail sales in this report, but this month will make an exception. This industry is undergoing a massive transformation that will increasingly affect the neighborhoods in which most of us live and is a precursor of what will happen to our own businesses in the future. On May 3, equities analyst Wolf Richter wrote: “The largest brick-and-mortar retailers in the U.S. don’t disclose what portion of their revenues derive from e-commerce and from their brick-and-mortar stores. They don’t because it would show just to what extent their brick-and-mortar stores are losing revenues even as their own e-commerce revenues are surging with big double-digit gains. Nordstrom is the exception. It started disclosing details on its online sales last year (kudos!). And it’s an eye-opener for what is happening to brick-and-mortar sales – not only at its stores but also in the industry. This shows three things for the full fiscal-year 2018– Total sales: +2.3% Digital sales: +13.6% Brick-and-mortar sales: -1.9%. Retailers that are planning to stick around are spending vast amounts of money building out their online operations and their e-commerce fulfillment infrastructure, including warehouses and delivery operations.”
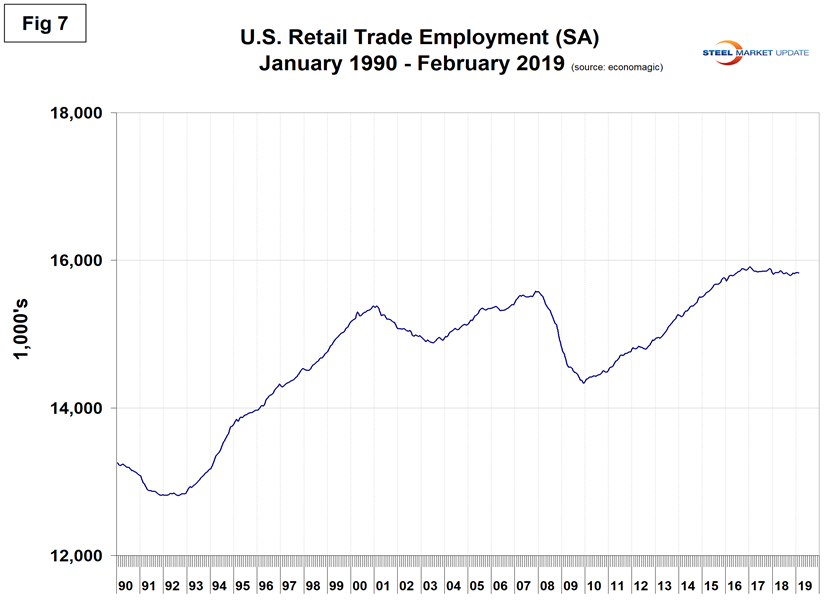
Figure 7 shows total retail employment and a decline of 84,200 since the peak in January 2017. This isn’t declining as fast as Richter’s report suggests, presumably because the BLS report includes e-commerce employees in their total retail number. Our point here is that the retail industry is in the throes of an employment revolution and this is a precursor of what will happen in manufacturing as robotics, 5G and AI pick up steam. An imminent example is truck driving. There is a huge cloud on the horizon for truck drivers, namely autonomous vehicles, which will probably take off in trucks long before it does in automobiles. We can’t imagine where all this will lead us in the next 10 or 20 years. The nature of work is changing faster than at any time since the industrial revolution and our public K-12 education system is floundering. Employers such as you must have a strategy to deal with this mismatch.
SMU Comment: We don’t believe the employment situation is as bad as the low February job creation numbers suggest and expect an upward revision next month. March results are also expected to be depressed by the severe weather around the country. Manufacturing and construction had solid employment gains last year, which bodes well for steel consumption in at least the first half of 2019.
Explanation: On the first or second Friday of each month, the Bureau of Labor Statistics releases the employment data for the previous month. Data is available at www.bls.gov. The BLS employment database is a reality check for other economic data streams such as manufacturing and construction. It is easy to drill down into the BLS database to obtain employment data for many subsectors of the economy. The important point about all these data streams is the direction in which they are headed.


