

Market Data

February 25, 2019
SMU Energy Analysis: Rig Count Declines
Written by Peter Wright
Oil production in the U.S. was at an all-time high in October last year and declined only slightly in the latest data for November. The price of West Texas Intermediate crude oil has recovered somewhat from its recent low of $44.48 on Dec. 27.
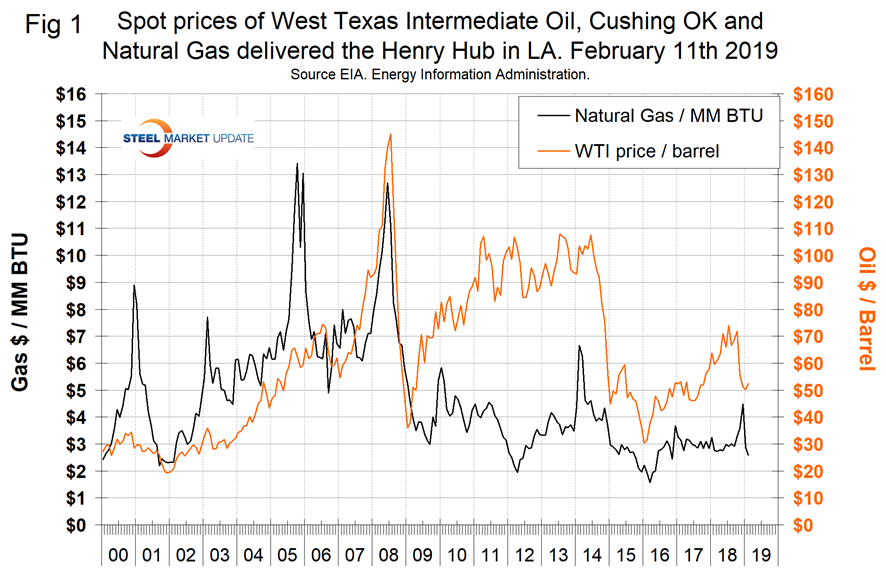
![]() The spot price of West Texas Intermediate (WTI) FOB Cushing, Okla., had a recent peak on Oct. 3 of $76.40/barrel. The price declined to $44.48 on Dec. 27 and had recovered to $52.43 on Feb. 11. The total number of operating rigs exploring for oil has declined by 20 since Jan. 4. The prices of oil and natural gas drive the consumption of energy-related steel products including oil country tubular goods, pipe fittings and well head equipment, among others. Welded tubular goods (not including OCTG) consumed about 5.5 million tons of hot rolled sheet in 2018.
The spot price of West Texas Intermediate (WTI) FOB Cushing, Okla., had a recent peak on Oct. 3 of $76.40/barrel. The price declined to $44.48 on Dec. 27 and had recovered to $52.43 on Feb. 11. The total number of operating rigs exploring for oil has declined by 20 since Jan. 4. The prices of oil and natural gas drive the consumption of energy-related steel products including oil country tubular goods, pipe fittings and well head equipment, among others. Welded tubular goods (not including OCTG) consumed about 5.5 million tons of hot rolled sheet in 2018.
Figure 1 shows historical oil and gas prices from January 2000 through Feb. 11, 2019. Our price and inventory data come from the EIA (Energy Information Administration). On Feb. 11, WTI priced in Cushing was $52.43/barrel and on Feb. 8 natural gas at the Henry Hub in Oklahoma was priced at $2.59/MM BTU.
The EIA released its Annual Energy Outlook 2019 on Jan. 24. Key takeaways were as follows:
- The United States becomes a net energy exporter in 2020 and remains so throughout the projection period as a result of large increases in crude oil, natural gas, and natural gas plant liquids (NGPL) production coupled with slow growth in U.S. energy consumption.
- Of the fossil fuels, natural gas and NGPLs have the highest production growth, and NGPLs account for almost one-third of cumulative U.S. liquids production during the projection period.
- Natural gas prices remain comparatively low during the projection period compared with historical prices, leading to increased use of this fuel across end-use sectors and increased liquefied natural gas exports.
- The power sector experiences a notable shift in fuels used to generate electricity, driven in part by historically low natural gas prices. Increased natural gas-fired electricity generation, larger shares of intermittent renewables, and additional retirements of less economic existing coal and nuclear plants occur during the projection period.
- Increasing energy efficiency across end-use sectors keeps U.S. energy consumption relatively flat, even as the U.S. economy continues to expand.
In its latest short-term outlook on Jan. 15, EIA forecasts Brent prices will average $61 per barrel in 2019 and $65 per barrel in 2020. In 2018, Brent prices averaged $71. EIA expects West Texas Intermediate (WTI) crude oil prices will average $8 per barrel lower than Brent prices in the first quarter of 2019 before the discount gradually falls to $4 per barrel in the fourth quarter of 2019 and throughout 2020. EIA forecasts that Henry Hub natural gas spot prices will average $2.89 per million British thermal units (MMBtu) in 2019 and $2.92/MMBtu in 2020, down from $3.15/MMBtu in 2018. EIA’s forecasts for the average WTI oil and Henry Hub gas prices for December 2019 should be considered in the context of NYMEX futures and option contract values for December 2019 delivery.
On Feb. 15, the EIA reported that U.S. commercial crude oil inventories (excluding those in the Strategic Petroleum Reserve) increased by 3.7 million barrels from the previous week. At 455 million barrels, U.S. crude oil inventories were up by 60 million barrels since Sept. 14. Figure 2 shows the inventory level, including the strategic petroleum reserve and the year-over-year change.
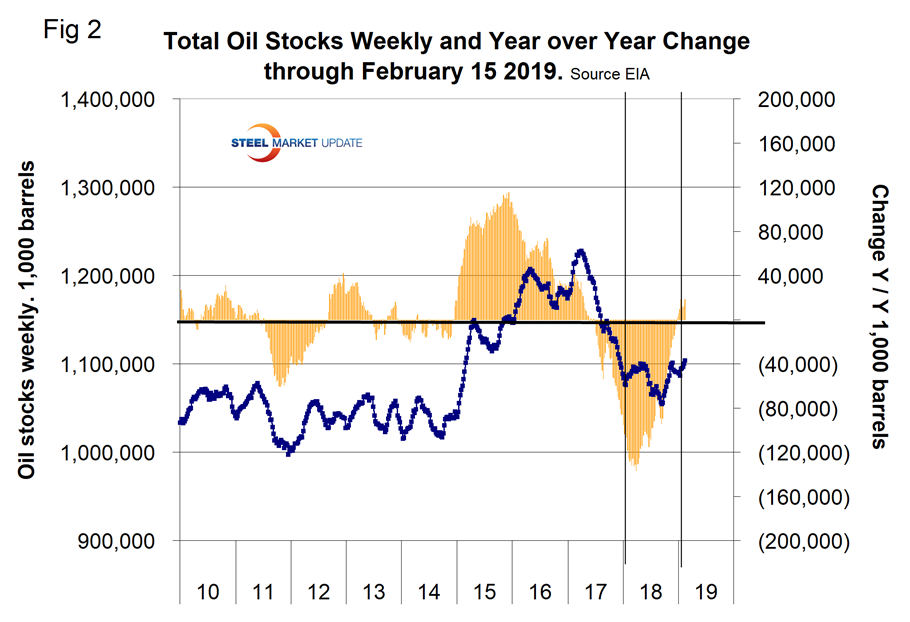
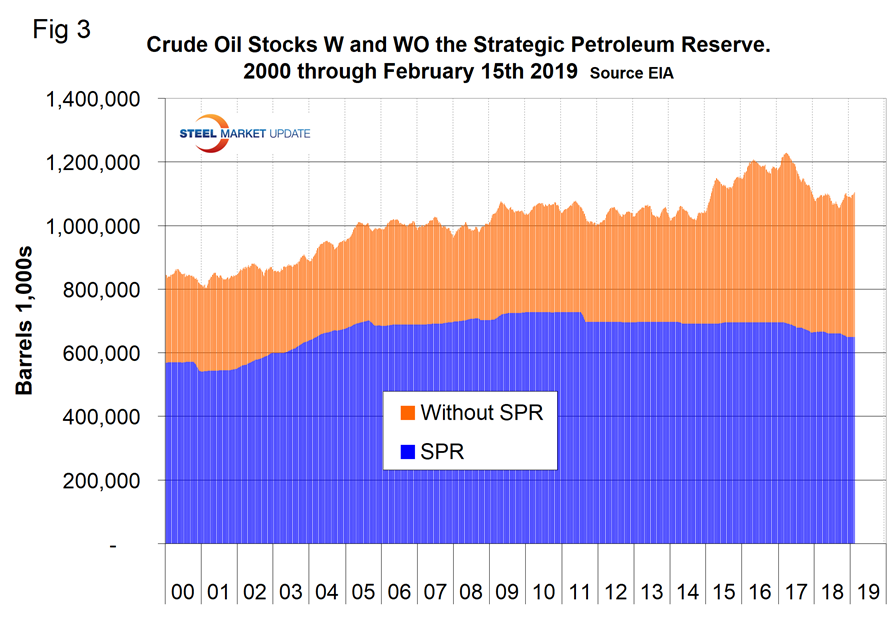
Figure 3 breaks total crude inventory into the working portion and the strategic petroleum reserve.
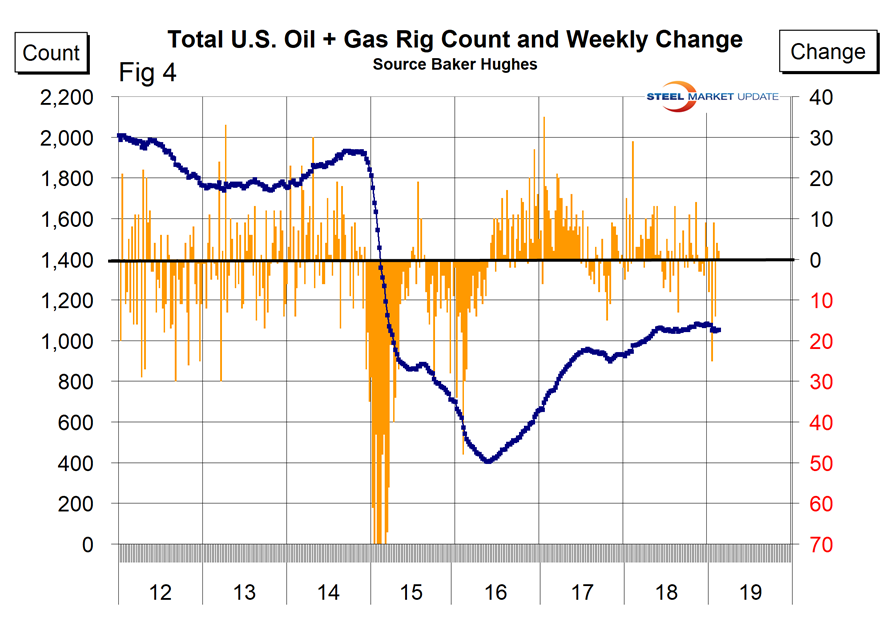
The total number of operating rigs in the U.S. on Feb. 15 was 1,051, which was down by 24 since Jan. 4. Oil rigs were down by 20 and gas by 4. Figure 4 shows the total number of operating rigs in the U.S. and the weekly change.
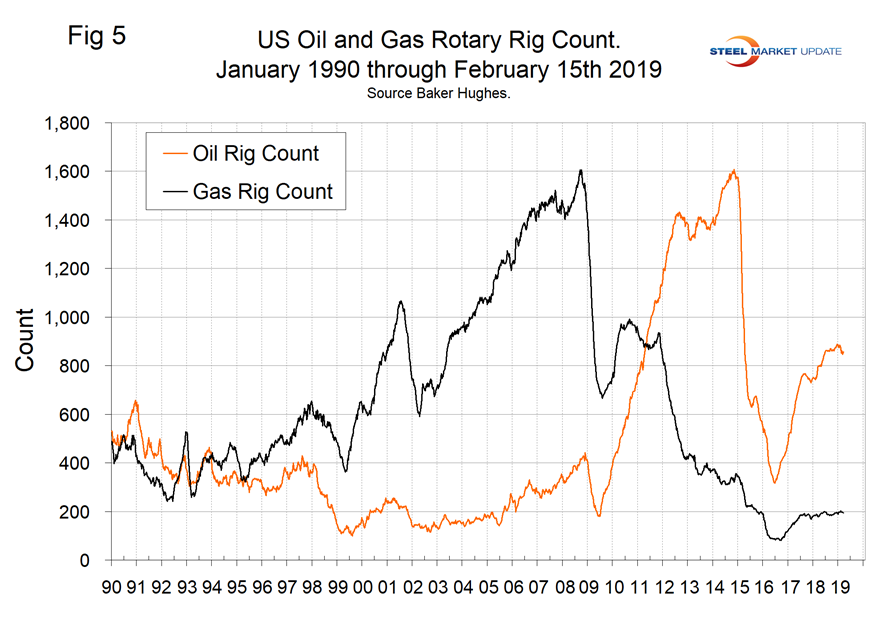
The oil rig count had a low point of 316 on June 27, 2016, and stood at 857 on Feb. 15, 2019. The count has increased by 115 since Jan. 5 last year.
The U.S. gas rig count rose from its low point of 81 on Aug. 5, 2016, to 194 on Feb. 15. The year-over-year growth rate of total U.S. operating rigs was 7.8 percent in the latest data with oil up by 7.4 percent and gas up by 9.6 percent. Figure 5 shows the Baker Hughes U.S. Rotary Rig Counts for oil and gas equipment in the U.S. (explanation below).
On a regional basis in the U.S., the big three states for operating rigs are Texas, Oklahoma and North Dakota. Figure 6 shows the land rig count in those states since 2000.
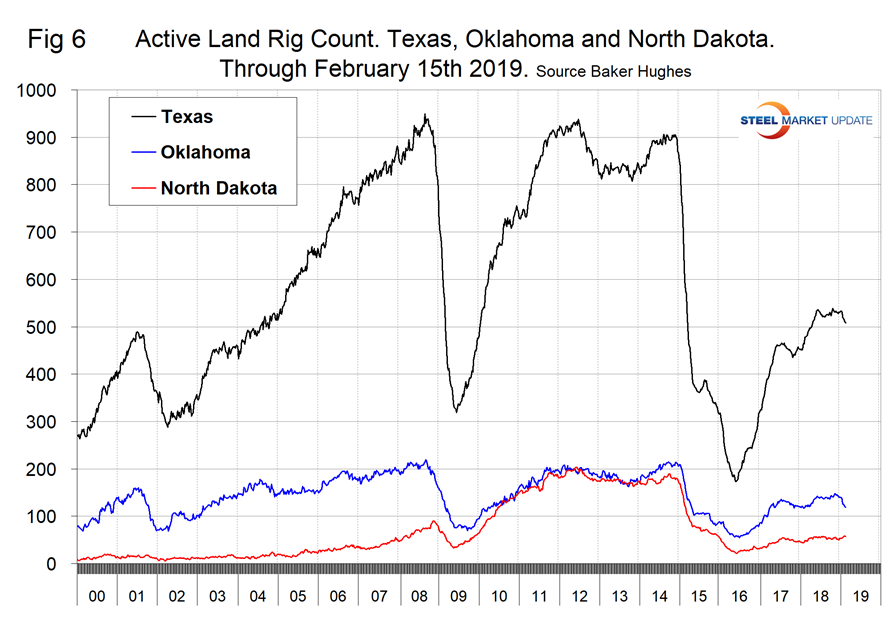
Figure 7 illustrates the monthly U.S. oilfield production of crude from January 1970 through November 2018 (latest data available) in thousands of barrels per month. The historical high was October 1970 at 310.4 million barrels. Production steadily declined to half that level in the late 2000s before the fracking revolution kicked in. December 2017 broke the record that had stood for 47 years with 310.7 million barrels produced and October 2018 set a new record at 358.2 million barrels. November declined slightly to 357.0 million barrels. EIA estimates that U.S. crude oil production averaged 10.9 million barrels per day in 2018, up 1.6 million from 2017, reaching its highest level and seeing its largest volume growth on record. EIA forecasts U.S. crude oil production to average 12.1 million barrels per day in 2019 and 12.9 million in 2020, with most of the growth coming from the Permian region of Texas and New Mexico.
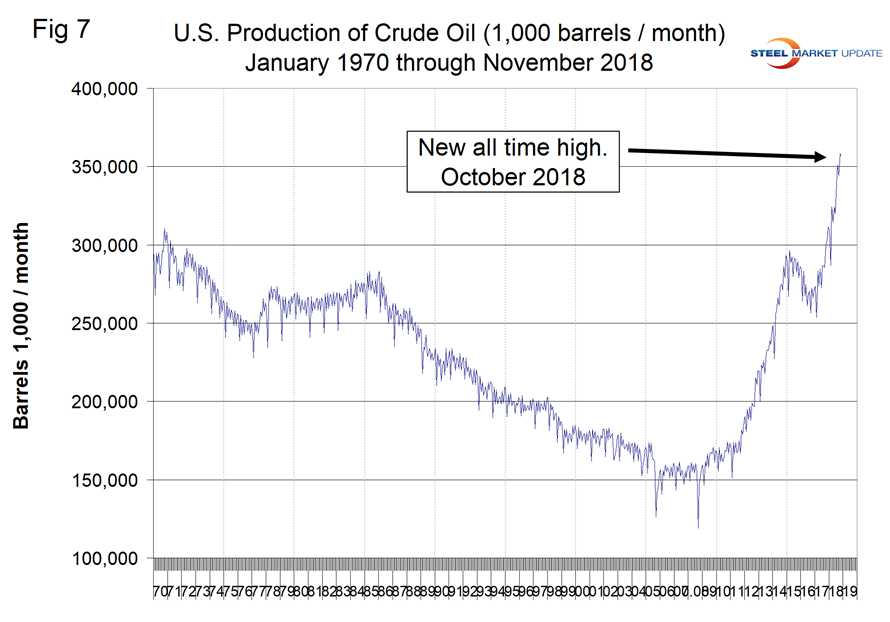
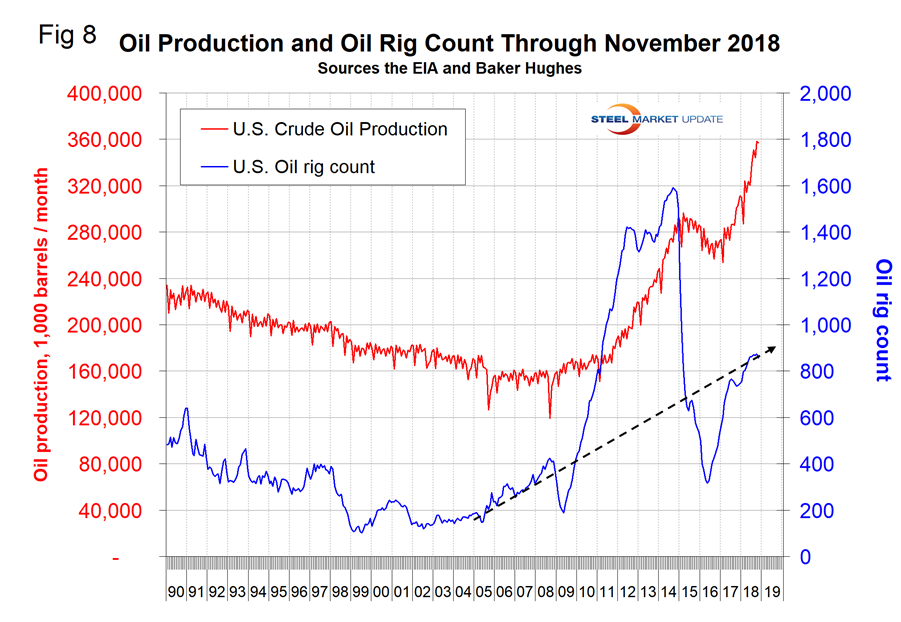
Figure 8 compares oil production and the oil rig count and shows how the increase in exploratory wells drove production from 2009 through late 2014 when the oil price collapsed. The subsequent decline in production was much less marked and is again setting new records. Our take on this is that the huge increase in exploratory oil rigs beginning in 2009 may have been an anomaly and that we won’t see a repeat of the number operating in 2014 for a very long time.
Baker Hughes Rotary Rig Count: This is a weekly census of the number of drilling rigs actively exploring for or developing oil or natural gas in the United States. Rigs are considered active from the time they break ground until the time they reach their target depth and may be establishing a new well or sidetracking an existing one. The Baker Hughes Rotary Rig count includes only those rigs that are significant consumers of oilfield services and supplies.


