Economy

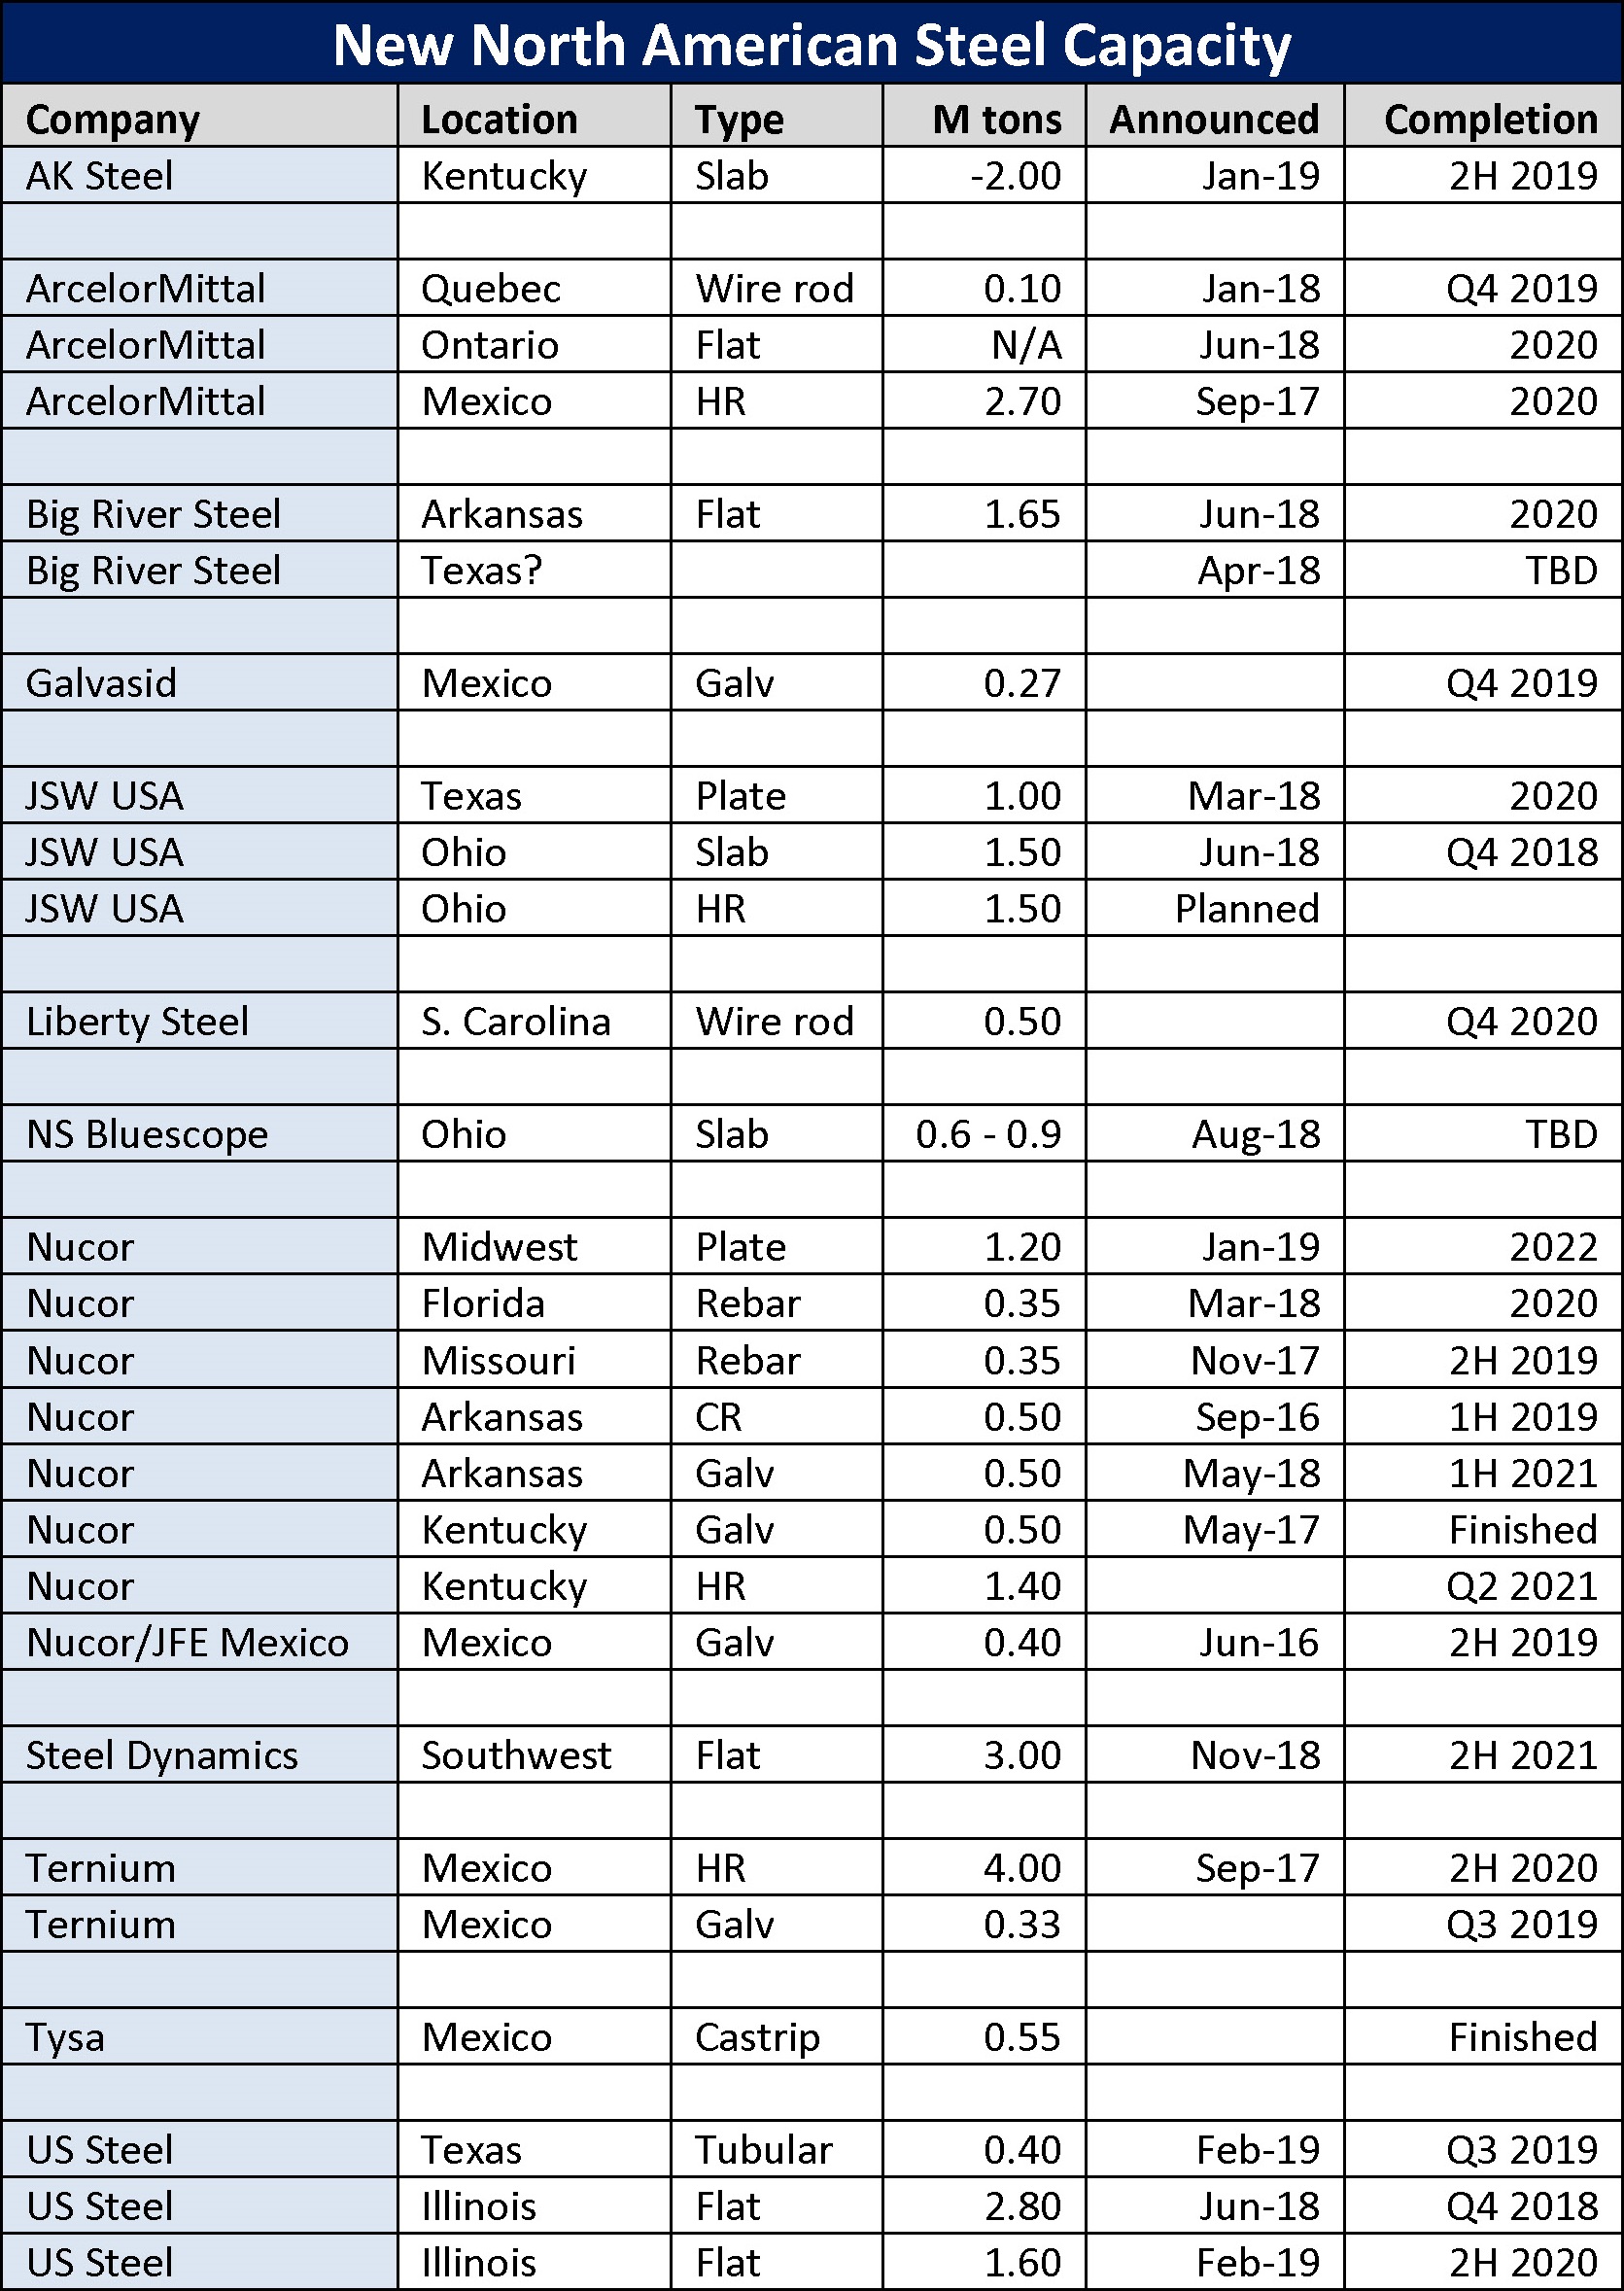
Steel Capacity Chart Revision
Written by Sandy Williams
February 15, 2019
SMU has updated the steel capacity chart that was published on Thursday to reflect new information obtained and to correct some errors regarding tonnage (metric to net tons). Here is the revised chart. If you know of any new steel capacity coming on line, please let us know and we will continue to update the chart (soon to be available in the Analysis section of the SMU website).

Sandy Williams
Read more from Sandy WilliamsLatest in Economy

Architecture billings continue to slide in March
Architecture firms said billings continued to decline in March, according to the latest Architecture Billings Index (ABI) released by the American Institute of Architects (AIA) and Deltek.

Beige Book shows concerns about trade policy
Manufacturing was mixed, but two-thirds of districts said activity was little changed or had declined.

New York state manufacturing index drops again in April
Firms were pessimistic, with the future general business conditions index falling to its second lowest reading in the more than 20-year history of the survey

Construction adds 13,000 jobs in March
The construction sector added 13,000 jobs, seasonally adjusted, in March, but tariffs could undermine the industry.

Supply chains, end-users brace for impact from tariffs
Supply chains are working through what the tariffs mean for them