

Market Data

January 17, 2019
SMU Energy Analysis: Oil Price Sees Small Recovery
Written by Peter Wright
The price of West Texas Intermediate (WTI) crude oil has recovered from its recent low in December. The spot price of WTI FOB Cushing, Okla., recovered to $50.31 on Jan. 14 from its recent low of $44.48 on Dec. 27. WTI had a recent peak on Oct. 3 of $76.40 per barrel. The total number of operating rigs exploring for oil has stalled and is now two less than it was on Nov. 1.
The prices of oil and natural gas drive the consumption of energy-related steel products including oil country tubular goods, pipe fittings and well head equipment, among others. Welded tubular goods (not including OCTG) consumed about 5.5 million tons of hot rolled sheet in 2017.
Figure 1 shows historical oil and gas prices from January 2000 through Jan. 14, 2019. Our price and inventory data come from the EIA (Energy Information Administration). On Jan. 14, WTI priced in Cushing was $50.31 per barrel and on Jan. 11 natural gas at the Henry Hub in Oklahoma was priced at $2.89 per MMBtu.
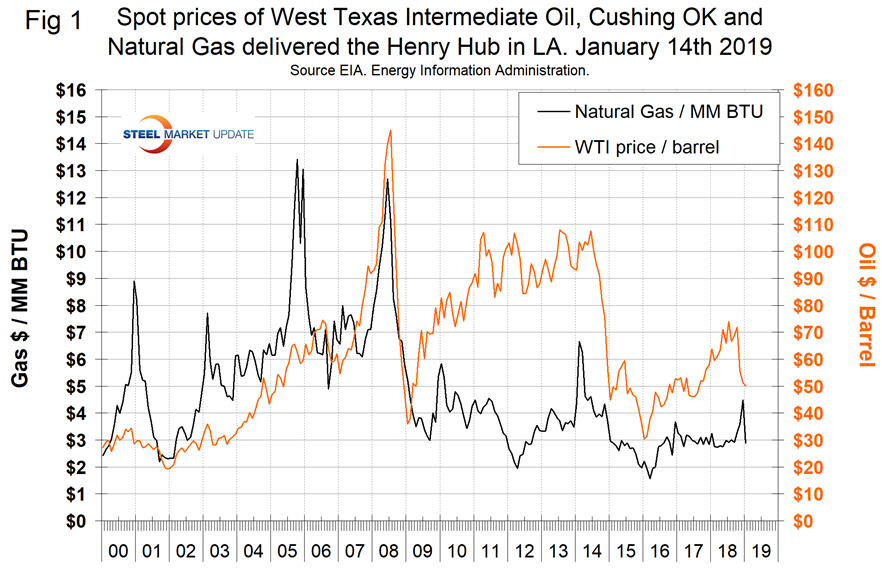
The EIA released its latest short-term outlook on Jan. 15 in which it stated: “EIA forecasts Brent prices will average $61 per barrel (b) in 2019 and $65/b in 2020. In 2018, Brent prices averaged $71/b. EIA expects West Texas Intermediate (WTI) crude oil prices will average $8/b lower than Brent prices in the first quarter of 2019 before the discount gradually falls to $4/b in the fourth quarter of 2019 and throughout 2020. EIA forecasts that Henry Hub natural gas spot prices will average $2.89 per million British thermal units (MMBtu) in 2019 and $2.92/MMBtu in 2020, down from $3.15/MMBtu in 2018. EIA’s forecasts for the average WTI oil and Henry Hub gas prices for December 2019 should be considered in the context of NYMEX futures and option contract values for December 2019 delivery.”
On Jan. 11, the EIA reported that U.S. commercial crude oil inventories (excluding those in the Strategic Petroleum Reserve) decreased by 2.7 million barrels from the previous week. At 437 million barrels, U.S. crude oil inventories were down by 15 million barrels since Nov. 23. Figure 2 shows the inventory level, including the strategic petroleum reserve and the year-over-year change.
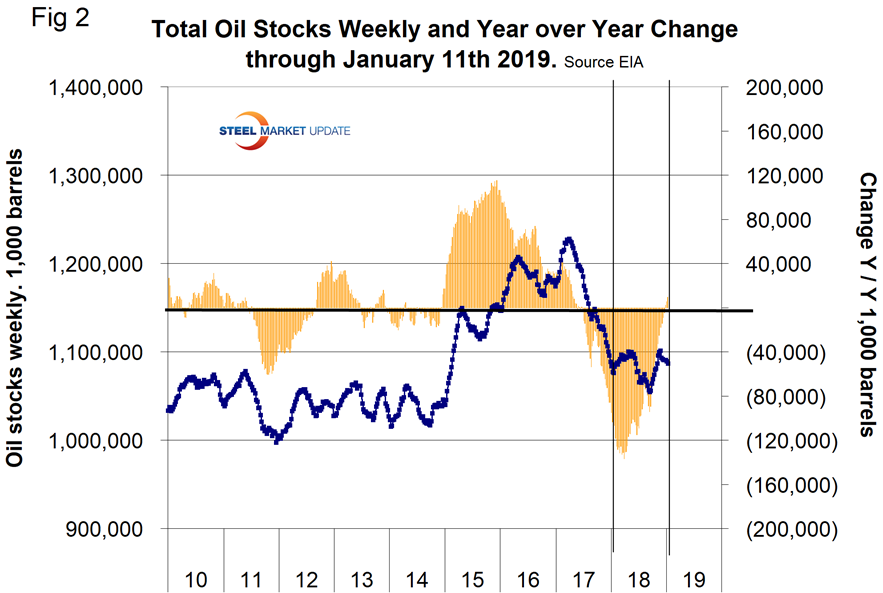
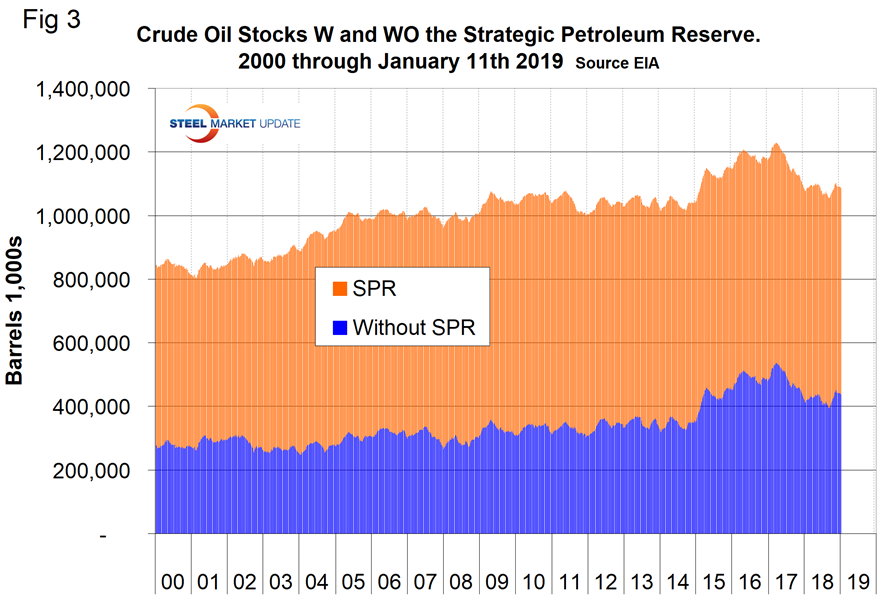
Figure 3 breaks total crude inventory into the working portion and the strategic petroleum reserve.
The total number of operating rigs in the U.S. on Jan. 11 was 1,075 and more or less flat for the previous seven weeks. Figure 4 shows the total number of operating rigs in the U.S. and the weekly change.
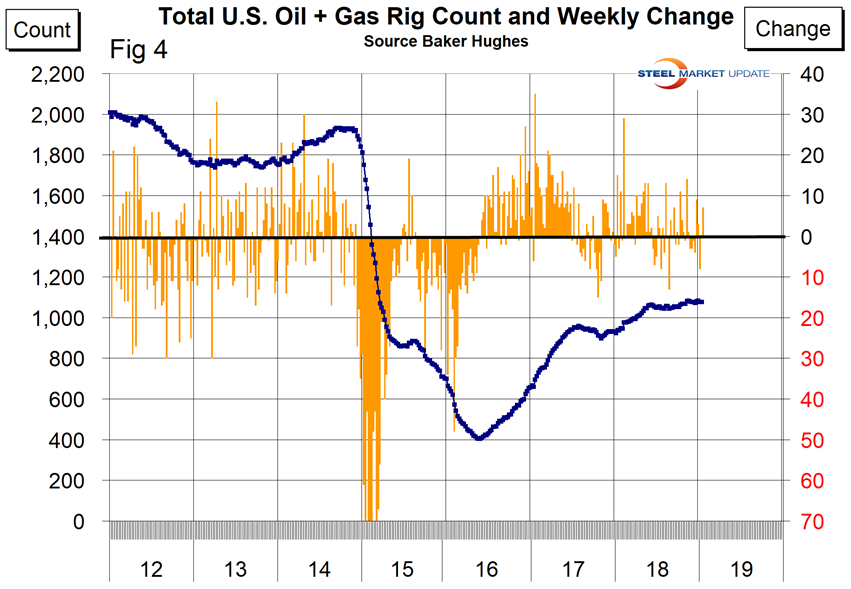
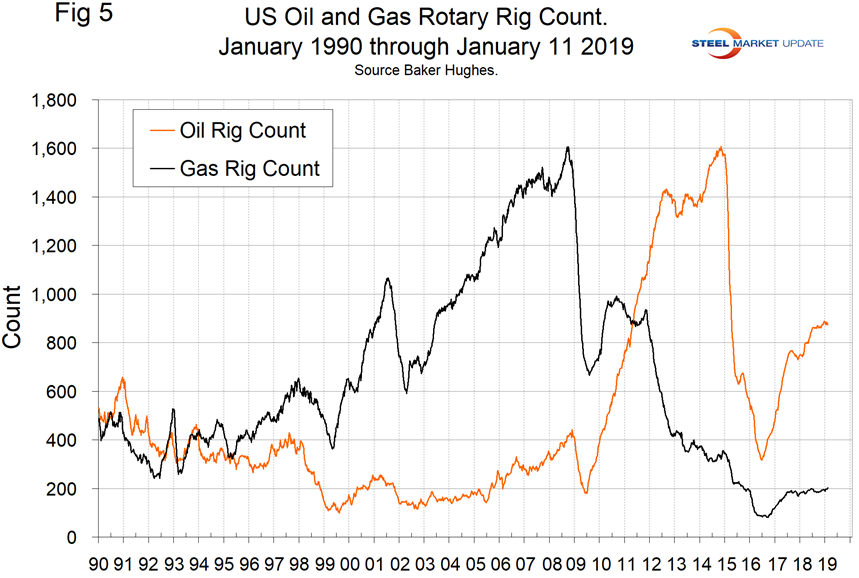
The oil rig count had a low point of 316 on June 27, 2016, and stood at 873 on Jan. 11, 2019. The count has increased by 131 since Jan. 5, 2018.
The U.S. gas rig count rose from its low point of 81 on Aug. 5, 2016, to 202 on Jan. 11. The year-over-year growth rate of total U.S. operating rigs was 14.5 percent in the latest data with oil up by 16.1 percent and gas up by 8.0 percent. Figure 5 shows the Baker Hughes U.S. Rotary Rig Counts for oil and gas equipment in the U.S. (explanation below).
On a regional basis in the U.S., the big three states for operating rigs are Texas, Oklahoma and North Dakota. Figure 6 shows the land rig count in those states since 2000.
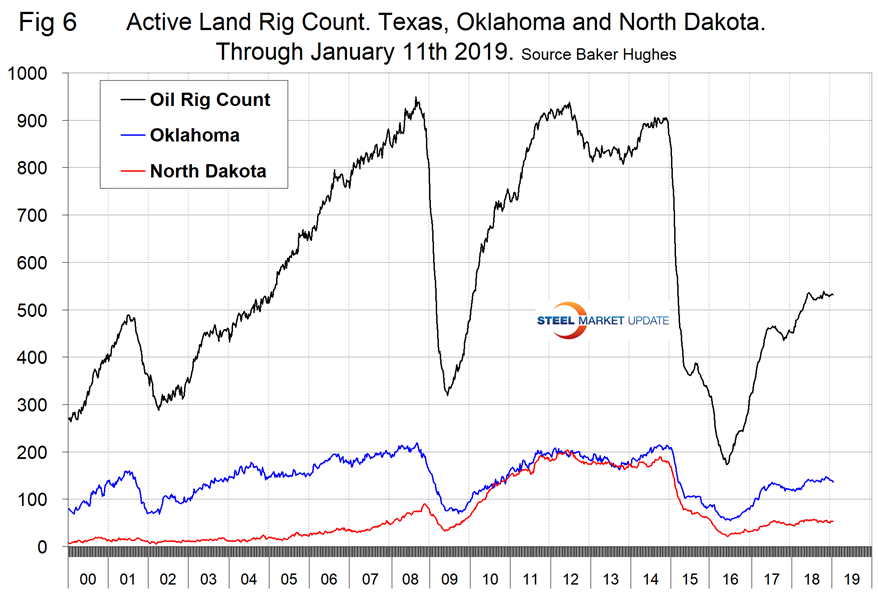
Figure 7 illustrates the monthly U.S. oilfield production of crude from January 1970 through October 2018 (latest data available) in thousands of barrels per month. The historical high was October 1970 at 310.4 million barrels. Production steadily declined to half that level in the late 2000s before the fracking revolution kicked in. December 2017 broke the record that had stood for 47 years with 310.7 million barrels produced, and October 2018 set a new record at 357.6 million barrels. EIA estimates that U.S. crude oil production averaged 10.9 million b/d in 2018, up 1.6 million b/d from 2017, reaching its highest level and seeing its largest volume growth on record. EIA forecasts U.S. crude oil production to average 12.1 million b/d in 2019 and 12.9 million b/d in 2020, with most of the growth coming from the Permian region of Texas and New Mexico.
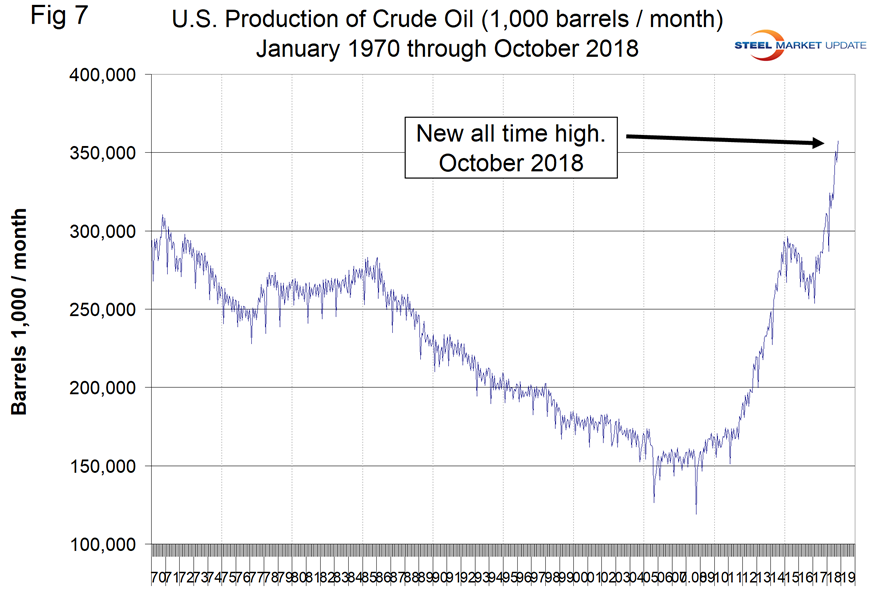
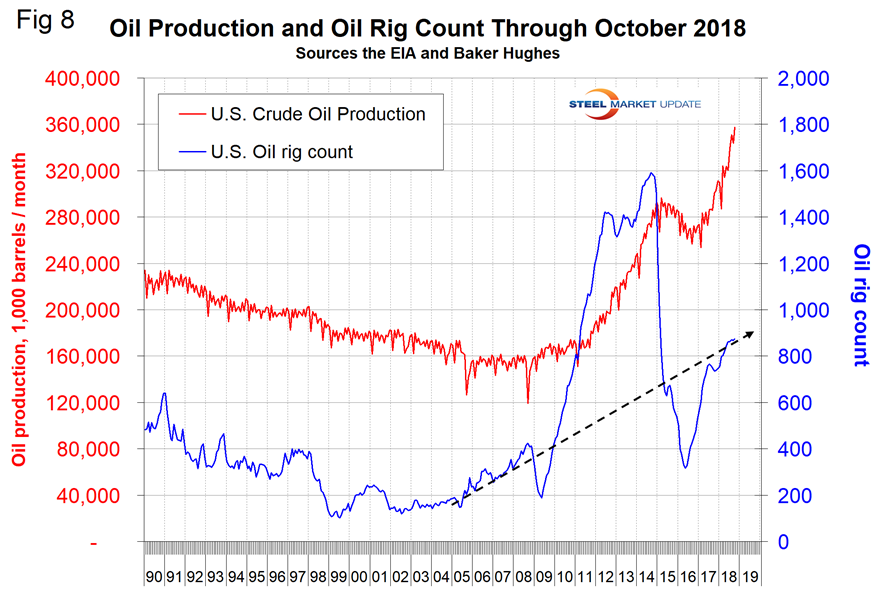
Figure 8 compares oil production and the oil rig count and shows how the increase in exploratory wells drove production from 2009 through late 2014 when the oil price collapsed. The subsequent decline in production was much less marked and is again setting new records. Our take on this is that the huge increase in exploratory oil rigs beginning in 2009 may have been an anomaly and that we won’t see a repeat of the number operating in 2014 for a very long time.
Baker Hughes Rotary Rig Count: This is a weekly census of the number of drilling rigs actively exploring for or developing oil or natural gas in the United States. Rigs are considered active from the time they break ground until the time they reach their target depth and may be establishing a new well or sidetracking an existing one. The Baker Hughes Rotary Rig count includes only those rigs that are significant consumers of oilfield services and supplies.


