Market Data

January 10, 2019
SMU Steel Buyers Sentiment Index: Year Off to a Mixed Start
Written by Tim Triplett
Steel Market Update’s Steel Buyers Sentiment Index began the year with another slight dip in optimism, as measured by both the Current Sentiment and the Future Sentiment three-month moving averages.
The goal of the index is to measure how buyers and sellers of steel feel about their company’s ability to be successful today (Current Index), as well as three to six months into the future (Future Index). Results are posted as both single data points and as three-month moving averages (3MMAs) to smooth out the trend.
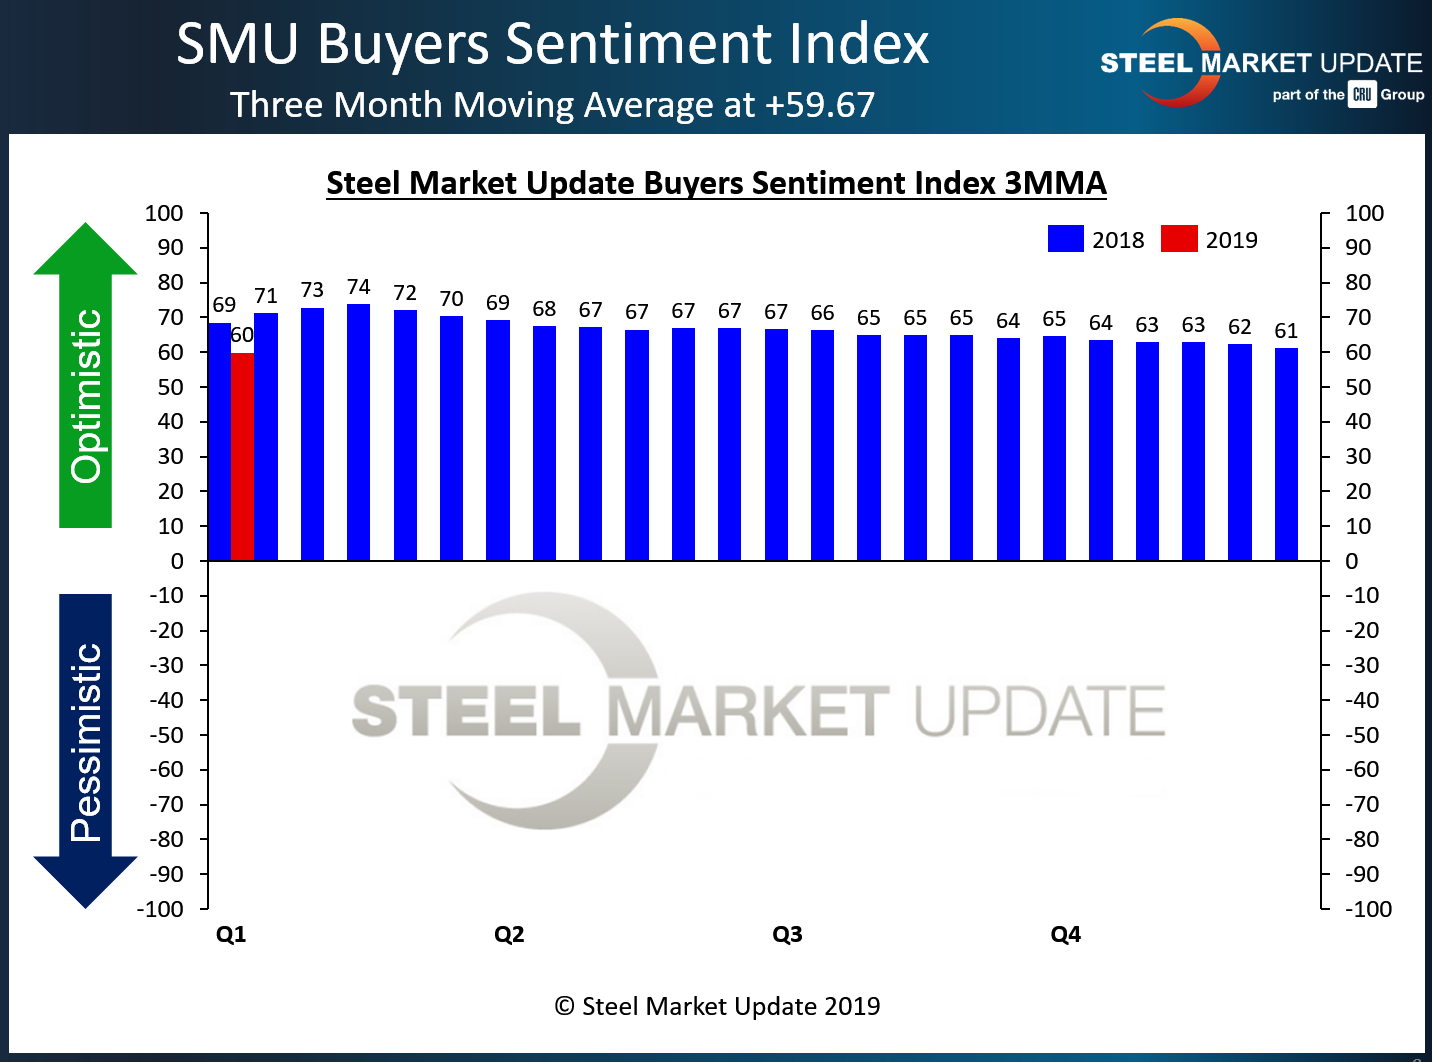
Current Sentiment measured as a single data point registered +58, up 4 points from mid-December. However, measured as a 3MMA, Current Sentiment dipped to 59.67 from 61.17 two weeks ago, the lowest reading in two years. Optimism was the highest this year when the Current Index registered +78 in mid-January. While still well within the “optimistic’ segment of our index (see below) we are concerned about the weakening we have seen in the index year over year. This slightly less optimistic trend began after the Section 232 tariffs were announced last year and have continued into 2019. You can clearly see the trend in the graphic below. After peaking at +74 early in 2018, you can see the slow slide (blue lines).

Future Sentiment
The trend is much the same for steel executives asked to assess their chances for success in three to six months. As a single data point, Future Sentiment registered +61, up 4 points from mid-December. Measured as a 3MMA, the Future Index averaged 58.83, a low seen only once since early 2016, and well off the 2018 high of 72.83 registered last February.
On a historical basis, the SMU Indexes remain solidly in optimistic territory. But the downtrend in the moving averages may reflect some uncertainty about the year ahead.

What Our Respondents Had to Say
- “The precipitous drop in prices has been very painful.”
- “We see many headwinds in 2019.”
- “Not a lot of activity.”
- “Demand seems slow to start the year, but should be steady. We hope to keep finding viable supply options, but there’s still too much uncertainty. Maybe the partial government shutdown will slow future trade action somewhat.”
- “Hopefully, trade wars with China will be settled and business can return to a more normal atmosphere. But looming national debt will force government cutbacks and a waning tax cut boost could start to soften the economy later in 2019.”
- “Worried about overall economy and demand. Unresolved artificial domestic price inflation.”
- “Steel prices have to stabilize. Cannot continue to drop. That will certainly cause some problems.”
- “Order book improving.”
- “Plate market is strong.”
- “First half 2019 looks very good for plate.”
- “We have some good orders on the books.”
- “Inventories are in good shape.”
About the SMU Steel Buyers Sentiment Index
SMU Steel Buyers Sentiment Index is a measurement of the current attitude of buyers and sellers of flat rolled steel products in North America regarding how they feel about their company’s opportunity for success in today’s market. It is a proprietary product developed by Steel Market Update for the North American steel industry.
Positive readings will run from +10 to +100 and the arrow will point to the righthand side of the meter located on the Home Page of our website indicating a positive or optimistic sentiment. Negative readings will run from -10 to -100 and the arrow will point to the lefthand side of the meter on our website indicating negative or pessimistic sentiment. A reading of “0” (+/- 10) indicates a neutral sentiment (or slightly optimistic or pessimistic), which is most likely an indicator of a shift occurring in the marketplace.
Readings are developed through Steel Market Update market surveys that are conducted twice per month. We display the index reading on a meter on the Home Page of our website for all to see. Currently, we send invitations to participate in our survey to more than 600 North American companies. Our normal response rate is approximately 110-150 companies. Of those responding to this week’s survey, 39 percent were manufacturers and 47 percent were service centers/distributors. The balance was made up of steel mills, trading companies and toll processors involved in the steel business. Click here to view an interactive graphic of the SMU Steel Buyers Sentiment Index or the SMU Future Steel Buyers Sentiment Index.


