Prices

January 3, 2019
HRC Futures: A Quick Look at the Curve
Written by Gaurav Chhibbar
Gaurav Chhibbar is a partner at Metal Edge Partners, a firm engaged in Risk Management and Strategic Advisory. In this role, he and his firm design and execute risk management strategies for clients along with providing process and analytical support. In Gaurav’s previous role, he was a trader at Cargill spending time in Metal and Freight markets in Singapore before moving to the U.S. He can be reached at gaurav@metaledgepartners.com for queries/comments/questions.
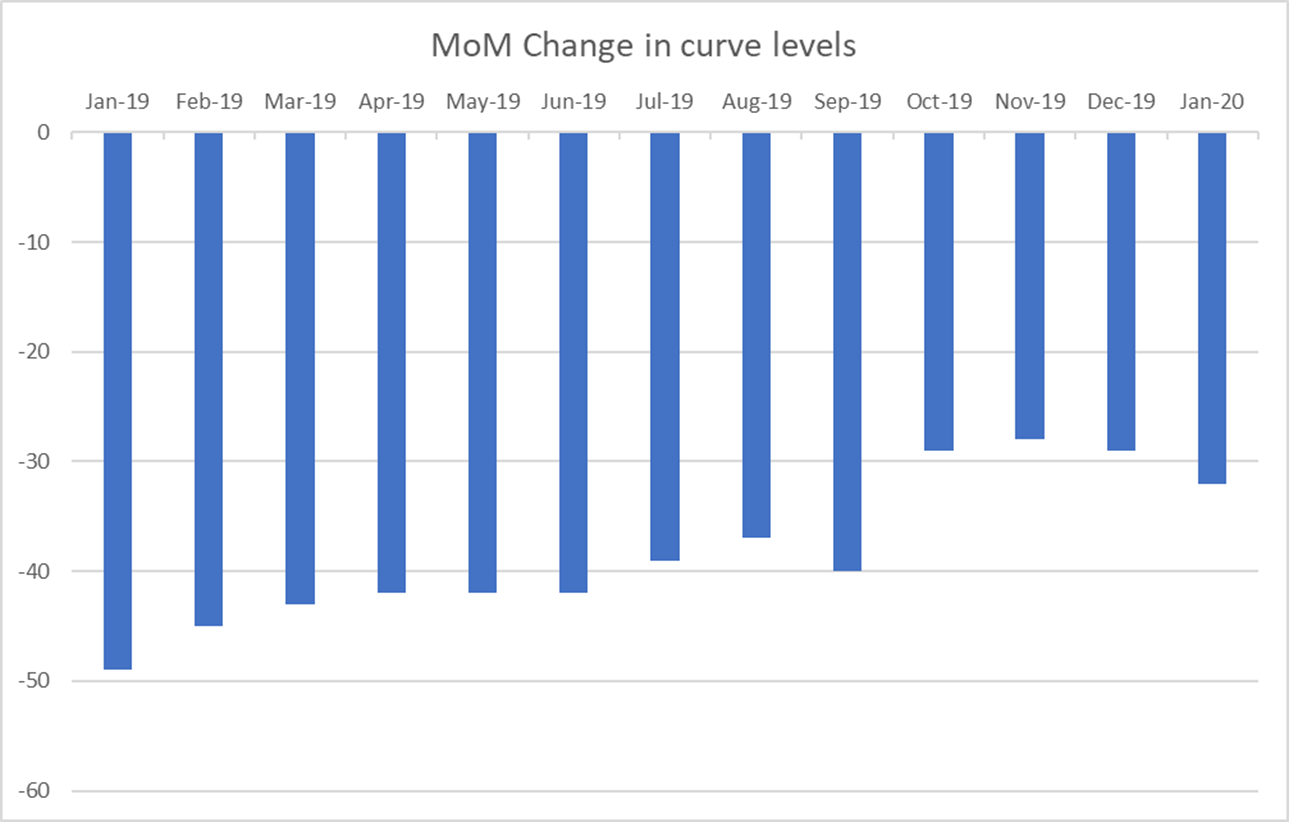
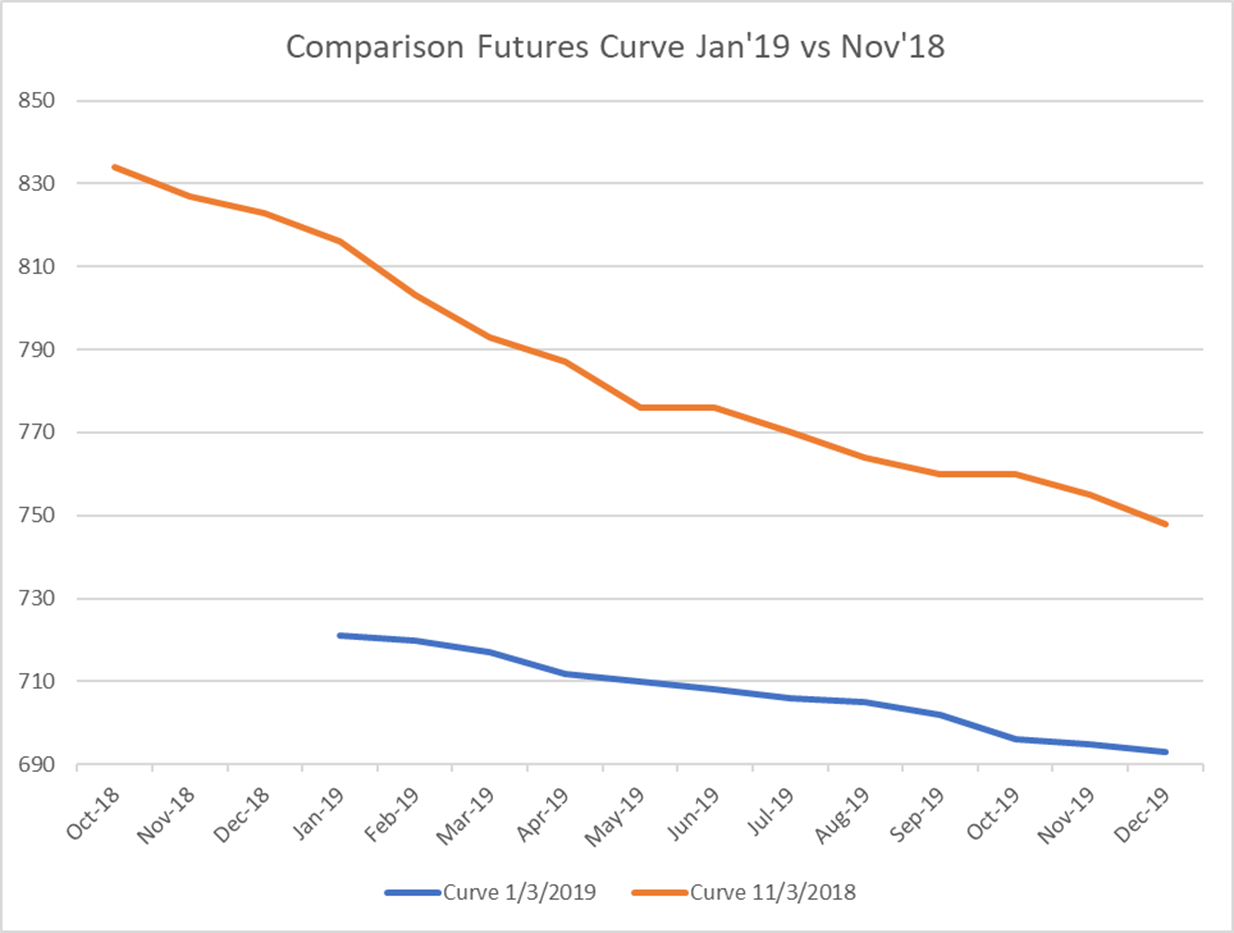
The front months of the futures curve have come down $40 to $50 in the last one month (Blue line – Jan. 3; Orange line – Dec. 3).
The combination of concerns over additional domestic and international supply and weaker demand have resulted in the drop in the benchmark index. In conjunction, the curve has seen participants willing to sell forward months cheaper than the front.
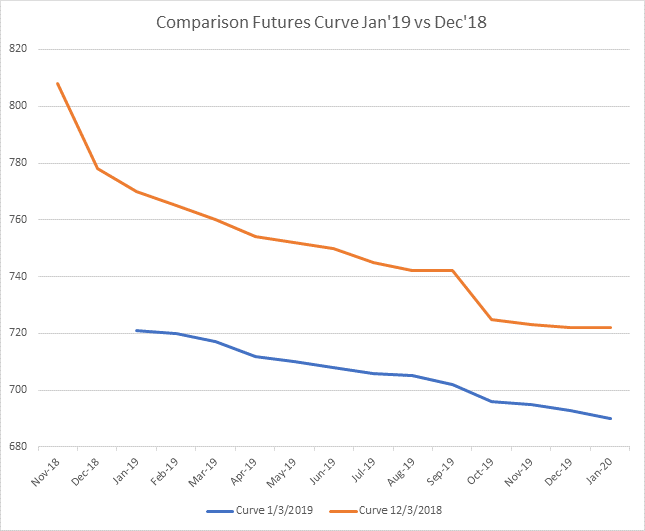
The resulting shape of the curve, referred to as backwardation, often results when there are expectations for an improved net supply in the future. Thus, prices in the future are cheaper than spot prices.
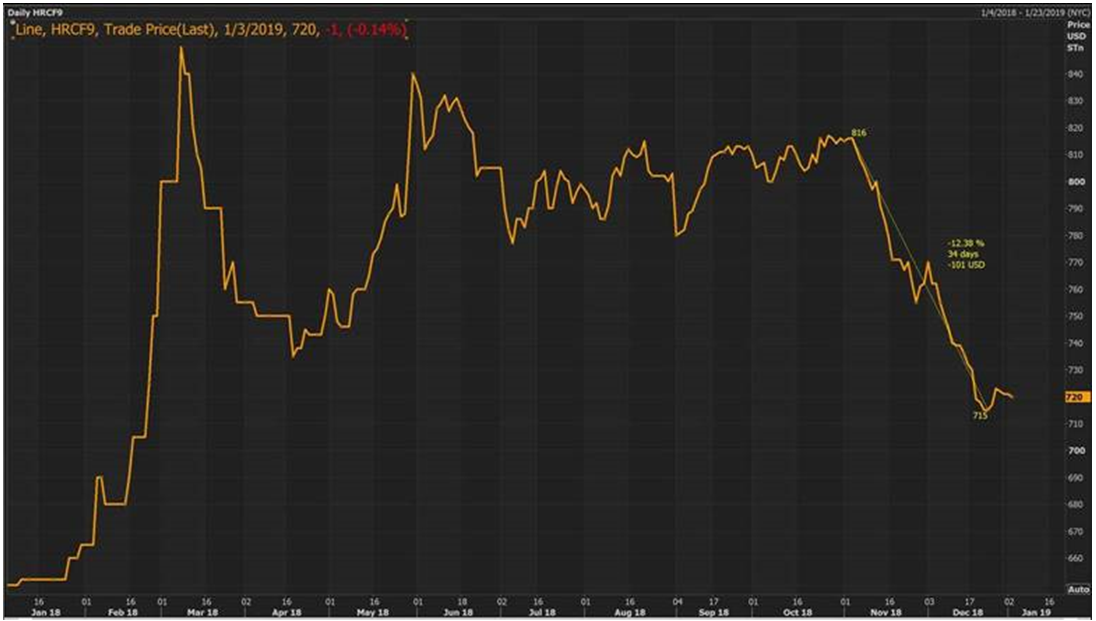
It is interesting, though, to look at the chart above and see how quickly some months have seen a drop in value. A comparison of Jan ’19 contract values today versus those on Nov. 5 indicates a $101 drop, compared to the $94 drop in the CRU index in the same time frame.
During discussions with a client today, I was asked if the curve may go into a contango and what that would imply. A contango is when the prices in the future months are higher than spot prices. Aggressive drops in the index can at times result in changes to the shape of a curve. While the U.S. HRC curve hasn’t moved from backwardation to a contango in the period from Nov ’18 (Orange line) to the start of Jan ’19 (Blue line), it has indeed become flatter. This flatter curve is indicative of both a lack of conviction of another major correction from the sellers, as well as a belief that we might be nearing the bottom.
While those looking at disappointing macro data and continued pressure on European steel prices might argue that there is still further downside, market players would do well to keep an eye on inventory levels and any signs of restocking in the market.
Given that this is the first look at the Futures for the year, I thought it would be valuable to share an update on the 2018 trade volumes. The CME reported that a total of 2.391 million tons were cleared, representing an increase of 88 percent year over year. This is a significant volume, especially considering this does not include OTC (over the counter) trades that would not have been cleared through the exchange.
We wish you all a happy new year ahead.
——————–
Disclaimer: The information in this write-up does not constitute “investment service,” “investment advice” or “financial product advice” as defined by laws and/or regulations in any jurisdiction. Neither does it constitute nor should it be considered as any form of financial opinion or recommendation. The views expressed in the above article by Metal Edge Partners are subject to change based on market and other conditions. The information given above must be independently verified, and Metal Edge Partners does not assume responsibility for the accuracy of the information.