Market Data

November 30, 2018
Consumer Confidence Loses Momentum in November
Written by Peter Wright
U.S. consumer confidence lost momentum in November. The Conference Board’s measure of consumer confidence declined for the month, but the three-month moving average (3MMA) continued to advance.
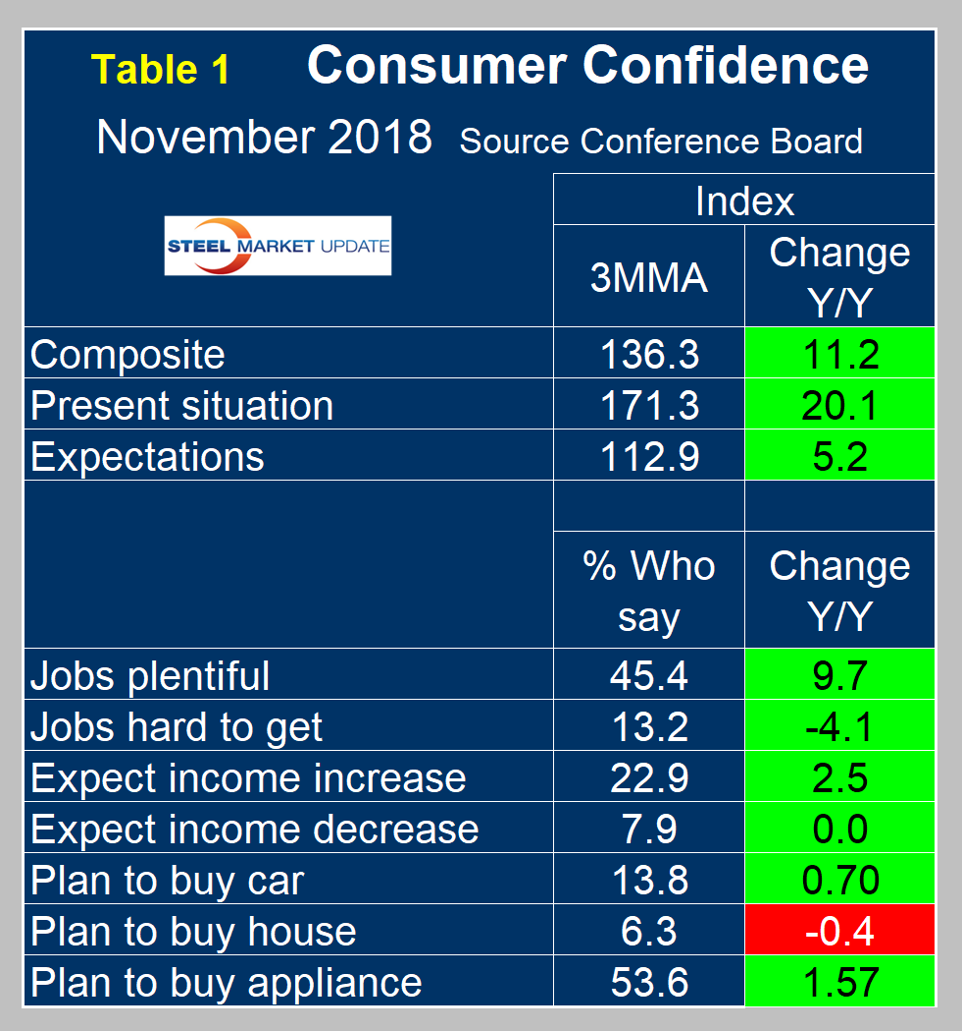
The board’s composite value of consumer confidence in November was 135.7, down from 137.9 in October. The 3MMA, which smooths the data to reduce monthly volatility, increased from 136.0 in October to 136.3 in November, which was 11.2 points higher than in November last year.
The composite index is made up of two sub-indexes. These are the consumer’s view of the present situation and his or her expectations for the future. Both are above their nine-year trend line, but both have lost momentum (Figure 1).
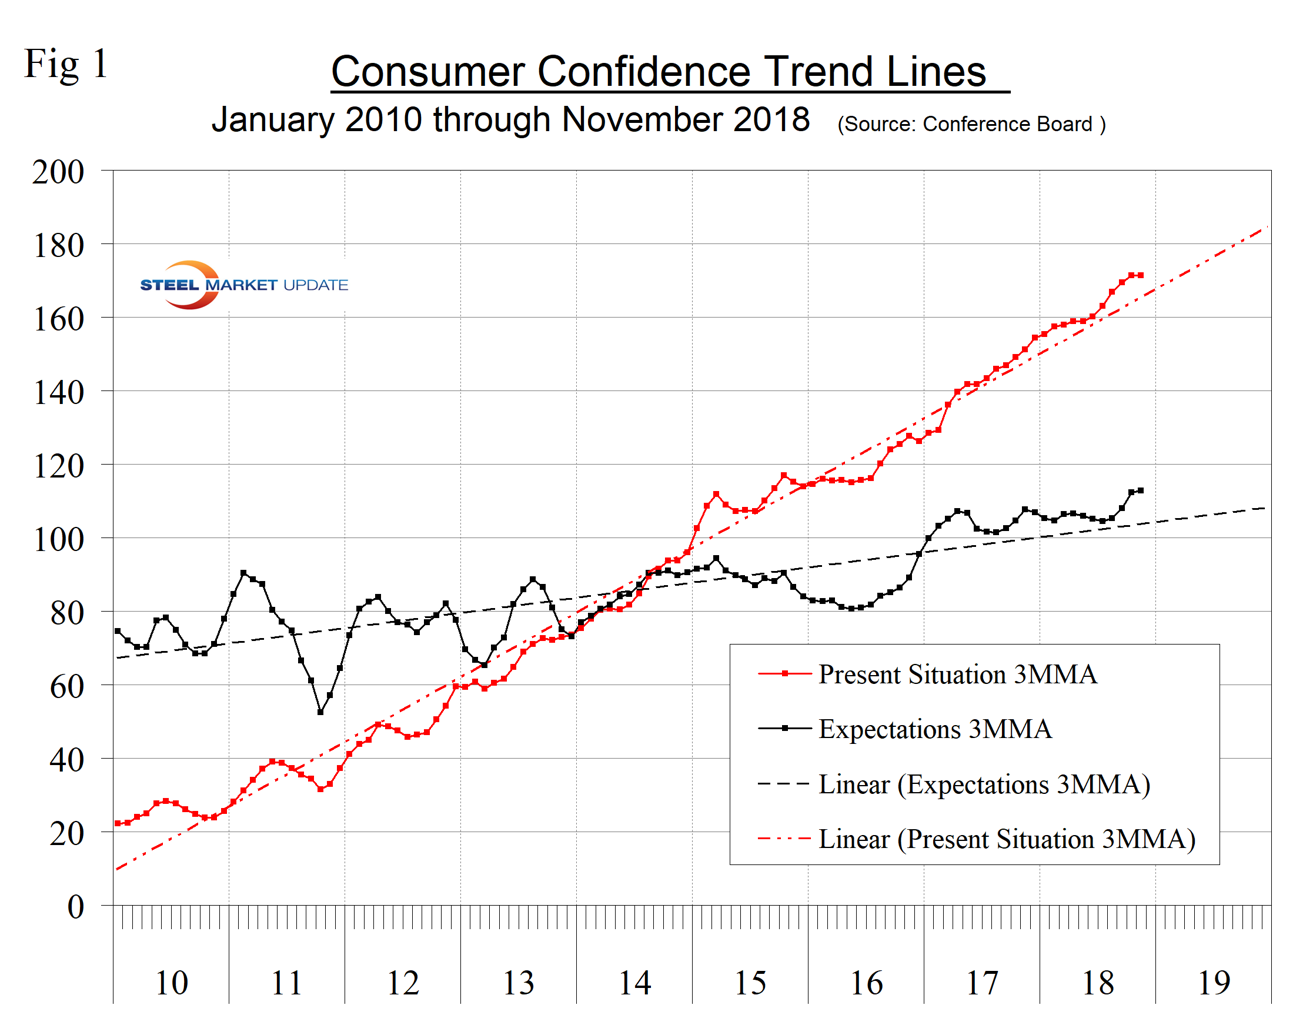
The decline in the monthly composite was entirely due to a decline in consumer expectations from 115.1 to 111.0 The consumer’s view of the present situation increased from 171.9 to 172.7. The historical pattern of the 3MMA of the composite, the view of the present situation and expectations since January 1990 are shown in Figure 2.
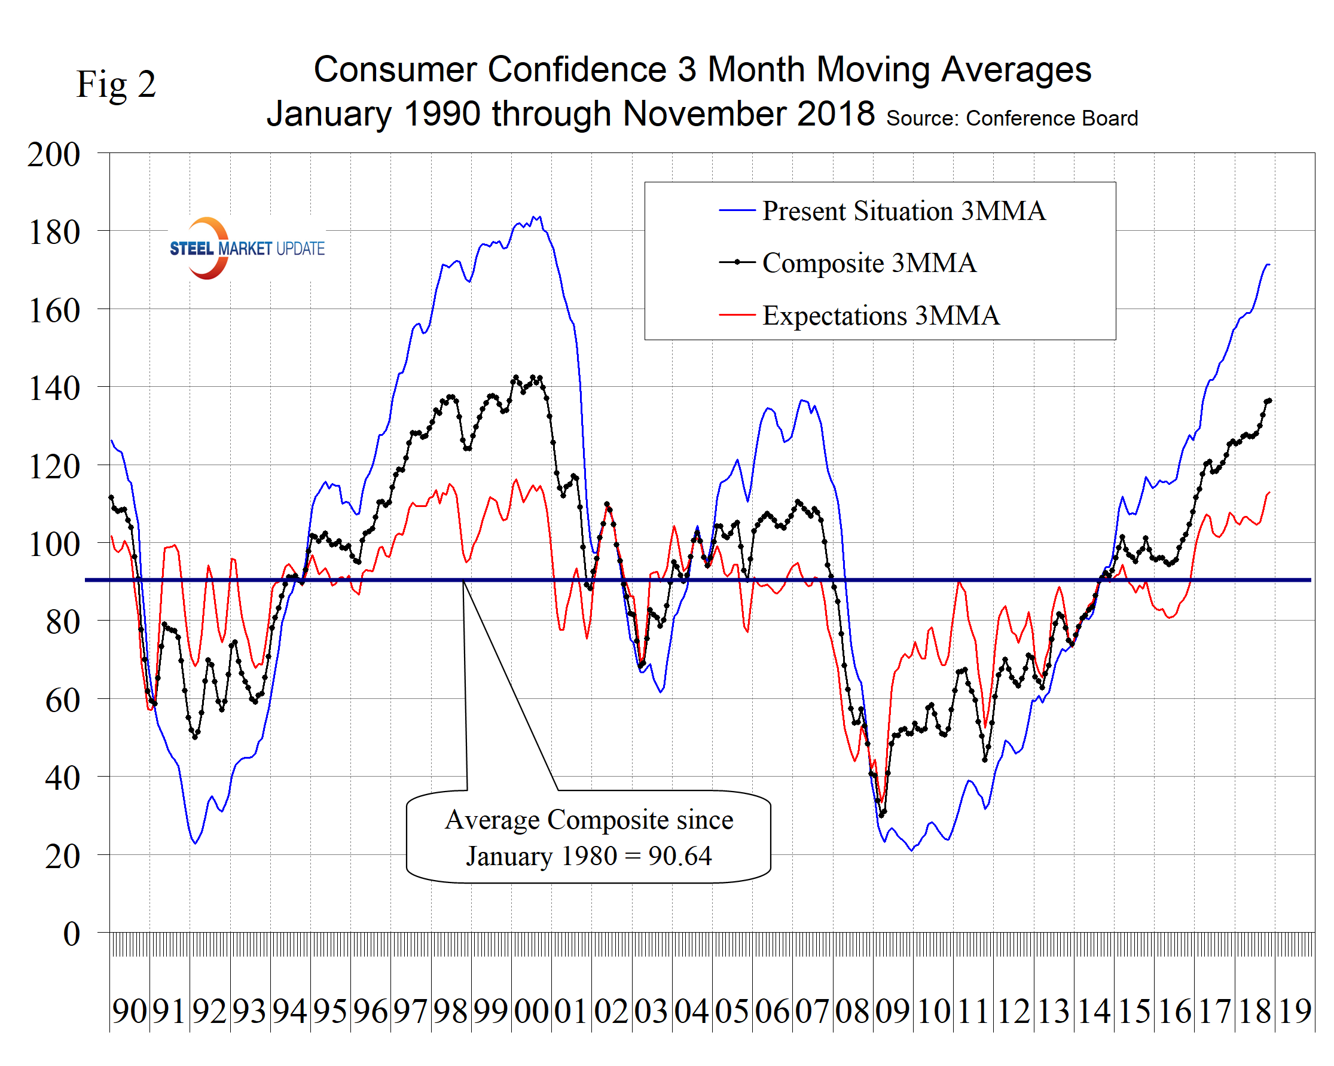
All three measures are higher than they were at the pre-recession peak of 2007 and are approaching the level enjoyed in the late ’90s. Expectations were relatively constant for over a year until August when there was a breakout to the upside. The November decline was insufficient to change that picture. The consumer’s view of the present situation has been surging since December 2010. Comparing November 2018 with November 2017, the 3MMA of the present situation was up by 20.1 and expectations were up by 5.2 points (Table 1).
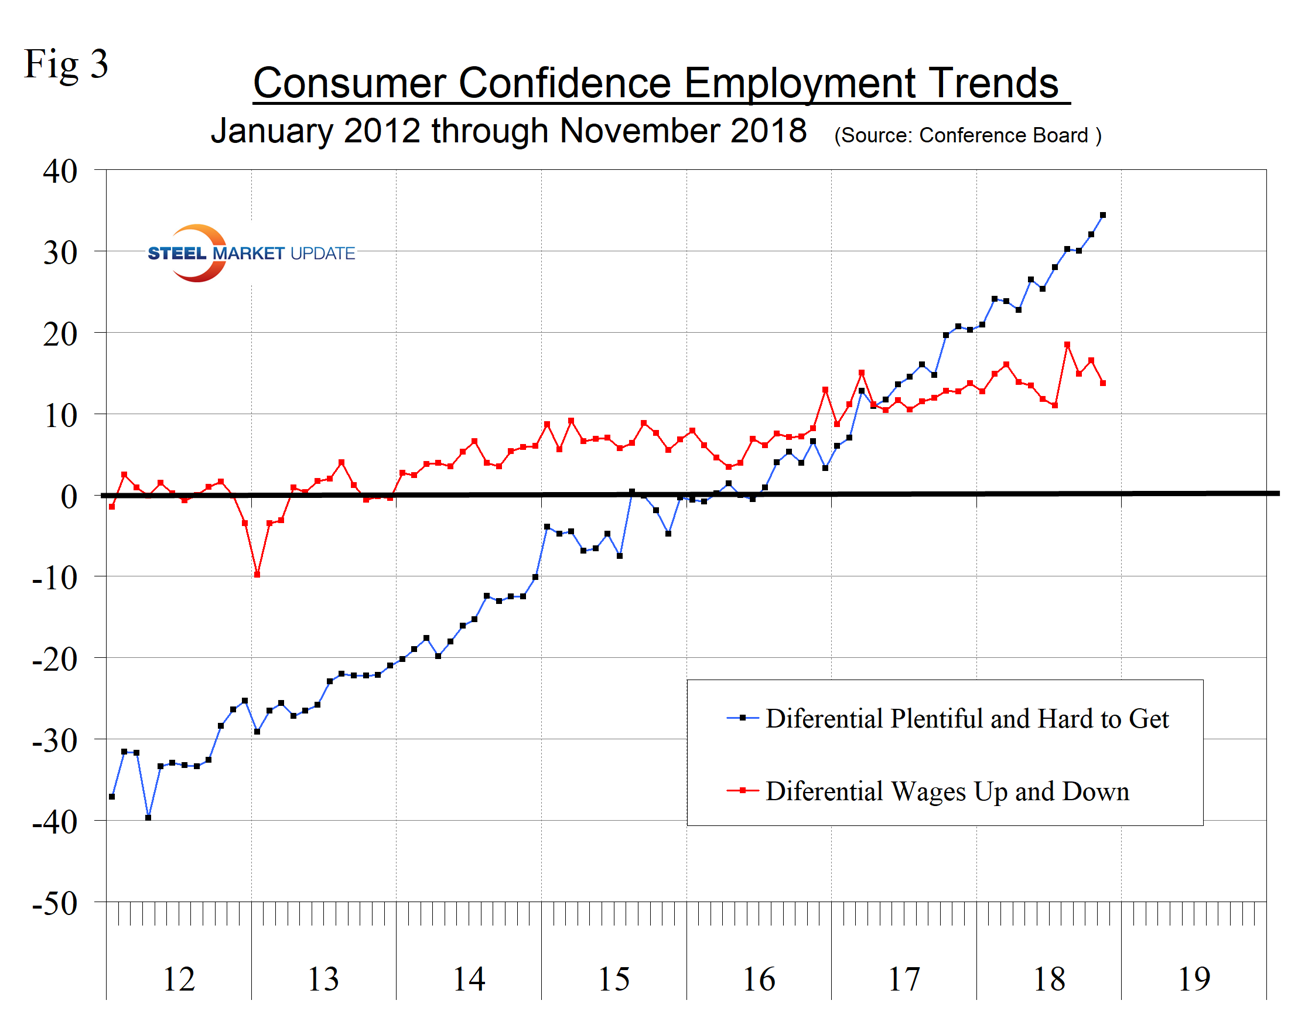
The consumer confidence report includes encouraging data on job availability and wage expectations. It reports on the proportion of people who find that jobs are hard to get and those who believe jobs are plentiful, and it measures those who expect a wage increase or a decrease. Since January 2012, the consumer’s view of job availability has surged. The difference between the percentage of those finding jobs plentiful and the percentage finding jobs hard to get has improved from a low of negative 40 percent at the beginning of 2012 to positive 34.4 percent in November 2018. Expectations of a wage increase have been less optimistic with the up/down differential declining from positive 18.5 percent in August to positive 13.7 percent in November.
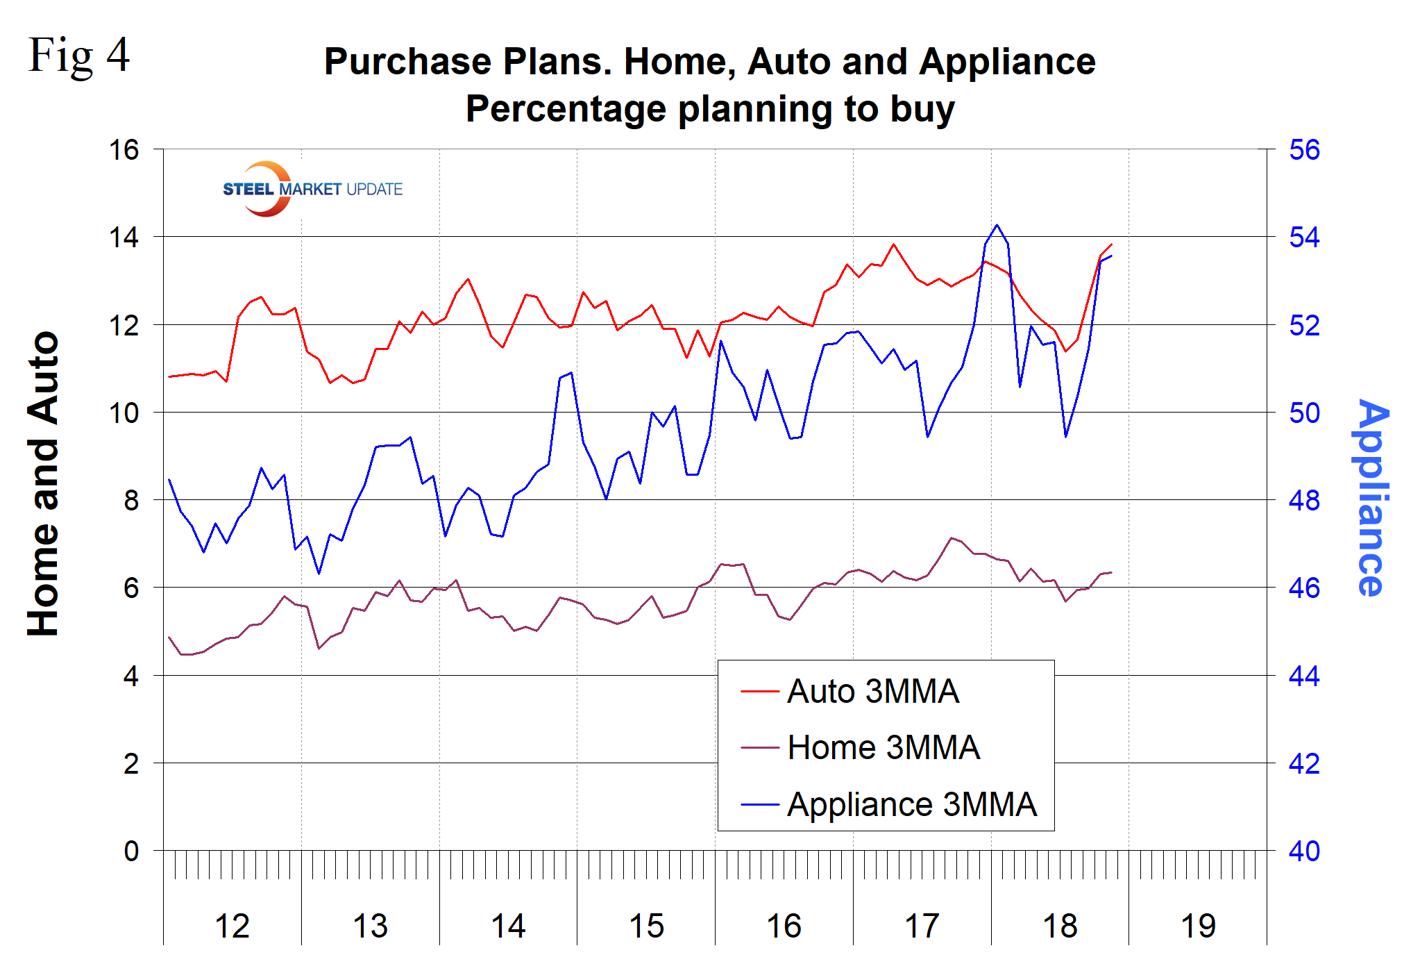
Plans to buy a car had been drifting down for nine months through July this year, but picked back up in the last four months of data. Plans to buy an appliance have been erratic, but there has been an upward trend since our data stream begins in 2012. Plans to buy a home drifted down from September 2017 through July 2018, but have picked back up in the last three months (Figure 4).
SMU Comment: Steel demand is dependent on the growth of GDP, which in turn is strongly influenced by consumer confidence and disposable income. The current consumer confidence report continues to be good in both these respects.
About The Conference Board: The Conference Board is a global, independent business membership and research association working in the public interest. The monthly Consumer Confidence Survey®, based on a probability-design random sample, is conducted for The Conference Board by Nielsen. The index is based on 1985 = 100. The composite value of consumer confidence combines the view of the present situation and of expectations for the next six months.


