Market Data

November 29, 2018
Service Center Spot Pricing: Has the "Pain" Begun?
Written by John Packard
Returns from Steel Market Update’s market trends questionnaire show a growing percentage of manufacturing companies reporting service center spot pricing on flat rolled products as being lower than what they saw at the beginning of November. Seventy-three percent of the manufacturing respondents reported seeing slipping spot prices this past week. This is an increase of 23 percentage points from the beginning of the month. Since late third quarter, the end users have been consistently reporting lower spot numbers out of their steel distribution suppliers.
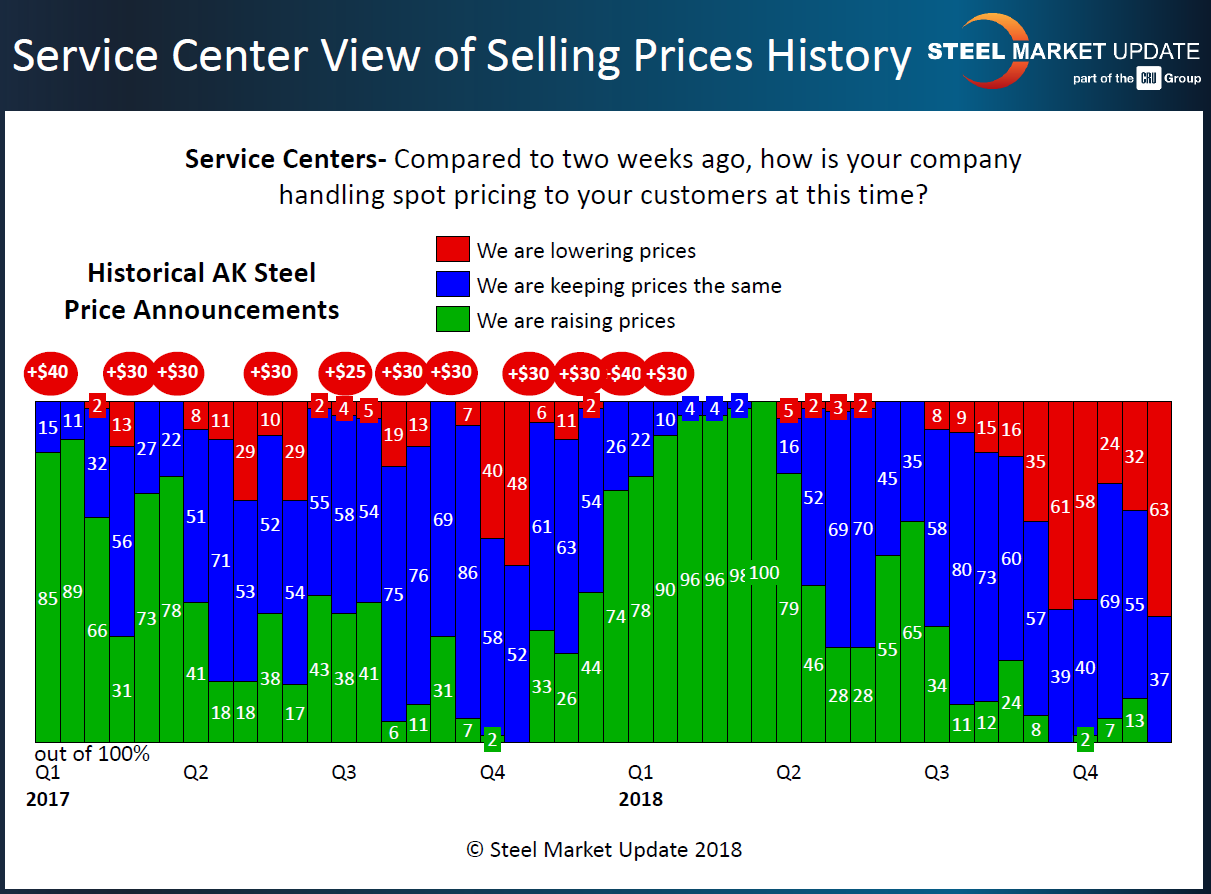
Service centers agree with their manufacturing customers with 63 percent of the distributors reporting their company as lowering spot prices to their customers. This is an increase of 31 percent compared to our early November analysis. Our service center respondents have not been reporting prices as dropping as consistently (or deeply) as the manufacturers. When Nucor made their price announcement, there was a very weak attempt (see green bars at the beginning of Q4 in the graphic below) by a small group of distributors to move prices higher. That clearly failed based on the results of this past week.

The lack of support for higher spot prices doomed the Nucor-led price increase announcement on flat rolled. It is Steel Market Update’s opinion that distributors are critical and must support the idea of a higher price structure in order for the domestic steel mills to capture higher spot pricing. This can be seen better when we overlay AK Steel price increase announcements on the service center graphic (see below).
If you recall, flat rolled steel prices began moving higher during fourth-quarter 2017 and peaked in July 2018 (early Q3). After that, prices began slipping, which is represented on this graphic by the growth in the red bars and the elimination of the green bars that represent those reporting their company as pushing spot prices higher. AK Steel did not publish a price increase when Nucor did, so it is not referenced in the graphic below. However, you can clearly understand why (or one reason why) the Nucor-led increase failed to materialize.

For those of you new to our Service Center Spot Index, we have identified a point of “capitulation,” which we have calculated to be when approximately 75 percent of the service center respondents report their company as lowering spot pricing to their customers. As the lower prices escalate from week to week, the distributors become more concerned about the value of their inventories and become willing to support a change in price direction, which can only come from a steel mill price increase announcement. As you can see from the service center graphics shared above, the percentage of distributors reporting lower spot prices has not reached 75 percent during calendar year 2018.
In SMU’s opinion, the price increases pushed through from the fourth quarter until the end of the second quarter were primarily due to government intervention in the price of steel, first by threatening tariffs and then by instituting the Section 232 tariffs.
We have been asked if we think steel prices will rise in 1Q 2019. Our belief is we will need to see more “pain” out of the service center group, which will be represented by the red bars extending to 75 percent (or more) and over an extended period of time (not necessarily when it first reaches that level). With 63 percent of the service centers reporting they are lowering their spot prices, we could be seeing the beginning of that period of “pain.”